Munich Personal RePEc Archive
Systematic Approach to the Allocation of
Budgets for humanitarian Aid Programs:
A Practical Tool for International NGOs
Malki, Elli
9 September 2008
Online at
https://mpra.ub.uni-muenchen.de/11200/
Systematic Approach to the Allocation of Budgets for humanitarian Aid Programs: A Practical Tool for International NGOs .
Elli Malki Financial-Tip POB 44034
Jerusalem 91440, Israel. [email protected] September 2008 Abstract
This article presents a model for budgetary allocation that was used by an international NGO for its aid program. The features of the model are explained and demonstrated. The model enables NGOs to allocate budgets based on impartial, objective and transparent criteria. It also presents explicitly the policy choices that face the NGO and allows staff and funders to evaluate the costs and benefits of their choices.
1) Introduction
International NGOs (INGOs) that are engaged in humanitarian aid programs must make hard choices when they allocate their budgets. As the scope of the INGO's program increases, and it covers more countries, the decision on the allocation of budgets becomes more complex. Scarce resources limit the ability of the INGO to meet its objectives fully, and thus the criteria for budgetary allocation becomes critical. The new approach to NGO's accountability (Lee 2004, Ebrahim 2003) is that NGOs are accountable to a large group of stakeholders, specifically to their funders and to their beneficiaries. It is straightforward that beneficiaries expect NGOs to use
impartial, objective and transparent criteria as the basis for their budgetary allocation. Most funders will also require objective and transparent criteria for budgetary allocation, especially governmental and international agencies that are subject to public scrutiny. However, devising and implementing such criteria is not a straightforward task. The model that is presented in this article was developed and implemented successfully in a large INGO for its international aid program. This INGO, that will be referred to hereinafter as Charity-X, has initiated an extensive aid program that serves more than 200,000 clients in several countries. The target population of Charity-X are the elderly, and the goal of the program is to bring the clients to an acceptable standard of living for the rest of their lives. Charity-X's program consists of a network of welfare centers that provide eligible clients with basic material assistance like basic food products, canteen meals and basic medicines. About 12% of the clients have functional limitations and receive also home care services. The welfare centers are spread in several countries, and in several locations in each country; nevertheless the service model of each center is basically identical. Charity-X has an efficient management information system (MIS) that collects data on clients including their income level, functional status and a full documentation of the services that they received.
Given its program's scope Charity-X's management found it necessary to develop an allocation model for budgeting the welfare centers. The basic features of this model are described in the following sections.
2) Measuring the Standard of Living
The first step, for any aid program, is to measure the problem that we want to solve. A recent article in the Economist on the measurement of poverty line quoted the late senator Daniel Patrick
target population's standard of living is inadequate. The simplest measure for standard of living is the client's income level. Despite its simplicity, income level has several advantages for budgetary allocation: it's obtainable via Charity-X's MIS, it is comparable between regions (see section (3)) and it can be benchmarked.
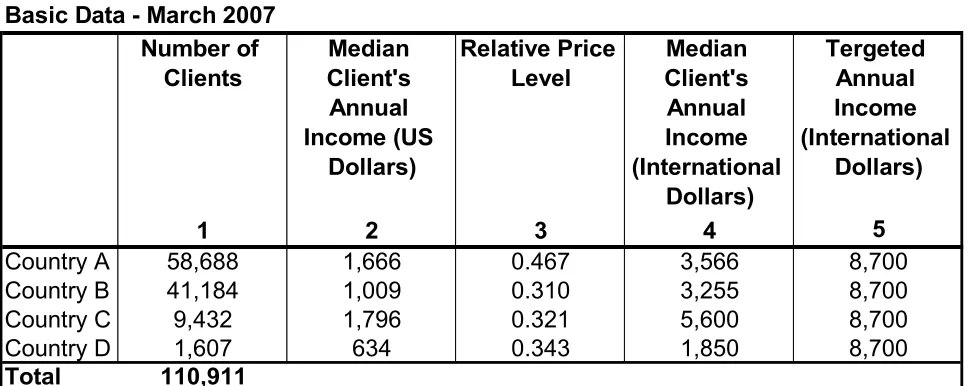
[image:3.595.57.542.167.360.2]In section (5) I will present additional measures of standard of living beyond income. The basic data that were used for the allocation model are presented in Table 1. Table 1:
For this illustration, the allocation is presented on a country level, but its extension to a center level is straightforward. The data presented in Table 1 are real figures that were used by Charity-X's management in the summer of 2007, to prepare the budget allocation for the next year. The figures relate to a specific sub-group of the clients, for which Charity-X received special grants to be used for welfare services as described above. This sub-group consisted of about 111,000 clients in four countries. The median client's income, in US dollars, in each country is presented in column 2. There is a significant difference in the level of income between the countries, as the median income in country C is almost threefold than the median income in country D. However, international comparison of income level cannot be done by simply comparing the dollar income. Poorer
countries tend to have lower price levels that richer countries, and thus the same level of income in dollars will enable a higher level of consumption in the poorer country. In order to accurately compare the level of income between the four countries we have to take into account the relative price level in each country.
3) Measuring the Relative Price Level
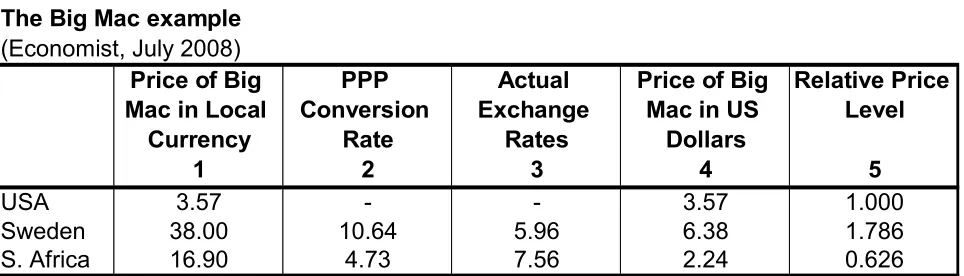
A country's relative price level is related to the Purchasing Power Parity (PPP) conversion rates (Schreyer and Koechlin 2002). A light demonstration of PPP conversion rates is the Big Mac Index published by the Economist. The Economist compares the prices of Big Mac hamburgers, which are assumed to be identical everywhere, in various countries to the their price in the USA. For example, figures for three countries, from the recent survey, are presented in Table 2 in the next page.
Basic Data - March 2007 Number of
Clients
Median Client's Annual Income (US
Dollars)
Relative Price Level
Median Client's Annual Income (International
Dollars)
Tergeted Annual Income (International
Dollars)
1 2 3 4 5
Country A 58,688 1,666 0.467 3,566 8,700
Country B 41,184 1,009 0.310 3,255 8,700
Country C 9,432 1,796 0.321 5,600 8,700
Country D 1,607 634 0.343 1,850 8,700
Table 2:
The prices of Big Mac hamburgers, in local currency, were $3.57 in the USA, 38 Kronas in Sweden and 16.9 Rand in South Africa (column 1).
The calculation of PPP conversion rates is presented in column 2: Sweden:
38 / 3.57 = 10.64 Kronas to US dollar. South Africa:
16.9 / 3.57 = 4.73 Rand to US dollar.
If the actual exchange rates of the Krona an the Rand were equal to the PPP conversion rates, the dollar price of the Big Mac hamburgers in Sweden and South Africa was equal to their price in the USA - $3.57.
However, the market exchange rates are different from the PPP conversion rates: 5.96 Kronas to US dollar and 7.56 Rand to US dollar (column 3).
Thus, the prices in US dollars of Big Mac hamburgers in theses countries differ from their price in the USA (see column 4).
The relative price level of the Big Mac hamburger is the ratio of the local price in dollars to the price in the USA (column 5):
Sweden:
$6.38 / $3.57 = 1.786. South Africa:
$2.24 / $3.57 = 0.626.
Thus, Big mac hamburgers are 37.4% cheaper in South Africa, and 78.6% more expensive in Sweden, than in the USA.
Generalizing the concept of PPP conversion rate and relative price level we can say that, given an identical basket of goods of services, the following definitions hold:
(I) PPP = Basket(A) / Basket(US) PPP - The PPP conversion ratio.
Basket(A) – The price of the identical basket in country A. Basket(US) - The price of the identical basket in the USA.
(The use of USA as a base country for calculating PPP conversion rates and relative price levels is The Big Mac example
(Economist, July 2008) Price of Big Mac in Local
Currency
PPP Conversion
Rate
Actual Exchange
Rates
Price of Big Mac in US
Dollars
Relative Price Level
1 2 3 4 5
USA 3.57 - - 3.57 1.000
Sweden 38.00 10.64 5.96 6.38 1.786
only a convention; in general any currency (and the respective country's price level) can be used as the basis for such calculation).
(II) RPL = [Basket(A) / XRATE] / Basket(US) = = [Basket(A) / Basket(US)] / XRATE =
= PPP / XRATE RPL – Relative price level.
XRATE – The market exchange rate of the currency of country A to the US dollar.
The relative price level is equal to the ratio of the PPP conversion rate to the actual exchange rate.
A comprehensive survey of worldwide prices is done by the World Bank via the International Comparison Program (ICP). Data are collected on a wide variety of products and services in 146 countries. PPP conversion rates andthe respective relative price levels, are calculated for each country, both for the entire economy and for its segments. The PPP conversion rates for a country can be used to compare income levels between countries. In order to explain this concept I will go back to the Big Mac example:
Suppose that a South African citizen receives a monthly income of 1,690 Rand and that this person consumes only Big Mac hamburgers. Since the market exchange rate to the US dollar is 7.56 Rand, his dollar income is $224. However, since the price of a Big Mac in South Africa is 16.9, our citizen can buy 100 hamburger that will cost in the USA $357 dollars. In other words, if we use the PPP conversion rate of 4.75 Rands to US dollar, instead of the market exchange rate, his income will be : 1,690 / 4.73 = 357 International Dollars.
When income figures for different countries are presented in International Dollars they are comparable and reflect the US price level.
Generalizing the concept of income in international dollar, the following definition holds: (III) Income (international dollars) = Income(L) / PPP
Income(L) – Income in local currency.
By inserting (II) into (III) we get a second definition of income in international dollars: (IV) Income (international dollars) = [Income(L) / XRATE] / RPL
To demonstrate definition (IV) let's go back to our hamburgers-consuming citizen. The ratio of his income in US dollars ($224) to the relative price level (0.627) is equal to his income in international dollars (357).
Table 3:
The PPP conversion rates of actual individual consumption were taken from the ICP most recent survey that was conducted in 2005 (column 1).
Since the income data are updated to March 2007, the PPP conversion rate had to be adjusted accordingly. By definition, PPP conversion rate is the ratio between prices of two identical baskets of goods and services, measured in two countries, at a certain point in time. In order to adjust these prices to a different point in time we have to use appropriate price deflators. This is done by the following definition:
(V) PPP(1) = PPP(0) * [1 + CPI(A)] / [1+ CPI(US)] PPP(1) – PPP conversion rate in period 1 (column 4).
PPP(0) – PPP conversion rate in the base period (column 1).
CPI(A) – The rate of increase in the consumer price index (CPI) of country A from the base period to period 1 (column 2).
CPI(US) – The rate of increase in the CPI of the USA from the base period to period 1 (column 3). (The CPI is the appropriate price deflator since we use the PPP conversion rate of actual
individual consumption).
The adjusted PPP conversion rates (column 4) are then divided by the respective market exchange rates (column 5) in order to obtain the relative price levels for individual consumers (column 6). It is not surprising that all the four countries have relative price levels that are substantially lower than the USA. What is more important for our analysis is that there is a substantial difference between the countries. The most noticeable is the relative price level of country A which is 50% higher than the respective price levels of the other three countries.
Returning to Table 1, column 4 presents the median income in each country translated to
international dollars. The effect of the relative price level on the median income in international dollars is quite significant. For example, the median income of country A, in US dollars, is 65% higher than the respective income of country B. However, when translated to international dollars, this difference is narrowed to 9.5%.
4) The Allocation Model
The comparison between clients' median income, using international dollars, enables Charity-X to determine its intervention model. Since the level of income of the clients is considered as
inadequate, Charity-X sets a targeted level of income to which it wants to bring its clients. Since the targeted income level is measured by international dollars, and since by definition international dollars relate to the price level of the USA, Charity-X decides to use the US poverty line as its benchmark. The US poverty line (Cauthen and Fass 2008) is appropriate for this purpose since it is an absolute measure (based on the cost of a basket of goods and services) and not a relative measure (based on a fraction of the country's median income). In 2008 the annual poverty line in the US was $10,400 for a single person and $14,000 for a family of two. Charity-X's clients are divided, more or less equally, between clients who live alone and clients who live with their spouses. Thus, the
Calculation of Country's Relative Price Level PPP
Conversion Rates 2005
CPI Increase 2005 - 3/2007
US CPI Increase 2005 - 3/2007
PPP Conversion Rates 3/2007
Exchange rates 3/2007
Consumers Relative Price
Level
1 2 3 4 5 6
Country A 11.0 16.6% 5.2% 12.2 26.01 0.467
Country B 1.4 17.5% 5.2% 1.6 5.05 0.310
Country C 635.5 13.7% 5.2% 687.1 2143 0.321
targeted income level (Table 1 column 5) was determined to be the average US poverty line for individual who lives alone ($10,400) and individual who lives with a spouse ($7,000). By setting the benchmark at the US poverty line, Charity-X can define its goal to its funders in a very clear way: to bring the clients to the minimal standard of living that is acceptable in the USA.
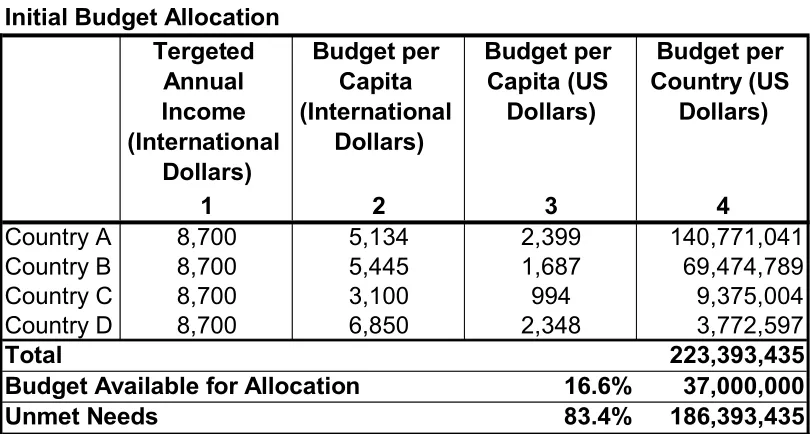
[image:7.595.57.462.180.397.2]After setting the targeted income we can determine the budget per capita in international dollars by subtracting the median client income in international dollars (Table 1 column 4) from the targeted income level (Table 1 column 5). The calculation is presented in Table 4 and figure 1.
[image:7.595.56.536.235.658.2]Table 4:
Figure 1:
The budget per capita (BPC) in international dollars (column 2) reflects Charity-X's intervention model: the highest level of aid is provided to clients in country D, who are the poorest, while the lowest level of aid is provided in country C, in which the standard of living of the clients is
relatively the best. Thus, the intervention model is differential and is a function of the clients needs, that are measured by their level of income. The next step is to translate the BPC in international
Initial Budget Allocation Tergeted
Annual Income (International
Dollars)
Budget per Capita (International
Dollars)
Budget per Capita (US
Dollars)
Budget per Country (US
Dollars)
1 2 3 4
Country A 8,700 5,134 2,399 140,771,041
Country B 8,700 5,445 1,687 69,474,789
Country C 8,700 3,100 994 9,375,004
Country D 8,700 6,850 2,348 3,772,597
Total 223,393,435
Budget Available for Allocation 16.6% 37,000,000
Unmet Needs 83.4% 186,393,435
Initial Budget Allocation
0 1,000 2,000 3,000 4,000 5,000 6,000 7,000 8,000 9,000 10,000
Country A Country B Country C Country D
In
te
rn
a
ti
o
n
al
D
o
ll
a
rs
dollars to BPC in US dollars (column 3). Such translation is done by multiplying the BPC in
international dollars by the relative price level (Table 1 column 3). This step is not merely technical; it reflects the fact that the program is more expensive in a country with a higher relative price level. For example, the BPCs in international dollars of countries A and B are almost equal; however, once translated to US dollars the BPC of country A is 40% higher than the BPC of country B, reflecting the higher cost of the program in country A.
The last step is to multiply the BPC in UD dollars by the number of clients (Table 1 column 1) and to receive the budget allocation for each country (column 4).
The first iteration of the model is completed, however its results are not yet applicable. The total budget that Charity-X needs in order to accomplish its mission – bringing the clients to an acceptable standard of living – is $223.4M. However the resources that are available for this sub-group of clients are a small fraction of this amount - $37M. Thus, Charity-X cannot achieve its goal with the existing resources and has to, either try and raise more funds for this program, or redefine the acceptable standard of living for its clients.
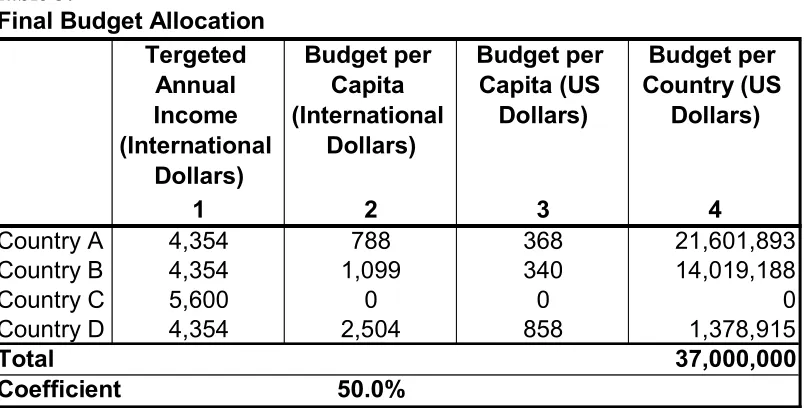
[image:8.595.61.463.399.603.2]The above analysis demonstrates some of the advantages of our allocation model. It shows, in explicit terms, the policy dilemma that Charity-X faces. It also enables Charity-X to discuss its unmet needs with its funders and to demonstrate explicitly what is the basis for the figures. In this case it is quite clear that the level of the unmet needs, in comparison to the available resources, is too high, and it is unrealistic to assume that Charity-X will be able to raise these funds. Thus, for the rest of the discussion I will assume that no additional resources can be allocated to the program. This leaves Charity-X with only one policy option – to decrease the targeted income in order to meet its budgetary constraints. In order to do that we calculate a second iteration of the model which is presented in Table 5.
Table 5:
The calculation of the revised targeted income is done by applying a coefficient to the original targeted income. The coefficient value is set to equate the total budget to the amount of the
resources. Setting the coefficient value can be done by a trial and error method, however common spreadsheets can deal with such calculation easily (in Microsoft Excel – Tools / Goal Seek will do the trick).
As Table 5 shows, by constraining the budget to $37M, Charity-X has to decrease its targeted income to 50% of the level that seemed acceptable at the beginning of the budgetary process. Such presentation emphasizes the cost to the beneficiaries of the lacking resources and can be useful in the discussion with funders about additional funding.
Further insight on the consequences of the budgetary constraint can be obtained from figure 2. Final Budget Allocation
Tergeted Annual Income (International
Dollars)
Budget per Capita (International
Dollars)
Budget per Capita (US
Dollars)
Budget per Country (US
Dollars)
1 2 3 4
Country A 4,354 788 368 21,601,893
Country B 4,354 1,099 340 14,019,188
Country C 5,600 0 0 0
Country D 4,354 2,504 858 1,378,915
Total 37,000,000
Figure 2:
At first glance it is apparent that there is no budgetary allocation to country C. The reason is very clear: the revised targeted income is lower than the median income (both in international dollars) of clients in country C. Thus, the predominant implication of the budgetary constraint is the
discontinuation of the aid program in country C. Obviously this is a very serious policy decision that Charity-X has to take and there may be other considerations that will not allow a complete discontinuation of the program (in section 5 there is a further discussion on this topic).
In any event, this point demonstrates again how the allocation model exposes, in a very clear manner, what are the consequences of budgetary decisions.
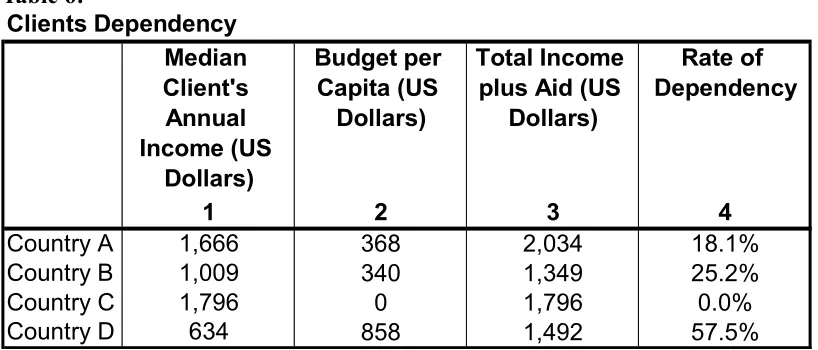
Another aspect of the budgetary allocation is the level of dependency of the clients in the program. The calculation is presented in Table 6.
Table 6:
Final Budget Allocation
0 1,000 2,000 3,000 4,000 5,000 6,000
Country A Country B Country C Country D
In
te
rn
a
ti
o
n
a
l
D
o
ll
a
rs
Client's Income Budget per Capita
Clients Dependency Median Client's Annual Income (US
Dollars)
Budget per Capita (US
Dollars)
Total Income plus Aid (US
Dollars)
Rate of Dependency
1 2 3 4
Country A 1,666 368 2,034 18.1%
Country B 1,009 340 1,349 25.2%
Country C 1,796 0 1,796 0.0%
[image:9.595.56.465.557.732.2]The BPC in US dollars reflects the average value of the goods and services that Charity-X provides to a typical client in each country. We can relate to it as an additional monetary income that the client receives. Thus, the sum of the median client income and the BPC is the total income of the client (column 3). The ratio of the BPC to the total income (column 4) is the rate of dependency of the client in the program. This figure varies substantially between the countries from 18.1% in country A to 57.5% in country D (obviously in country C the rate is 0% since the program does not operate there).
The rate of dependency is important for long term planning, especially if the projection is that budgets will diminish in the future.
5) Extensions to the Model
The basic model that was illustrated in section 4 contains some simplified assumptions. In this section I will relax some of these assumptions and will demonstrate the ability of the model to deal with more realistic scenarios.
5-a) Constraints on the budgetary allocation
In the budgetary allocation that is presented in Table 5, clients in country C did not receive any budget. In this scenario there is an implicit assumption that closing a program in a certain country does not pose any problem to Charity-X. However this may not be the case due to several reasons. It is possible that Charity-X cannot close a program in a country due to constraints imposed by its funders. It is also possible that Charity-X does not want to close the program entirely since it fears that economic conditions may deteriorate and it wants to keep at least a basic infrastructure of the program. In order to demonstrate the effect pf these considerations on the model I have assumed that the budget for the program in country C was determined exogenously to be $1.5M.
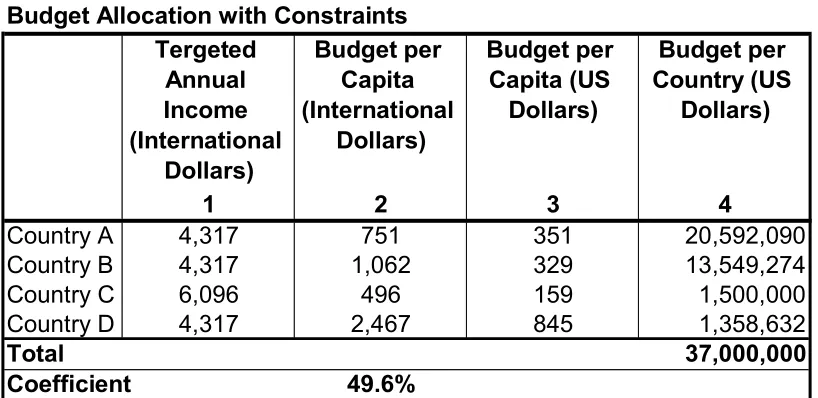
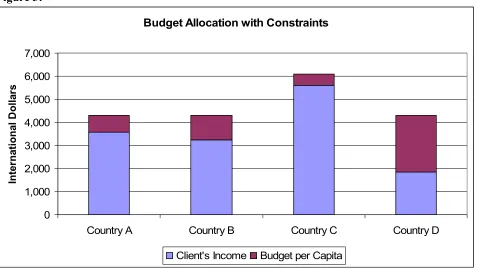
[image:10.595.56.465.443.642.2]The new budget allocation, with the constraint is presented in Table 7 and figure 3 (in the next page).
Table 7:
Budget Allocation with Constraints Tergeted
Annual Income (International
Dollars)
Budget per Capita (International
Dollars)
Budget per Capita (US
Dollars)
Budget per Country (US
Dollars)
1 2 3 4
Country A 4,317 751 351 20,592,090
Country B 4,317 1,062 329 13,549,274
Country C 6,096 496 159 1,500,000
Country D 4,317 2,467 845 1,358,632
Total 37,000,000
Figure 3:
It is apparent from the figures in Table 7 that keeping the program in country C had very little effect on the standard of living of the clients in the other countries. The reduction in their targeted income was very minor (the coefficient on the original targeted income decreased from 50% to 49.6% which reflects a reduction in targeted income of less that 1%). Thus, it seems plausible for Charity-X to keep the program in country C in spite of the lack of equality. The benefit from keeping the program at a low level seems to exceed the cost incurred by the other regions.
This example shows once again how the allocation model brings forward policy options and enables Charity-X to take informed decisions based on facts and figures.
5-b) Broader definition of income
The model may be criticized for using over simplified assumption about income and standard of living. Monetary income may not be the only source of income of the clients. Public benefits like free medical insurance and subsidized home care can be substantial contributions to their standard of living.
In order to address this issue, Charity-X's staff has reviewed the public benefits that were available in the four countries. The conclusion was that the only factor that have a significant effect on the elderly is free medical insurance. A typical situation in many poor countries is that the free medical insurance exists only “on paper”. People are entitled to free medical services, but once they have to go to a clinic or to a hospital they find out that many basic things are missing and they have to pay for them. Determining the value, for the individual, of free medical services is not straightforward. A fair estimate can be the government expenditure on health, on a per capita basis. This figure, which is obtained by combining data from the World Health Organization and the Human
Development Report (published by the UNDP), corresponds to the consolidated outlays of all levels of government: territorial authorities, social security institutions and extrabudgetary funds,
including capital outlays. It is also presented in international dollars, and thus is comparable to the income data that we already have.
(There is a slight inconsistency in the figures since the data on government expenditure per capita are available only for 2004 while our data are for early 2007).
Budget Allocation with Constraints
0 1,000 2,000 3,000 4,000 5,000 6,000 7,000
Country A Country B Country C Country D
In
te
rn
a
ti
o
n
a
l
D
o
ll
a
rs
The data on the per capita government expenditure on health were added to the clients income and the budget allocation was recalculated based on the revised figures. The results are presented in Table 8.
Table 8:
Contrary to the initial assumption, the value of free medical services (column 2) is a minor
component in the clients income (column 2). It is less the 10% in all the countries, while in country D it is even less than 5%. This fact coincides with the anecdotal evidence that free medical services are mainly “on paper” in these countries.
The implication to the budgetary allocation of adding another income component is straightforward: the budget is reallocated based on the new income (I kept the assumption that the budget of country C is determined exogenously).
[image:12.595.59.539.435.699.2]The results can be seen in Table 8 and in figure 4 that are comparable to Table 7 and figure 3. Figure 4:
In general, the inclusion of the value of free medical services has increased the targeted income by 7% (the coefficient has increased from 49.6% to 53.3%). The effect on the allocation of the budget
Budget Allocation with a Broader Definition of Income Median Client's Annual Income (International Dollars) Government Health Expenditure per Capita (International Dollars) Annual Income plus Medical Benefits (International Dollars) Tergeted Annual Income (International Dollars) Budget per Capita (International Dollars) Budget per Capita (US Dollars) Budget per Country (US Dollars)
1 2 3 4 5 6 7
Country A 3,566 361 3,928 4,632 705 329 19,318,176 Country B 3,255 225 3,481 4,632 1,151 357 14,691,881 Country C 5,600 324 5,924 6,420 496 159 1,500,000 Country D 1,850 77 1,927 4,632 2,705 927 1,489,943
Total 37,000,000
Coefficient 53.2%
Budget Allocation with a Broader Definition of Income
0 1,000 2,000 3,000 4,000 5,000 6,000 7,000
Country A Country B Country C Country D
In ter n a ti o n a l D o ll ar s
is straightforward: the budget of country A, with the highest per capita expenditure on health, was decreased, while the budgets of countries B and D has increased respectively.
5-c) Broader definition of Needs
Another type of criticism on the model is the claim that income does not fully capture the basic needs of the elderly. The level of functionality is a major factor that affects the clients lives. The exclusion of the level of functionality from the model may distort the budgetary allocation by not taking into consideration differences between the regions.
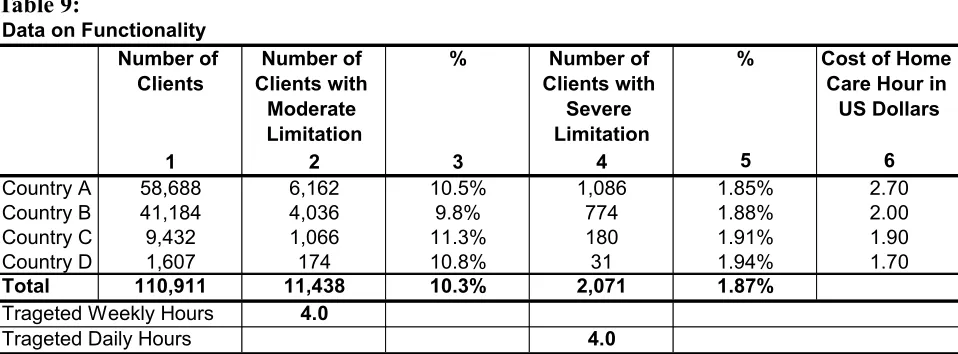
[image:13.595.58.537.255.432.2]To address this issue, Charity-X has compiled data on the level of functionality of its clients, which is presented in Table 9. For simplicity sake the level of functionality is divided to two categories: moderate limitation on functionality (columns 2 & 3) and severe limitation on functionality (columns 4 & 5). In reality there are more functionality categories, but the principles of the model remain the same, regardless of the number of such categories.
Table 9:
The level of functionality determines the treatment program, which can be defined simply as the number of targeted home care hours that a client should receive. Based on the treatment program and the cost of a home care hour, the budget for the home care program is determined.
The cost of the home care hour is an exogenous variable which depends on the labor market in each country. It can be easily determined, since the payment to home care workers is based on hourly rates which are observable in the market. These rates, plus an overhead allowance that reflects the indirect cost of the program, are presented in column 6.
The decision variable that determines the allocation of budgets to the home care program is the targeted number of home care hours that Charity-X wants its clients to receive, depending on their level of functionality.
Charity-X 's staff has decided that an acceptable norm will be: 4 weekly hours to clients with moderate limitation and 4 daily hours to clients with severe limitation.
The budgetary allocation, based on functionality and material conditions is presented in Table 10 in the next page.
Data on Functionality Number of
Clients
Number of Clients with
Moderate Limitation
% Number of Clients with
Severe Limitation
% Cost of Home Care Hour in
US Dollars
1 2 3 4 5 6
Country A 58,688 6,162 10.5% 1,086 1.85% 2.70
Country B 41,184 4,036 9.8% 774 1.88% 2.00
Country C 9,432 1,066 11.3% 180 1.91% 1.90
Country D 1,607 174 10.8% 31 1.94% 1.70
Total 110,911 11,438 10.3% 2,071 1.87% Trageted Weekly Hours 4.0
Table 10:
Columns 1 and 2 present the calculation of the home care budget which a simple multiplication of the number of hours by the cost per hour. The budgetary implication of the inclusion of the
functionality criteria is $12.7M (34% of the total program's budget) that are allocated to the home care program. The remaining $24.3M are allocated to the material aid program using the same methodology that was described before. Since the home care program budget is not affected by the level of income, the previous dilemma regarding the allocation to country C does not exist anymore. The infrastructure for the welfare centers in country C is maintained anyway in order to support the home care program. Thus, the restriction to keep a minimal budget for material aid in country C was removed. Consequently, the material aid part of Table 10 should be compared to results in Table 5.
Two points that emanate from the extended model deserve special attention:
The first point relates to the reduction in the targeted income due to the allocation of 34% of the budget to the home care program. We would expect that the $12.7M that were taken from the material aid budget will cause a significant reduction in the targeted level of income; however comparison of Table 10 to Table 5 shows only a modest reduction of 7% (the coefficient decreased from 50% to 46.5%).
How is it possible? The answer is actually built-in in the way the model works. The majority of the clients are living in country A (see Table 1 column 1); however, these clients have the lowest dependency rate on Charity-X's material aid program (not considering country C, in which the material aid program does not operate) since their income is relatively high (see Table 6 column 4). Thus, a significant reduction in the BPC of country A will have minor effect on the clients targeted income, but a significant effect on the total budget. That is exactly the logic of the model and we can see it if we compare the BPC in Table 10 (columns 4 & 5) to the BPC in Table 5 (columns 2 & 3). While the BPC of country A was reduced by 40%, the BPC of country D (which is the poorest) was reduced merely by 12.5%.
The second point relates to the additional dimension that is added to the model by the inclusion of the functionality criteria. While the initial model calculated only the allocation of budgets between countries, the extended model calculates also the allocation of budgets between home care and material aid. This is not a trivial allocation since the share of the home care budget, out of the total budget, varies significantly between the countries (see Figure 5 in the next page).
Budget Allocation with a Broader Definition of Needs Targeted
Home Care Hours
Budget per Country for Home Care (US Dollars)
Tergeted Annual Income (International
Dollars)
Budget per Capita (International
Dollars)
Budget per Capita (US
Dollars)
Budget per Country for Material Aid (US Dollars)
Total Budget
per Country
(US Dollars)
1 2 3 4 5 6 7
Country A 2,866,909 7,740,654 4,041 475 222 13,025,184 20,765,838 Country B 1,969,913 3,939,826 4,041 786 243 10,027,999 13,967,825 Country C 484,710 920,950 4,041 0 0 0 920,950 Country D 81,616 138,748 4,041 2,191 751 1,206,640 1,345,387
Total 5,403,149 12,740,178 24,259,822 37,000,000
Programmatic Allocation 34.4% 65.6%
Figure 5:
Thus, the extended model addresses simultaneously the two dimensions of the budgetary allocation: the geographical and the programmatic. In this respect the model can help the staff of Charity-X to make complicated policy decisions. An example of such policy choice is presented hereinafter. 5-d) Trade off between programs
Since the decrease in the targeted income, after the inclusion of the functionality criteria, is quite moderate, Charity-X decides to check the impact of an increase in the number of home care hours for clients with severe functionality limitation. The allocation model is used to check the
consequences of increasing their targeted number of hours from 4 to 6 daily hours. The results are presented in Table 11.
Table 11:
Trade off between Programs
Although the suggested change looks very moderate, its results are pretty significant. The overall impact on the targeted income is a reduction of 9% (the coefficient decreases from 50% to 45.4%) which does not seem very high. However, the home care budget increases from $12.7M to $16.3M and becomes 44% of the program. Such shift in programmatic priorities have an impact of the way the welfare centers operate. Moreover, the shift in the program is not uniform across regions as we
Homecare budget as % of total budget
0% 20% 40% 60% 80% 100% 120%
Country A Country B Country C Country D
Targeted Home Care
Hours
Budget per Country for Home Care (US Dollars)
Tergeted Annual Income (International
Dollars)
Budget per Capita (International
Dollars)
Budget per Capita (US
Dollars)
Budget per Country for Material Aid (US Dollars)
Total Budget
per Country
(US Dollars)
1 2 3 4 5 6 7
Country A 3,659,490 9,880,624 3,954 388 181 10,629,294 20,509,918 Country B 2,535,122 5,070,245 3,954 699 216 8,913,067 13,983,311 Country C 616,221 1,170,820 3,954 0 0 0 1,170,820 Country D 104,375 177,437 3,954 2,103 721 1,158,515 1,335,952
Total 6,915,208 16,299,125 20,700,875 37,000,000
Programmatic Allocation 44.1% 55.9%
[image:15.595.57.540.481.666.2]can see in Figure 6. Figure 6:
In the previous scenario, with the exception of country C, the material aid was the largest program in all the countries. In the new scenario, the home care budget becomes 50% in country A, which has the largest number of clients. Such change in programmatic priorities has to be accompanied by additional changes in indirect costs of training, monitoring and supervision.
The emphasis here, however, is not on the actual decision, but rather on the ability of the allocation model to bring to the surface these policy dilemmas in a quantifiable manner.
6) Conclusions
The allocation of budgets is probably the most important decision that an NGO must take. It's a test to whether “its money is where its mouth is”. Mission statements and the strategies are usually phrased in general, and sometimes vague, terms. Budgets, on the other hand, are exact and unique. The transit from the former to the latter is not straightforward.
The systematic approach to budgetary allocation that is illustrated herein provides the tools to translate mission and strategy to budgets. It enables the NGO's staff to focus on policy choices instead of internal politics.
Prior to the introduction of the budgetary model in Charity-X, budgetary allocation was a result of internal negotiation between field staff and headquarters. There were no clear criteria for budgetary allocation and inertia counted more than anything else. Regional directors spent substantial amount of their time lobbying for a larger chunk of the budget, instead of focusing on the programs under their responsibility. There was also a tendency to design programs that will be attractive to donors in order to increase the regional budget. Moving to a systematic approach to budgeting directed field staff to focus on the quality of the programs and made the entire organization less donors-driven and more needs-donors-driven.
Perhaps the most important point that I tried to demonstrate in this article is, that quantitative models do not diminish staff's influence on policy decision. People with no mathematical background (as the typical NGO's staff member is) tend to be suspicious of quantitative models since they feel that such models are “soulless”. My aim, in this article, is to demonstrate that this is exactly the apposite. A systematic approach to budgetary allocation distinguishes between objective facts and figures and policy dilemmas. By doing that it enables NGO's staff to focus on the real
Homecare budget as % of total budget
0% 20% 40% 60% 80% 100% 120%
policy issues. Such approach also makes the entire planning and budgetary process of the NGO more objective, impartial and transparent and thus improves its overall performance.
7) References
Cauthen, N. K. & Fass, S. (2008). Measuring Poverty in the United States. National Center for Children in Poverty (NCCP), Columbia University.
Ebrahim, A. (2003). Accountability in practice: mechanisms for NGOs. World Development, Vol. 31, No. 5, pp. 813-829.
Economist. (2008). The big apple gets poorer. July 19th.
Economist. (2008). The Big Mac index: sandwiched. July 24th.
http://www.economist.com/finance/displaystory.cfm?story_id=11793125
Koechlin, F. & Schreyer, P. (2002). Purchasing power parities – measurement and uses. Statistics brief, OECD, No 3, March.
Lee, J. (2004). NGO accountability: rights and responsibilities. Report for the program on NGOs and civil society, Center for Applied Studies in International Negotiation (CASIN).
UNDP. Human Development Reports.
http://hdrstats.undp.org/indicators/indicators_table.cfm
World Bank. (2008). 2005 International Comparison Program, Tables of final results.
http://web.worldbank.org/WBSITE/EXTERNAL/DATASTATISTICS/ICPEXT/0,,menuPK:197375 7~pagePK:62002243~piPK:62002387~theSitePK:270065,00.html
World Health Organization, Statistical Information System (WHOSIS). http://www.who.int/whosis/en/index.html