Munich Personal RePEc Archive
Price discrimination as a policy tool for
Nature Reserve Management.
Becker, Nir
Tel Hai Academic College, Natural resources and environmental
research center, University of Haifa
15 November 2007
Online at
https://mpra.ub.uni-muenchen.de/21867/
A comparative analysis of nature reserves pricing systems
1Nir Becker
Head, department of Economics and Management
Tel-Hai College
Upper Galilee, 12210
And Natural Resources and Environmental Research Centre
(NRERC)
Haifa University, Haifa, 31905
Israel
1
Abstract
The issue of pricing nature reserves becomes more relevant as budgetary constraints become a limiting factor for their proper operation. This paper considers and compares different pricing alternatives for managing Nature Reserves (NRs) and applies them to two nature reserves in Israel. We compare 4 pricing strategies: Free entrance, maximum revenue pricing, cost recovery pricing and differential pricing. These strategies were implemented to both the existing situation and to a development scenario in which an upgrade in the Nature reserve is considered. The analysis was implemented on two nature reserves in Israel: Darga Nature Reserve (DNR), an open reserve where no entrance fee is charged, and Gamla Nature Reserve (GNR), a closed reserve, where an entrance fee is charged. Benefits were derived using the Travel Cost Method (TCM).
Results show that differential pricing is the most cost effective policy. It recovers costs in both policy scenarios with the least dead weight loss (DWL). The consequence of the differential pricing however, is that there is a cross subsidy of the Gamla NR in 45 – 80 percent depending on the scenario analyzed. It was shown that there are conditions in which only a cross subsidy can make a development plan sustainable.
Usually, policy makers differentiate pricing according to the characteristics of the visitors. That is, different prices are determined for domestic and international visitors, the elderly and the young, etc. Differential pricing among different reserves provides another tool for policy makers that can be consistent with cost recovery while minimizing DWL. Another potential advantage is that site differentiating causes less social tension due to the pricing being tailored not to a person, but rather to a site.
1. Introduction
Protected natural areas (or nature reserves) were, and still are, the cornerstone of nature conservation efforts. They were established in order to manage resources in a proper way according to what we define as the in situ value (Krutilla, 1967) of the resources. The major goals of nature reserves were originally to benefit society through (controlled) visitations (use value) and to bring indirect benefits to society (non use values). Revenue generation was not a consideration. In fact, the idea was to provide access as freely as possible for both economic reasons (Public goods) and philosophical ones ("Nature belongs to everyone").
In recent years, the role of nature reserves was re-evaluated. Economic realities forced decision makers to take into account the opportunity costs of nature preservation. The increasing demand for land, the alternative commercial uses and, in general, the ever increasing limiting factors of general budgetary constraints, forced decision makers to look for a financial economic rationale to preserve nature while still trying to allocate the necessary resources.
(non-use value), costs are acute and borne directly by the government, which represents the taxpayers. The correlation between tax payment and nature is not direct at all.
Nature tourism or Eco - tourism as it is now popularly called is one source of benefit which can be easily translated from an economic to a financial one. While there may be strong arguments for free access to Nature reserves, there is no argument whatsoever that in a society that faces budgetary restrictions, this issue should not be analyzed based on different alternatives.
Usually, visitors contribute to revenue by paying entrance fees. However, there are other ways to collect money such as paying for attractions while the visitors are inside the reserve, paying a special fee for accommodations, food and fuel. Each method has benefits and detriments. In this paper we will deal only with the issue of entrance fees. This issue by itself has sparked a great deal of argument regarding the question of whether we should or shouldn't price NRs. This paper will deal mainly with the question of how to price nature reserves, but it should be remembered that the answer to this question (how?) is derived from the question: should we? The answer to the latter is determined in the political arena and thus, at least in this paper, is considered to be an exogenous issue.
cases in which one wishes to collect more payments than the actual cost. For a given NR, it does not make sense, but it does make sense for a system of reserves. The argument for that is that if we want to use a differential pricing system, there are some reserves which should subsidize others. The direction is, therefore, towards maximum revenue generation but not in all reserves and not exactly at the maximum revenue price, but somewhere between that price and the cost of price recovery.
There are several ways to differentiate with respect to admission price: Differentiation by volume, by individuals and by sites. Volume differentiation can be achieved through membership which can grant you a reduced price (or even fee admission) to enter NRs. Differentiation by individuals can be made through different prices to domestic vs. international visitors, students, the elderly etc.. Differentiation by site means that a given individual pays a different price at different sites. Policy makers should not ignore any one of these possibilities when planning for a (second best) efficient pricing system.
In this paper we deal only with the third type of price differentiation, namely, differential pricing by sites. We leave the other options for further research although there are other studies which have dealt with this issue (e.g., Tobias and Mendelssohn, 1993 among others) but did not derive the optimal price gap between different groups.
as given. The second policy is an upgrade in the services provided in the DNR. We chose to perform the development analysis on this reserve because, as opposed to the GNR, the DNR is an open reserve which does not require an entrance fee. Such reserves are the most vulnerable since they have to rely on outside sources rather than reserves which generate their own revenue.
In order to perform the analysis, a valuation study (TCM) was carried out in both reserves to estimate their value (existing and in the case of DNR also future value) and especially their demand function. Those functions enable us to compare visitations, benefits and prices under different scenarios.
The paper continues as follows: In the next section we explore some issues and provide a brief literature review regarding pricing of NRs. Section 3 describes the NRs and especially DNR in which future development is an issue to be considered. Section 4 outlines the theoretical model that will be used for the comparative analysis - the four different pricing strategies. Section 5 describes the results for the existing situation in both reserves, while section 6 repeats section 5 with a development option at the DNR. Section 7 concludes the paper.
2. Issues and Literature review in pricing natural reserves:
The issue of pricing public parks and nature reserves is common to many countries be they developed (e.g., Knapman and Stoeckl 1995) or developing (e.g., Chase et al., 1998).
government funding and must charge entrance fees in order to manage the site properly.
There are economic and other social arguments both in favor of pricing parks and against it.
Arguments in favor of pricing parks:
1) "Pay as you use": Managing and operating the park should be financed by those who enjoy it and not with the tax payer's money, especially if the site has a demand and those that "purchase" the commodity are willing to pay for it.
2) Limited governmental budget: the government does not allocate enough money to manage the park; therefore it needs to be priced. Policy makers are aware of the fact that subsidizing parks can cause a loss in social welfare and since the budget is limited, it is better to invest in places where the social benefit will be higher.
3) Carrying capacity: too many visitors can be a burden on the ecological carrying capacity of the park or the reserve which has unique natural treasures. Too many visitors can be a burden on the social carrying capacity of the park as well, and create disturbance to other visitors. The demand for the congested park will drop, raising benefit for the remaining visitors (Sibley 2001).
4) Upgrading nature reserves: upgrading services to visitors requires funding, and therefore the cost to operate the park is higher.
Arguments against pricing parks:
1) Public goods: Nature belongs to everyone; therefore there is no reason to price it. If the park is open to all with government funding, there is no marginal cost for each additional visitor as in other public goods. Hence, entrance fees will cause DWL. 2) Nature is there: nature was not manufactured; therefore there is no cost for providing it and it is immoral to price it. Pricing nature will result in lower social welfare.
3) Equality in using Nature: pricing parks will create a situation where only those who can afford it will be able to partake in it. Since Nature belongs to all levels of society, it would be unjust to price it. In addition, the country has an interest that all its citizens enjoy Nature for educational purposes.
The theoretical basis for this controversy is that efficiency in pricing a public good such as a nature reserve requires equality between marginal cost and marginal benefit (Musgrave and Musgrave, 1984). However, since marginal cost is commonly less than the average cost (most of the time even approaches to zero) in such public goods, it creates a problem of cost recovery. Thus, an efficient pricing requires a subsidy to sustain operation and this, in turn, may penalize non-users.
with entrance fees is that the management costs are so high that they are not covered by entrance fees alone (Willis, 2003). This problem is empirically presented in our study since the entrance fee to DNR in different scenarios is about 2 New Israeli Shekels (NIS)2 per visitor (Probably a small amount deserves collecting).
It should be noted that in some countries, such as Canada, parks are run as a business, with very low governmental funding. While entrance fees are higher, the overall result is a more efficient management and better services (Van Sickle and Eagles, 1998). In some cases pricing can achieve other goals besides cost recovery. Cullen (1985) and Fractor (1982) have compared pricing with other means to ration entrance to nature reserves and found it to be more efficient compared to alternatives such as a
lottery or a “first come first serve” system.
Average pricing can be used to overcome the cost recovery problem. However, the amount of nature provision is less than the optimal which in turn creates a DWL. Ramsey (1927) demonstrated a second best pricing rule that achieves cost recovery at a minimum DWL. This requires setting the prices of any two goods in an inverse relation to their price elasticity. This may be applied to any two NRs as well as two services within a given reserve.
An alternative is to set a two – tier pricing system in which visitors pay an entrance fee equal to the marginal cost and in addition they are charged a lump sum fee to cover fixed costs (Rosenthal et. al., 1984).
Charging an entrance fee has been criticized also on the basis of its effect on equity (Adams, et. al., 1989; Walsh at al. 1989). The argument is that those who are affected the most are low earners. This can be tackled by differentiating among income classes or offering free access to NRs on low use days. This argument of peak – load pricing
2
can be used also to differentiate entrance fees in order to reduce congestion and ecological costs.
Studies concerning pricing nature sites have been done in countries such as Australia (Herath, 2004), China (Chen et. al., 2004) Italy (Willis, 20003), Portugal (Mendes, 2002) and Costa Rica (Chase at. al., 1988). Most of the studies found a potential to raise sufficient revenues if prices were set in a way that at least allowed for cost recovery. For example Herath (2004) found that the value of visiting 5 parks in Australia was significantly larger than the allocated budget: a value of 1.3 Billion Aus$. This was contrasted with an allocated budget of 48.7 Million Aus$ of which current revenues from entrance fees were only 4.1 Million Aus$. Chen et. al. (2004) found that an additional fee of $0.84 per visitor would be required in order to recover costs.
In the USA, the USDA (2001) provides an extensive reading list regarding entrance fees to parks and nature reserves. This list includes studies that attempt to compare the pros and cons of different pricing techniques used in different parks in the USA and their impact on visitation rates.
Price segmentation or differential pricing is one appealing option to manage nature reserves in a more flexible way. This is because there are more degrees of freedom as to the amount and distribution of fees.
Nature reserves may use differential pricing techniques as well. Basically, the main objective is to differentiate between users within a given site. For example Tobias and Mendelssohn (1993) and Navrud and Mongatana (1994) differentiated between local and international visitors in order to analyze different pricing techniques. However, the main focus in these two articles as well as others is the valuation segment and not the cost recovery problem. Willis (2003) found out that price differentiation between visitors raised the public benefit of the Royal Wood of Capodimonte in Naples, Italy. It was shown that free entrance to retired people and a 50% discount for students was a better alternative than having a unified price for all. Chase et al. (1998) used CVM in three parks in Costa-Rica and analyzed three pricing methods. It was found that cross-subsidy is possible among parks that offer similar activities. Differential pricing can shift visitors from one park to the other, mitigate congestion in one and create more job opportunities in others.
Nevertheless, in many cases there is not enough information to create a specific linkage between the value of the reserve and the price that should be charged at the entrance gate (Loomis 2000). The missing linkage lies within the valuation and pricing decisions which are the main contribution of the current manuscript.
3. Research sites
vulnerable. This is a very delicate ecosystem which can easily become unstable with any slight changes, especially anthropogenic ones such as illegal hunting, the cutting of plants for heating, dumping of garbage and crushing of the earth's crust with off-road-vehicles.
Gamla Nature Reserve is located in the center of the Golan Heights. The reserve contains the highest waterfall in Israel (51 meters high), archeological sites including the remnants of ancient Gamla, a field of dolmens and the largest but yet very vulnerable Griffon Vulture colony in the country, which is its main attraction.
The economic problem at DNR
Our starting point is the DNR since it is an open reserve and thus the most vulnerable. We have defined several economic problems at the reserve. The budget allocated to manage the reserve is not large enough. It is possible that the benefit from the reserve is higher than its operating costs, but this does not necessarily show economic efficiency since it is possible to take further measures that require more funding but at the same time raise the benefit of the reserve.
In order to know if this is in fact the situation, we need to measure a few parameters:
Operating costs in the current situation
Benefits in the current situation
Additional costs in order to manage the reserve in an optimal ecological manner
Additional benefit from the reserve as a result of upgrading its management
The benefit data was obtained with a combination of actual and hypothetical TCM. The end result was a current value and an upgraded one of the reserve. The next step was to conduct a cost-benefit analysis to examine if the upgrade was economically justified.
The question remains – how to finance the upgrading plan? The problem is that charging entrance fees is associated with a drop in visitors. An estimate of the connection between entrance fee and its effect on visitors needs to be evaluated.
4. Theoretical Background
4.1 Different pricing methods
Assume two nature reserves, X and Y, were the benefits from them is a function of the number of visitors at each site. We assume for the moment that the attributes are given but later we will relax that assumption.
The benefit function can be written in a general form as:
) ( ) 2 . 4 ( ) ( ) 1 . 4 ( Y Y X X V g TB V f TB
Were VX,Y stands for the number of visitors at sites X and Y. The cost function is given by:
B A V b V a
TC ( X) ( Y)
) 3 . 4 ( Were:
a, b stands for variable cost as a function of visitors
A, B stands for the fixed cost which is not a direct function of the number of visitors3.
3
The social problem is to maximize the net benefit function subject to the constraint that the revenues charged at both parks are just enough to cover the costs of operating them: ) ) ( ) ( ( ) ( ) ( ) ( ) ( ) 4 . 4
( f VX gVY a VX b VY AB PXVX PYVY aVX bVY AB
Were λ = the shadow price of the revenue generation constraint and PX and PY are the price charged for using the parks. These prices are also the marginal benefit of visits4,
f'(VX) and g'(VY). Note also that the number of visits is a function of price, that is:
VX(PX) and VY(PY).
Differentiating (4.4) with respect to PX, PY and λ and rearranging terms we get:
x y Y Y X x V b P V a P ) ( ' ) ( ' ) 5 . 4 (
The left hand side of (4.5) is the markup over the marginal cost in percentage terms while ηx,y is the demand elasticity for the parks. In the case of negligible marginal cost where a'(Vx,y) → 0, the left hand side of the equation is simply the ratio of the entrance prices. The intuition behind this first order condition is that the park with the more elastic demand will have a lower price than the other park. This is the Ramsey condition for pricing public goods under budget constraint (Ramsey, 1927). Since in most cases elasticilties changes along the demand curve, pricing policy is a policy tool which decision makers should be aware of.
Ramsey pricing is supposed to minimize deadweight loss (DWL) while meeting the budget constraint. However, policy makers might have other goals rather than minimizing DWL. In order to compare the trade-off among different goals we compare Ramsey pricing to:
4
Free access (the operating cost is paid by the government through lump-sum taxes). The first order condition is given by:
0 ) ( ' ) 6 . 4
( f VX,Y ,
That is the marginal benefit of each park is set to be equal to the marginal cost which is 0.
Cost recovery pricing policy. This can be implemented either by a two part pricing system or an average pricing in the case of a single price system. In this paper we used only an average price system, hence:
X X A V
P /
) 7 . 4
( For park X and
Y Y B V
P /
) 8 . 4
( For park Y.
Maximum profit (or revenue in the case of zero variable costs).
B A V b V a V P V P
Max. X X Y Y ( X) ( Y) )
9 . 4 (
Throughout the analysis we assume zero variable cost and hence marginal costs5. At least, In Israel, and we believe that this is not an exception, the costs associated with an additional visitor is negligible within a very wide range of visitors.
When marginal price is zero, the DWL is derived from the difference between the total benefit under free access and the given price strategy (maximum revenue, Ramsey pricing, or cost recovery). The total benefit is simply the area under the marginal benefit curve which is actually the demand curve.
4.2 Development of nature reserves
5
There are cases in which attributes of the nature reserve could be upgraded. In order to do that, more funds should be raised and the issue of who should carry this burden is of policy relevance6.
A necessary condition to justify a development plan is to construct a cost-benefit test. This is presented in fig. 4.1:
Figure 4.1 about here
Suppose price increased from P0 to P1 to finance the new investment. This creates a loss in the consumer surplus and thus in benefit to society. This is represented by the shaded area S1 in fig. 4.1. On the other hand, the investment in the NR increased its quality and hence, the marginal benefit curve shifted out to the right from MB0 to
MB1. Under the new quality, there is a change in consumer surplus, given by the shaded area, S2. A necessary condition for the project to be worthwhile is that S2 is greater than S1. Note that if we assume a given investment plan, we also assume no degrees of freedom in the price change. It should be determined in such a way that the total revenue under the new price is able to finance operation AND the cost of the new development plan7.
The analysis changes when we have two NRs. This situation is presented in figure 4.2:
Figure 4.2 about here
Here we test an upgrade in NR 2, financed by a price increase in NR 1. There is an increase in the benefit in NR 2 since the marginal benefit curve shifted to the right.
6
For example, investing in a park where the main purpose of the investment is to handle the non-use
value component doesn’t have to be financed by visitors. 7
However, it is paid by NR 1 visitors. This creates a DWL but also creates revenue. The revenue should be set in such a way as it can finance the development plan in NR 2. If the resulting DWL is lower than the one resulting in a self finance scenario, than a cross subsidy is efficient.
5. Valuation
TCM was conducted in order to estimate the values of the sites, reflected in the travel costs incurred by the visitors. According to the TCM hypothesis, the demand for visits decreases as travel costs rise. Therefore, visitation rates from distant areas will be less than those from closer ones.
In addition, we controlled for number of children, education and income levels by adding them as additional explaining variables.
270 questionnaires were distributed at GNR out of which 243 were completed. At DNR, 270 out of the 296 were completed.
Travel Cost analysis was adopted by using the above mentioned socio-economic variables as well as the cost of travel, the alternative cost of time and entrance fee to the site.
The alternative value of the travel time has been found to be a fraction of the wage of the respondents. We used 25% of the hourly wage as a proxy for a driving hour. The conventional practice is to use between 25 – 50 percent depending on the purpose of the trip (Cesario, 1978).
One way to account for the relationship between dependent and independent variables is to assume it is linear. In this case, we assumed a linear relationship between the visitation frequencies in 10 regions consecutively increasing in distance of 30 km each from the travel site. That is:
i i i
i
i pop TC SOC
V / )( )( ) (
) 1 . 5 (
Where:
Vi = Visits from region i.
Popi = Population in region i.
α and β and δ are parameters to be estimated
TCMi= Travel cost from region i.
SOCi = A vector of Socio demographic characteristics.
ε = is an error term.
However, since the number of visits is non-negative, Herath and Kennedy (2004) suggests using as an alternative the semi-logarithmic functional form:
i i
i SOC i
TC i
i pop e
V / ( )( ) )
2 . 5 (
Where all the variables were previously determined.
model should be corrected for self- selection bias. Therefore a count model based on a Poisson distribution is more suitable (Hellerstein 1992). The model can be written as:
! / ) ( ) ) / (( Pr ) 3 . 5 ( ( ) j e J F j pop V
ob i i P j
Where: i i
i SOC i
TC
e
( )( )
j denotes possible values for the visitation rate.
FP(.) = is the cumulative distribution function of the standard Poisson probability model
λ = Poisson parameter (non negative) to be estimated (Green, 2000).
The regression results of the travel frequency as a function of TCM and other socio-economic variables are given in table 5.1 for GNR and DNR respectively.
Table 5.1 and 5.2 about here
Although all the coefficients have the expected sign, none but the travel cost and the intercept were found to be significant. Therefore, only the travel cost coefficient and the intercept were used to simulate the different number of visits at different prices.
We then regressed visits on implied prices and integrated to find the area beneath the function result in the value of the site.
In what follows we present only the results concerning the linear function (Valuation results of other functional forms can be found in Becker et. al, 2006 and Becker and Choresh, 2007).. Adding the other two functional forms complicates the results but adds nothing new.
The two demand functions are given for GNR and DNR in (5.2) and (5.3) respectively:
(5.2) Pg = 354.49 – 0.0037Vg
(5.3) Pd = 30– 0.0005Vd
6. Pricing mechanisms under the existing situation
6.1. Independent management
As can be seen clearly, there is an order of magnitude in both absolute size of the demand as well as the elasticity of demand. This is presented in figure 6.1.
Figure 6.1 about here
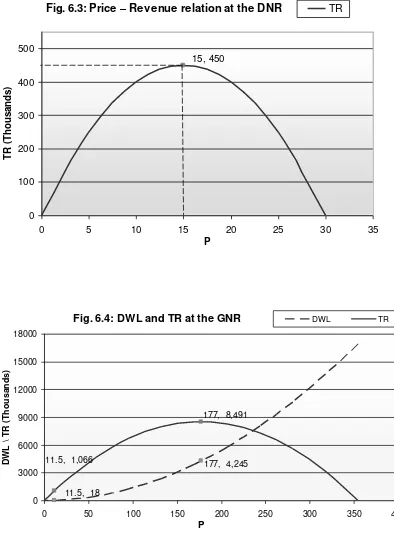
In order to estimate the effect of price change on revenue, we present the relation between price charged and revenue generated for GNR and DNR in figures 6.2 and 6.3 respectively.
Figure 6.2 and 6.3 about here
The on going operating cost at the GNR and the DNR are estimated at 1,066,050 NIS and 108,000 NIS respectively. We can use the estimated demand functions in order to calculate the price that will equate total revenue to total cost. This is the cost recovery pricing system. For the GNR, the cost recovery price is 11.5 NIS while for the DNR the cost recovery price is 1.92 NIS (in this paper we ignore the argument that entrance fees should not be implemented if administrative costs are too high).
Both policies which increase the price, cause a reduction of visitors associated with it and since the marginal cost is almost zero, there is an associated DWL with any positive price. That is a trade-off that should be considered; DWL increase against increased revenues. This is demonstrated in figures 6.4 and 6.5 for GNR and DNR respectively.
Figures 6.4 and 6.5 about here
The interesting point demonstrated in the last two graphs is that the trade-off between DWL and TR holds until the maximum revenue generating price. While TR has a hyperbolic shape, the DWL has a positive one. Hence, further increasing the price above the maximum revenue level, would cause both the DWL to increase and the TR to decrease. The relevant trade-off question is only to the left of the peak of the TR graph.
A comparative analysis of the three pricing mechanisms (zero, maximum revenue generation and cost recovery) is given in tables 6.1 and 6.2 for the GNR and DNR respectively.
As can bee clearly seen, the cost recovery pricing mechanism requires an admission price of 11.5 NIS at GNR while it requires only 1.92 NIS at the DNR. Maximum revenue generation can be achieved through a price increase to 177 and 15 NIS at GNR and DNR respectively. This is about 15 and 7 times more than the cost recovery price mechanism. For efficiency reasons, we would like to compare TRs to DWL and it is not surprising to see that the TB of the reserves goes down to 70% of what it would yield under free admission pricing.
If both reserves would be managed independently, a cost recovery pricing mechanism would suffice, since there is no argument which states that extra revenue should be diverted to other uses in the economy. However, the price differential argument proposes cross subsidization while keeping the total budget balanced. In our example, total revenue received from the two NRs should equal the total operating cost of both of them (1,174,050 NIS). However, revenue should not be constrained to each NR operating cost independently. This is the essence of price differentiation which we present next.
6.2 Price differentiation under current operating costs
Price differentiation should be operated in such a way as to maximize the net benefits of the two reserves. This is subject to revenue covering the operating costs. In the case of GNR and DNR it is given by:
(6.1) Max TB = TBg + TBd
s.t
(6.2) Pg * Vg + Pd * Vd = TC
This in our case can be written as:
Since variable cost is negligible, net benefit is equivalent to total benefit in this case. The total operating cost equals 1,174,050 NIS and it should be covered exactly by revenues generated at the two sites. Solving the model assigns prices in such a way that not only equation (6.3) is satisfied but also (6.1) is maximized; therefore, the DWL is minimized. As can be seen in figure 5.1, the demand function for GNR is less elastic; hence, the entrance fee should be higher than at the DNR.
Equation (6.4) is (6.1) written in an explicit form as a Lagrange function.
(6.4) L = 354.49Vg – 0.00185Vg² + 30Vd –0.00025Vd² + λ * ( 354.49Vg -
0.0037Vg² + 30Vd – 0.0005Vd² – 1174050 )
First order conditions with respect to the decision variables are given by equations (6.5), (6.6) and (6.7).
(6.5) L'(Vg) = 354.49 - 0.0037Vg + 354.49λ - 0.0074Vgλ = 0 (6.6) L'(Vd) = 30 - 0.0005Vd + 30λ - 0.001Vdλ = 0
(6.7) L'(λ) = 354.49Vg - 0.0037Vg² + 30Vd – 0.0005Vd² – 1174050 = 0
Equating (6.5) and (6.6) yields the expansion path equation which after some manipulation is described by (6.8):
(6.8) Vg = 1.597Vd
The last equation is the condition which should hold for every budget constraint with respect to the ration between the visitors at both NRs in order to minimize DWL. Substituting (6.8) in (6.1) yields a quadratic function from which only the positive root of Vd is of interest. The other variables are then easily discovered by trivial substitutions in the relevant equations. Before presenting the results and comparing them to the previous pricing mechanisms, we present the shadow price in equation (6.9):
0.0397
30 001
. 0
0005 . 0 30 )
9 . 6
(
Vd Vd
This is equal to about 4% which can be thought of as the shadow price of the system of NRs when comparing them to some other alternatives in the economy.
The comparative analysis is presented in table 6.3. Note that the only relevant policy to compare to is that of cost recovery.
Table 6.3 about here
Under joint management (which is actually carried out by price differentiation) we can see that there is a price increase in GNR to 12.05 (5%) and a decrease in the admission price to the DNR to 1.02 (47%). Due to that price change, there is a slight increase in the amount of visitors to the DNR (1808 visitors) while a slight decrease in the number of visitors to the GNR (148). Combining the net effect, we notice an increase of 1660 visitors at both NRs (about 1.1% compared to the independent management).
The results are promising because overall, the net benefit increases, the total number of visitors increases as well and most importantly, the price increase is small relative to the price decrease.
7. Results: Pricing under development plans
Visitors to the DNR who answered the Travel Cost survey, were provided with information about inappropriate management capabilities and were asked about their frequency of future visits if those conditions were to be improved (Becker and Choresh, 2007; Eagan and Herriges, 2006; Fleischer and Tsur, 2000). Based on the new visitation rate we re-estimated a new demand function which is above the previous one. This equation is given in 7.1.
(7.1) Pd = 37.83 – 0.0005Vd
Costs of upgrading the services provided in the reserves were estimated after a detailed consultation with the local ranger. The total cost is estimated at 639,000 NIS. Note that with respect to the previous cost (108,000 NIS) there is an increase of 531,000 NIS (592%). Our analysis was done with respect to full consideration of the possible upgrade opportunities. One can also analyze partial investment policies. The benefits were derived by the difference in the average net benefit per visitor times the number of visitors at the given investment level (current or upgraded). This was estimated at 4,324,388 NIS. It is 3.42 million NIS more than the previous benefit level (Benefit ratio of 4.8)8. The net benefit of the upgrade plan is, therefore, given by equation 7.2:
(7.2) NB = (4.32 – 0.90) – (0.64 – 0.11) = 2.89 million NIS.
This is clearly a Pareto improving plan. The question is, however, how we finance it under the price regimes analyzed previously, namely, independent versus joint management.
We compare only the cost recovery pricing mechanism, since this is the only interesting scenario to compare for an entire system of reserves (two in our case).
8
For independent management we equate equation (7.1) to 639,000 NIS. For a joint management scenario we substitute in equation (6.2) 639,000 NIS instead of 108,000 NIS and solve for maximum of equation (6.1) subject to (6.2) being satisfied. The results are presented in table 7.19.
Table 7.1 about here
When there is independent management and the development plan is on the table, there should be a sharp increase in the entrance fee at DNR up to 12.73 NIS. This is an increase of 10.81 NIS relative to the current situation. Despite the fact that due to a higher price, visitors can enjoy a higher quality reserve, such a dramatic increase in admission fee can spark antagonistic reactions. A joint management policy, on the other hand, puts most of the burden on GNR and thus creates a much lower price increase in both reserves. The increase is only 5 NIS in GNR and 1 NIS in the DNR. It is also interesting to note that there is a possibility of self- sustaining financing with the development plan. An independent management policy in the DNR has the ability to generate 639,000 NIS; the reason being that despite the dramatic increase in the admission price, the quality of the site attracts more visitors. Hence the number of visitors enables the NR to collect enough funds to operate, even independently, without cross subsidy. This is in contradiction to Laarman and Gregerson (1996) who claim that in general, development plans are not self sustaining.
7. Summary
9
The shadow price on the constraint is given by: λ =
83 . 37 001
. 0
0005 . 0 83 . 37
Vd
Vd
= 0.0574 .That is about
Managing NRs is a complex task because there are several objectives that are usually in conflict with one another. Revenue generation, congestion management and provision of the site as a public good are goals that must be addressed carefully. Due to the fact that these goals are somewhat mutually exclusive, optimal management must take into account the multifaceted nature of NR services. Unfortunately, there are not so many management practices that NR authorities can really employ. Available techniques can be thought of as either quantity or price management. Quantity management limits the quantity of visitors to a site through the use of queuing, or requiring reservations at specific entrance points or specific days. Pricing strategies are usually associated with entrance fees although there can be other ways to achieve them.
This paper deals with NR pricing strategies with an Israeli case study. Two NRs were analyzed: Gamla nature reserve which is a "closed reserve" where one has to pay admission at the entrance point and Darga river nature reserve which is an open reserve where entrance is free.
In the first part of the paper, we dealt with four pricing strategies: Free access, cost recovery, maximum revenue and price differentiation according to sites. A trade-off was traced between revenue and efficiency which can be of help to policy makers. It was found that a differential pricing system yields minimum DWL while still generating the required revenue to operate both sites. This, however, requires visitors in one site to pay for operational costs in the other.
such as the one presented in the paper, can also cause reserves to increase price less dramatically because the plan is financed by several reserves (In this case, only one financed the plan since we dealt with only two reserves).
In Israel, price differentiation is the norm and not the exception. Not only is it practiced by sites but also by individuals in relation to visit frequency. However, the price differences are not based on a model with specific targets and given constraints. Thus, in Israel, and in other locations as well, price differentials might be less equitable but should nonetheless be given proper consideration regarding implementation.
eferences
R
Adams, R.M., O. Bergland, W.N. Musser, S.L. Johnson and L.M. Musser (1989). "User Fees and Equity Issues in Public Hunting Expenditures: The Case of Ring-necked Pheasant in Oregon". Land Economics 65 (4): 376 – 385.
Becker, N., Y. Choresh, M. Inbar and O. Bahat. (2006). Combining TCM and CVM of endangered species: Estimation of the marginal value of vultures in the presence of species – visitors' interaction. In Kontoleon A., U. Pascual and T. Swanson (eds.), Biodiversity Economics: Principles, Methods and Applications. Pp: 313 – 342. Cambridge University Press
Becker, N. and Y. Coresh (2007). Darga River Nature Reserve Report. Internal report submitted to the Nature Protection Agency, Jerusalem, Israel.
Brent R.J. (1995). "Cost Benefit Analysis, User Prices and State Expenditures in India." Public Finance. Vol. 50: 327 – 341.
Cesario, F.J., (1978). "Value of Time in Recreational Benefit Studies." Land Economics. Vol. 52(1): 32 – 41.
Chase, L.C., D.R. Lee, W.D. Schultze and D.J. Anderson (1998). "Ecotourism Demand and Differential Pricing of National Park Access in Costa Rica."
Land Economics 74 (4): 466 – 482.
Cullen, R. (1985). "Rationing Recreation Use of Public Land". Journal of Environmental Management. Vol. 21: 213 – 224.
Dolan, R.J. (1995). "Do You Know When the Price is Right?" Harvard Businness Review. Sept. – Oct.: 174 – 183.
Eagan, K. and J. Herriges (2006). "Multivariate Count Data Regression Models with Individual Panel Data from an On-site Sample." Journal of Environmental Economics and Management. Vol. 52: 567 – 581.
Fleischer A. and Y. Tsur (2000). "Measuring the Recreational Value of Agricultural Landscape." European Review of Agricultural Economics. Vol. 27(3): 385 – 398.
Grant A.H. and L.A. Schlesinger (1995). "Realize your Customers' Full Profit Potential". Harvard Business Review. Sept. – Oct.: 59 – 72.
Green, W.H. (2000). Econometric Analysis. Ch. 20: Limited dependent variables and duration models. NJ, USA.
Hellerstein, D. (1992). "The Treatment of Non-Participants in Travel Cost Analysis and Other Demand Models." Water Resources Research. Vol. 28(8): 1999 – 2004.
Herath G. (2004). "Issues Surrounding Entrance fees as a Suitable Mechanism for
Financing Natural Areas in Australia." International Journal of Wilderness 6 (2): 35-38.
Herath, G. and J. Kennedy. (2004). "Estimating the Economic Value of Mount Buffalo National Park with the Travel Cost and Contingent Valuation Method." Tourism Economics. 10 (1): 63 - 78.
Kirkpatrick, C.H. (1979). "Distributional Objectives and the Optimum Level of Road User Charges in Developing Countries: Some Results from Kenya". Manchester School of Economics and Social Studies. Vol. 49: 139 – 159.
Krutilla, J. (1967). "Conservation reconsidered." American Economic Review 57(4): 777 – 786.
Laarman, J.G. and H. M. Gregersen (1996). "Pricing Policy in Nature Based Tourism." Tourism Management 17(4): 247 – 254.
Loomis, J.B. (2000). Economic Values of Wilderness Recreation and Passive Use: What we think we Know at the Beginning of the 21st Century. USDA Forest Service Proceedings RMRS – P – 15 – Vol. 2: 4 – 13.
McKean J.R., Johnson, D.M. and Walash, R.G. (1995). "Valuing Time in Travel-Cost Demand Analysis: An Empirical Investigation." Land Economics 71: 96-105. Mendes, I. (2002). "Pricing Recreation Use of National Parks for more Efficient
Nature Conservation: An Application to the Portuguese Case." European Environment. 13(5): 288 – 302.
Morisson, S.A., (1982). "The Structure of Landing Feesat Uncongested Airports".
Journal of Transport Economics and Policy. Vol. 16: 151 – 159.
Musgrave, R.A. and P. B. Musgrave (1984). Public finance in theory and practice. New York: McGraw – Hill.
Navrud, S. and E.D. Mongatana (1994). "Environmental Valuation in Developing Countries: The Recreational Value of Wildlife Viewing." Ecological Economics. Vol. 11 (2): 135 – 151.
Ramsey, F.P., (1927). "A contribution to the theory of taxation". Economic Journal
37: 47 – 61.
Sibly, H. (2001). "Pricing and Management of Recreational Activities Which Use Natural Resources." Environmental and Resource Economics 18 (3): 339 – 354.
Tobias, D. and R. Mendelshon. 1993. "Valuing Ecotourism in a tropical rain-forest reserve." Ambio, 20: 91 – 93.
USDA (2001). Recreation Fees in Wilderness and other Public Lands: An Anotated Reading List. USDA, Forest Service. General Technical Report RMRS – GTR
– 79 – Vol. 3.
Van Sickle K, Eagles P (1998). "Budgets, pricing policies and user fees in Canadian
parks’ tourism." Tourism Management 19 (3): 125-135.
Walpole M.J., H.J. Goodwin and K.G.R. Ward (2001). "Pricing Policy for Tourism in Protected Areas: Lessons from Komodo Park, Indonesia." Conservation Biology 15 (1): 218 – 227.
Walsh, R.G., G.L. Peterson and J.R. Mckean (1989). "Distribution and Efficiency Effects of Alternative Funding Methods". Journal of Leisure Research 21 (4): 327 – 347.
Ward, F.A. and D. Beal (2000). Valuing Nature with Travel Cost Models. Edward Elgar, Cheltenham.
Figure 4.1: Cost Benefit of NR development plan
Figure 4.2: Investment plan with several NRs
V P0
∆NB
= S
2- S
1MB1 MB0
MC1 MC0 P1
S2
S1
if
S
2 >S
1 →∆NB
>0P P0
P1
MC
V
MC
V
DWL = ∆NB1
NB2
∆
MB1
MB0
NR 2
NR 1
P P
If ∆NB2 > ∆NB1 → ∆NB>0
NB = ∆NB2–∆NB1
∆
[image:34.595.72.429.98.283.2]Fig. 6.1 Demand curves for GNR and DNR
0 50 100 150 200 250 300 350 400
0 10,000 20,000 30,000 40,000 50,000 60,000 70,000 80,000 90,000 100,000 Visits
P
[image:35.595.97.453.83.546.2]DNR GNR
Fig. 6.2: Price – Revenue relation at GNR
177, 8,491
0 2,000 4,000 6,000 8,000 10,000
0 50 100 150 200 250 300 350 400
P
T
R
(t
h
o
u
sa
n
d
)
TR
Fig. 6.3: Price – Revenue relation at the DNR
15, 450
0 100 200 300 400 500
0 5 10 15 20 25 30 35
P
TR
(
Th
ou
s
a
nd
s
)
[image:36.595.99.472.83.339.2]TR
Fig. 6.4: DWL and TR at the GNR
11.5, 18
177, 4,245 177, 8,491
11.5, 1,066
0 3000 6000 9000 12000 15000 18000
0 50 100 150 200 250 300 350 400
P
D
W
L
\
TR
(
Th
ou
s
a
nd
s
)
Fig. 6.5: DWL against TR at the DNR
2, 108
15, 450
15, 225
2, 4 0
100 200 300 400 500 600 700 800 900 1000
0 5 10 15 20 25 30 35
P
D
W
L\
TR
(
Th
ou
s
a
nd
s
)
Table 5.1: TCM regression results - GNR
GNR Parameter (variable) Linear Semi -
Log
Count model
Intercept 0.155* (2.115)
0.114* (2.28)
[image:38.595.123.472.372.623.2]0.141 (3.046)* Travel cost (Nis) -0.002*
(-4.63)
-0.001 (0.964)
-0.002* (-1.633) Income (5 Income
levels) 0.036 (1.09) 0.012 (0.06) 0.235 (0.816) No. of children 0.054
(1.083)
0.029 (0.542)
0.057 (1.082) Education (4 education
levels) 0.019 (1.42) 0.015 (0.126) 0.024 (0.28) N Adj. R-Sq. 243 0.44 243 0.42 243 0.41
Log pseudo likelihood -991
*Indicates significance at 95% level.
t-values are given in parenthesis (z-values for the count data model)
Table 5.2: TCM regression results - DNR
Site DNR
Parameter (variable) Linear Semi - Log
Count model
Intercept 3.881* (2.305)
2.85* (2.49)
3.53 (3.32)* Travel cost (Nis) -0.005*
(11.143)
-0.0026* (-2.32)
-0.005* (-3.93) Income (5 Income
levels) 0.026 (1.456) -0.09 (-0.08) 0.17 (1.09) No. of children 0.084
(1.181)
-0.045 (-0.61)
-0.088 (-1.17) Education (4 education
levels) 0.020 (1.244) -0.016 (0.11) 0.025 (0.14) N Adj. R-Sq. 270 0.49 270 0.47 270 0.44
Log pseudo likelihood -1063
* Indicates significance at 95% level.
Table 6.1: Summary for existing situation at GNR – Independent management (In NIS) P=354.49-0.0037Vg Pricing mechanism P Vg TR DWL TB TCM Profit Maximum revenue generation 177 47904 8490754 4245377 12736131 1066050 7424704 Cost recovery 11.5 92700 1066050 17872 16963637 1066050 0 Free admission 0 95808 0 0 16981508 1066050 -1066050
[image:39.595.73.522.104.246.2]Table 6.3: Joint management under current operating costs (All monetary values are in NIS)
Price Visitors Revenue DWL Benefit Costs GNR
separate
11.5 92,700 1,066,050 17,872 16,963,637 1,066,050 DNR
separate
1.92 56,153 108,000 3,700 896,300 108,000 GNR
combined
12.05 92552 1,174,050 20,601 17,860,857 1,266,074 DNR
combined
1.02 57,961 63,574
Table 7.1: Independent pricing versus joint management under a possible development plan
Price Visitors Revenue Benefit Costs GNR
separate
11.5 92,700 1,066,050 16,963,637 1,066,050 DNR
separate
12.73 50,198 639,000 1,268,957 639,000 GNR
combined
17.25 91,145 1,572,251 18,368,893 1,705,050 DNR
combined
[image:40.595.114.483.368.499.2]