http://dx.doi.org/10.4236/ojpm.2014.44028
How to cite this paper: Ngallaba, S.E., et al. (2014) A Retrospective Study on the Unseen Epidemic of Road Traffic Injuries and Deaths Due to Accidents in Mwanza City—Tanzania. Open Journal of Preventive Medicine, 4, 222-228.
http://dx.doi.org/10.4236/ojpm.2014.44028
A Retrospective Study on the Unseen
Epidemic of Road Traffic Injuries and
Deaths Due to Accidents in Mwanza
City—Tanzania
Sospatro E. Ngallaba1*,Daniel J. Makerere1, Anthony Kapesa1, Japhet Gilyoma2, Philipo Chalya2
1School of Public Health, Catholic University of Health and Allied Sciences, Mwanza, Tanzania 2Department of Surgery, Bugando Medical Centre, Mwanza, Tanzania
Email: *sngallaba@gmail.com
Received 30 December 2013; revised 16 March 2014; accepted 3 April 2014
Copyright © 2014 by authors and Scientific Research Publishing Inc.
This work is licensed under the Creative Commons Attribution International License (CC BY).
http://creativecommons.org/licenses/by/4.0/
Abstract
Backgrounds: Sixty percent of the global deaths and injuries occur in the developing world and mostly are due to Road traffic accidents (RTAs). Looking at the etiological related factors which include carelessness of the driver, condition of the vehicle or motorcycle, poor condition of roads, risky behavior of the driver, most of these factors can be prevented to some extent. This study therefore, determined the pattern of cases and deaths due to traffic road accidents in Mwanza City Tanzania. Methods: In this retrospective study, records, registers and case notes in the surgical ward and causality, medical records and central police station from 2009 to 2012 were used. The study focused on the two referral hospitals (Sekouture regional hospital and Bugando Medical Center). Results: There were 3450 cases due to accidents reported at both centers (Sekouture re- gional hospital and Bugando Medical Center of which 3224 (93.4%) had complete information for analysis. 2225 (69%) were male and 999 (31%) were female, and the most affected group were male. Among the RTAs 2809 cases (87%) were due to motor cycle accidents which were the lead- ing cause of RTAs with case fatality rate of 5% while motor vehicle has case fatality rate of 24% which is 5 times that of motor cycle. Conclusion: Among all RTAs the leading cause of injuries is Motor cycle traffic accidents followed by motor vehicle. RTAs are on increase particularly the mo- tor cycle traffic accidents and have claimed a good number of innocent people’s lives however most of them are preventable, therefore driving course to be introduced to motor cycle drivers emphasizes on the road posters signal, rules and regular checkup of their motor cycles especially commercial motor cycle.
Keywords
Motor Cycle Accidents; RTAs Morbidity and Mortality Rate in Mwanza City
1. Introduction
Road traffic accidents (RTAs) are one of the major causes of injuries, deaths and disabilities in fact it has a great impact on the disability-adjusted life years (DALYS) as a result it is now a public health problem particularly in developing countries, 85% of the global deaths due to injuries occur in the developing world, consuming sub- stantial health sector resources [1]. In the USA injuries account for more potential years of life lost before 65 years of age than cancer and heart disease combined [2]. The situation is worse in Africa while in developed countries the trend of RTAs is declining. Tanzania is one among developing countries which is highly affected: hence the magnitude of RTAs suggests the unseen epidemic [3]. Previously accidents were regarded as inevita- ble events which results into injuries and deaths, but looking at the etiological related factors which include, carelessness of the driver, condition of the vehicle or motor bike, poor condition of roads, risky behavior of the driver, misuse of roads by pedestrians, driving under the effluence of alcohol or drugs abuse, most of these fac- tors can be prevented to some extent [4]. In Mwanza City the number of motor vehicle and motor cycle has in- creased tremendously while the roads condition and number are still the same.
In Tanzania, the few hospital based studies revealed injuries to be the second cause of deaths with the com- monest or leading cause being RTAs. Usually hospital based data is like a piece of floating ice berg, there are more injuries and deaths in the community than what we see at the reported health facilities [4]. Therefore the objective of this study was to determine the trend and cause of road traffic injuries later try to re-examine whether these are preventable or not.
Globally there are more than 1 million road accident fatalities and 10 million people are injured yearly, WHO reported that vehicle collision are the 6th most common cause of death in developed countries with an average of 20.8 per 100,000 population [1], Some of the countries with high number of road traffic accidents in the world are Egypt and Saudi Arabia, Thus Saudi Arabia is three times higher than that of Egypt. In general South East Asia has the highest proportion of global road fatalities [1] [5] [6].
Developing countries are now in rapid urbanization, with high growth rate in traffic leading to congestion of traffic which causes increase in RTAs [7]. Seventy percent (70%) of RTAs occur in developing countries, while there is a degree of decline of RTAs in developed countries. In Africa RTAs are on increase especially in large cities eg Nigeria, Kenya, Malawi, Ethiopia, Zambia, Uganda and Tanzania, In these countries including South Africa there is also a booming of motorcycle accidents which have raised the death rate, e.g. Kenya has a death rate of 9.2 per 100,000 , Uganda 8.1 deaths per 100,000 and Tanzania 5.1 per 100,000 [8]. In Africa the mor- tality rate is 28 per 100,000 populations while in Europe it is 11 per 100,000 people and when comparing death Vs number of vehicle, in Africa it is 50 per 100,000 while in developed countries it is 1.7 deaths per 100,000
[9].
In 1990 Africa had lost59,000 people in RTAs and this figure is expected to rise to 144,000 by the year 2020, if the situation is left to continue while in developed countries the trend has been declining since 1960s. Due to this alarming escalating situation WHO in April 2001 conveyed a meeting on a 5 years strategy for road traffic injury prevention, and in the year 2003, the United Nations Secretary described global public health challenge put forward by road traffic injuries and encouraged the number states to address the problems [10]. The number of vehicles per population Africa is still low in developing countries but still it has high RTAs [11]. It has been observed that with development the road traffic mortality will decline especially when both road conditions and health facilities to handle causalities will improve [5]. Since in Sub-Saharan Africa the stage of development is still far to be reached therefore there is a need to intervene the problem. Victims of RTAs are: Pedestrian, pas- sengers especially of public transport and drivers. There isa limited number of RTAs research done in develop- ing countries, though the number of RTAs a companied by high number of injuries cases and deaths are on in- crease.
[12] [13]. This can also be expressed in deaths per motor vehicle, thus Uganda has 121.9 deaths per 10,000, while Tanzania has 111.4 deaths per 10,000 and Kenya has 64.3 per 10,000 [14]. Tanzania death rate has signifi- cantly increased due to motor cycle accidents in Tanzania motor cycle account 8.2% of road accidents. However studies have not been done in Mwanza City on the epidemiology of deaths and injuries due to road traffic acci- dents.
Incriminated common causes of RTAs include: Overloading, Lack of road signs and posters, Poor road conditions, Poor vehicle conditions, Poor status of the driver which include: low age, alcohol influence, drug abuse influence [15]. Failure to adhere to law and regulations of using seat belt, hamlet and exceeding number of passengers
Corruption: Even undesirable vehicle which are out of order are left to carry passengers and this becomes owner’s risk e.g. a bus with worn out tires on addition to that excess number of passengers is a common problem especially to public transport, Currently some of the motor cycles are carrying more than one passenger known as Mishikaki, because of corruption they are left to continue with such risky malpractice [16] [17], however many accidents which has claimed a good number of peoples life have been observed practicing such malprac- tice and yet road traffic authority keeps quiet.
Emergency Care/Outcome: Most of RTAs deaths occur at health facilities hence mortality can be reduced by effective management of causalities at the health facilities, health facilities with well trained staff on trauma and emergency care, with adequate number of related supplies and equipment’s has always low mortality rate [6] [18]. Many health facilities particularly in Tanzania don’t have emergency units to take care of injuries and they lack expertise in that field [18].
2. Methods
Bugando Medical Centre is a referral and teaching hospital, it is one of the consultant hospitals in Tanzania lo- cated in the Lake zone where it serves a population of eleven thousand million people from six regions, around the lake zone, while Sekouture hospital is a regional hospital for Mwanza City which serves a population of three million people from eight districts
The setting of this study is limited to Mwanza City, thus the target study population is from Mwanza City. It includes all those in the report who had accidents from the year 2009 to 2012, The nature of the study was de- scriptive analysis of secondary data, data were obtained from causality registers, patient files and case notes in the surgical, medical, pediatric clinics all these information sources were collected from medical records where all records are kept after that all the files were reviewed. Extraction form was used for data collection. Then de- scriptive analysis was performed using SPSS program.
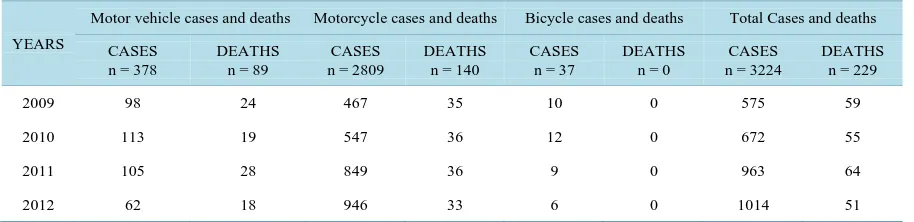
[image:3.595.87.544.525.636.2]3. Results
Table 1. Shows the trend of cases vs deaths due to RTAs from 2009 to 2012.
YEARS
Motor vehicle cases and deaths Motorcycle cases and deaths Bicycle cases and deaths Total Cases and deaths
CASES n = 378
DEATHS n = 89
CASES n = 2809
DEATHS n = 140
CASES n = 37
DEATHS n = 0
CASES n = 3224
DEATHS n = 229
2009 98 24 467 35 10 0 575 59
2010 113 19 547 36 12 0 672 55
2011 105 28 849 36 9 0 963 64
2012 62 18 946 33 6 0 1014 51
*
The data above are from January 2009 to December 2012 (48 months).
Table 2. Shows the distribution of the study population by sex.
Age group (Years) MALE (n = 2225) 69% FEMALE (n = 999) 31% TOTAL (n = 3224) 100%
0 - 4 129 4 97 3 226 7
5 - 14 322 10 193 6 516 16
15 - 39 1451 45 484 15 1935 60
40 - 59 258 8 193 6 451 14
60+ 64 2 32 1 96 3
[image:4.595.90.535.254.401.2]Among the study population 31% are female while 69% are male, and 60% of the study population was in the age group of 15 to 39 years of age (Table 2).
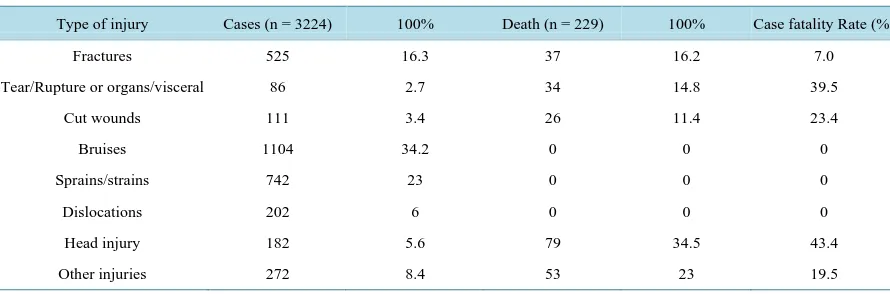
Table 3. Shows the case fatality rate per type of injury.
Type of injury Cases (n = 3224) 100% Death (n = 229) 100% Case fatality Rate (%)
Fractures 525 16.3 37 16.2 7.0
Tear/Rupture or organs/visceral 86 2.7 34 14.8 39.5
Cut wounds 111 3.4 26 11.4 23.4
Bruises 1104 34.2 0 0 0
Sprains/strains 742 23 0 0 0
Dislocations 202 6 0 0 0
Head injury 182 5.6 79 34.5 43.4
Other injuries 272 8.4 53 23 19.5
NB: Each injury was considered separate though some had more than one type of injury. *Case fatality rate = proportion of deaths from specific injury cases.
A good number of cases with head injury had high fatality rate of 43.4% followed by tear and rupture of or- gans which had fatality rate of 39.5%(Table 3).
Table 4. Shows the outcome of cases by year.
Years Cases N = 3224 Discharge N = 2995 Discharge with
disability N = 38 Death N = 229
Death rate per year due to TRAs 7%
2009 575 516 9 59 10
2010 672 617 5 55 8
2011 963 899 13 64 6.6
2012 1014 963 11 51 5
[image:4.595.90.540.642.721.2]NB: TheTable 4 shows that the rates of road injury patients have been increasing every year and approxi- mately 5 deaths per month, while the recovery rate is 92.8% and out of all who were discharged 2% were dis- charged with deformity.
Table 5. Shows the common list of the people involved in accidents vs deaths.
STATUS OF PEOPLE INJURIES N = 3224 % DEATHS N = 229
Passengers 1924 60 131 (57%)
Drivers 596 18 41 (18%)
Pedestrian 667 21 57 (25%)
TheTable 5 shows that out of 3224 injuries 60% were passengers, 21% pedestrian, 18% drivers and 1% were due to bicycle accidents, and among the deaths caused by RTAs 57% were passengers, 25% pedestrians, 18% drivers and no death occurred among cyclists.
Table 6. Shows the distribution of injuries and outcome of motor cycle accidents.
STATUS OF PEOPLE INJURIES N = 2809 % DEATHS N = 140 (CFR 5% )
Passengers 1795 64 79 (56%)
Drivers 568 20 61 (44%)
Pedestrian 446 16 0
The Table 6 shows that majority of the people involved in motorcycle accidents are Passengers (64%) fol-
lowed by motorcycle drivers 20%.
4. Discussion
Generally there are 18 cases of injuries due to RTAs per week and 3 cases per day reported at the health facility and majority of casualties 2809 (87%) were caused by motorcycle accidents while 378 (12%) were due to motor vehicle and 37 cases (1%) were due to bicycle accidents. Thus at least there is 1 case of motor vehicle injury for every 7 cases of motorcycle injuries this means that when you identify 1 case of motor vehicle in the ward, there is high chance of identifying 7 more cases of motorcycle accidents. This picture is consistent with some obser- vation from other East African countries [19] [20]. Men are highly affected than female in the ratio of 1:2, this could be due to mobility, thus men are more mobile than women and the victims of the accidents are drivers (20%), passengers (64%), and pedestrians (16%). Case fatality rate due to motorcycle compared to motor ve- hicle was almost the same ranging from 8.9% to 9.4%, fatality rate can be reduced by taking preventive meas- ures e.g. using helmets both drivers and passengers, because majority of the deaths are due to brain damage (34.5%), another factor is malpractice of carrying more than one passengers especially for commercial motor cycle, some carry to an extend of four passengers (called mishikaki a Swahili word for skewer-grilled marinated meat), this expose them to high risk of accident, the malpractice has been facilitated by the fact that the more passengers are carried by one motorcycle the lower the fare the passengers pay so because of financial constraint many people opt the cheaper transport. The age group highly affected is between 15 to 39 years (60%), this is the productive age group for both sex. therefore the impact of causalities to the nation is high because much of the national work is done by this age group.
There has been mushrooming of commercial motorcycle transport in Mwanza City which is comparatively cheaper than hiring a taxi, another advantage of motorcycle it can pass even in narrow path ways where a taxi can’t pass as a result many people opt to motorcycle transport. The victims of RTAs most affected are passen- gers 64% (n = 1795) followed by pedestrians 16% (n = 446), then drivers 20% (n = 568). The reason for more passengers to be affected could be due to failure to use helmets, and some time they are carried more than one at one motor cycle which is risky. Why booming of motor cycle transport? Because for the past few years there has been an increase of importation of cheap Chinese motorcycle as a result many people have started income gene- rating activities of purchasing many motorcycle and using them for transport business, and the young males are employed as drivers. Why high case fatality rate? This could be due to poor management of cases at the health facilities, since many of health facilities don’t have intensive care units and majority of the victims die of head injuries and multiple injuries at the health facilities, so this can be reduced by intensive training of health staff on proper management of injury cases also provision of adequate hospital related supplies and equipment’s.
5. Conclusions
RTAs is one of the major causes of injuries in Mwanza especially motorcycle accidents, since the time of legali- zation of motorcycle transport RTAs has increased tremendously, and it is now becoming a major cause of mor- bidity and mortality among RTAs therefore becoming a public health problem.
emergency handling and provision of basic equipment’s for emergency.
Police traffic should pay more attention to rules and regulations and serve appropriate penalties for noncom- pliance drivers, especially the motor cycle drivers, but pedestrians also deserve special educational campaign on road traffic regulations, the campaign should not be limited to be done by traffic police but also NGOs should be encouraged to participate.
It is also advisable to introduce class on road traffic rules to primary schools so that people can get the knowl- edge from the grass route level. City planners should think of establishing more roads, because the population of people, number of motor vehicle, and motor cycle in the city have increased but the roads are still the same.
Acknowledgements
This study was accomplished by joint cooperation from the researchers, leaders from the hospitals who gave permission to conduct the study in their hospitals also thanks to the regional traffic officer of Mwanza for giving us access to the traffic accident records.
Competing Interests
The authors declare that they have no conflict of interest or competing interest.
Authors’ Contribution
Ngallaba SE is the corresponding author who developed the idea and designed the study, Makerere D.J. and Ka- pesa A. analyzed the data while Gilyoma J. and Chalya P. collected the data from OPD and Inpatient from Se- kouture regional hospital and Bugando referral hospital, later all authors read and approved the final manuscript for publication.
References
[1] Nantulya, V.M. and Reich, M.R. (2002) The Neglected Epidemic: Road Traffic Injuries in Developing Countries. BMJ:
British Medical Journal, 324, 1139. http://dx.doi.org/10.1136/bmj.324.7346.1139
[2] MacKenzie, E.J. (1999) Epidemiology of Injuries: Current Trends and Future Challenges. Epidemiologic Reviews, 22, 112-119. http://dx.doi.org/10.1093/oxfordjournals.epirev.a018006
[3] Lagarde, E. (2007) Road Traffic Injury Is an Escalating Burden in Africa and Deserves Proportionate Research Efforts.
PLoS medicine, 4, 170. http://dx.doi.org/10.1371/journal.pmed.0040170
[4] Museru, L., Mcharo, C. and Leshabari, M. (2002) Road Traffic Accidents in Tanzania: A Ten Year Epidemiological Appraisal. East and Central African Journal of Surgery, 7, 23-26.
[5] Kopits, E. and Cropper, M. (2005) Traffic Fatalities and Economic Growth. Accident Analysis & Prevention, 37, 169- 178. http://dx.doi.org/10.1016/j.aap.2004.04.006
[6] Maunder, D. and Pearce, T. (1998) Bus Accidents in the Kingdom of Nepal: Attitudes and Causes. Indian journal of Transport Management, 22, 123-134.
[7] Odero, W., Garner, P. and Zwi, A. (1997) Road Traffic Injuries in Developing Countries: A Comprehensive Review of Epidemiological Studies. Tropical Medicine & International Health, 2, 445-460.
http://dx.doi.org/10.1111/j.1365-3156.1997.tb00167.x
[8] Odero, W., Khayesi, M. and Heda, P. (2003) Road Traffic Injuries in Kenya: Magnitude, Causes and Status of Inter- vention. Injury Control and Safety Promotion, 10, 53-61. http://dx.doi.org/10.1076/icsp.10.1.53.14103
[9] Gul, E. (2013) Economic Evaluation of Roads Traffic Safety Measures. http://mpra.ub.uni-muenchen.de/48350/
[10] Organization, W.H. (2002) A 5-Year WHO Strategy for Road Traffic Injury Prevention. WHO, Geneva.
[11] Khayesi, M. and Peden, M. (2005) Road Safety in Africa. BMJ: British Medical Journal, 331, 710-711.
http://dx.doi.org/10.1136/bmj.331.7519.710
[12] Jacobs, G., Aeron-Thomas, A., Astrop, A. and Britain, G. (2000) Estimating Global Road Fatalities. Transport Re- search Laboratory, Crowthorne.
[13] Nantulya, V.M., Sleet, D.A., Reich, M.R., Rosenberg, M., Peden, M., et al. (2003) Introduction: The Global Challenge of Road Traffic Injuries. Injury Control and Safety Promotion, 10, 3-7. http://dx.doi.org/10.1076/icsp.10.1.3.14109
http://dx.doi.org/10.1080/15660970500036713
[15] O’Neill, B. and Mohan, D. (2002) Reducing Motor Vehicle Crash Deaths and Injuries in Newly Motorising Countries.
BMJ: British Medical Journal, 324, 1142. http://dx.doi.org/10.1136/bmj.324.7346.1142
[16] Afukaar, F.K. (2003) Speed Control in Developing Countries: Issues, Challenges and Opportunities in Reducing Road Traffic Injuries. Injury Control and Safety Promotion, 10, 77-81. http://dx.doi.org/10.1076/icsp.10.1.77.14113
[17] Åstrøm, A.N., Moshiro, C., Hemed, Y., Heuch, I. and Kvåle, G. (2006) Perceived Susceptibility to and Perceived Causes of Road Traffic Injuries in an Urban And Rural Area of Tanzania. Accident Analysis & Prevention, 38, 54-62.
http://dx.doi.org/10.1016/j.aap.2005.06.022
[18] Chen, G. (2010) Road Traffic Safety in African Countries—Status, Trend, Contributing Factors, Countermeasures and Challenges. International Journal of Injury Control and Safety Promotion, 17, 247-255.
http://dx.doi.org/10.1080/17457300.2010.490920
[19] Khanbhai, M. and Lutomia, M. (2012) Motorcycle Accident Injuries Seen at Kakamega Provincial Hospital in Kenya.
East and Central African Journal of Surgery, 17, 43-46.