http://dx.doi.org/10.4236/am.2015.614195
How to cite this paper: Muchene, E.K. and Owuor, N.O. (2015) Analysis of KCSE Performance in Nakuru County: A Genera-lized Estimating Equations Approach. Applied Mathematics, 6, 2217-2225. http://dx.doi.org/10.4236/am.2015.614195
Analysis of KCSE Performance in Nakuru
County: A Generalized Estimating
Equations Approach
Elvis Karanja Muchene, Nelson Onyango Owuor
School of Mathematics, College of Biological and Physical Sciences, University of Nairobi, Nairobi, Kenya
Received 28 October 2015; accepted 18 December 2015; published 21 December 2015
Copyright © 2015 by authors and Scientific Research Publishing Inc.
This work is licensed under the Creative Commons Attribution International License (CC BY).
http://creativecommons.org/licenses/by/4.0/
Abstract
In Kenya, the Ministry of Education has set the pass mark for university entry examination as C plus and above. Using publicly available data for 2006-2010, differences in KCSE performance amongst the three types of schools in Kenya—boys only, girls only, and mixed schools—was as-sessed. A generalized estimating equations marginal model was applied in order to account for association between scores within a school in the five year period. To account for the missing data, multiple imputation was performed followed by estimation and inference. Results indicated that there was a significant difference between the three type of schools in their candidates’ odds of attaining the stipulated minimum university entry grade. However, the odds of success in KCSE did not depend on the year under review as was evident in the slope parameters which was not statis-tically significant. Although it was clear that same-gender schools perform better than mixed gender schools, there is need to weigh the social benefits of mixed-schools against respective per-formance in KCSE. This should guide the policy makers on the way forward with regards to the education policy in Nakuru County.
Keywords
Generalized Estimating Equations, Kenya Certificate of Secondary Education, Mixed Schools
1. Introduction
2218
Ministry of Education guidelines stipulate that the pass mark for KCSE is a mean grade of C plus (commonly denoted C+) and above, which corresponds to a minimum of six points on a twelve point grading scale, with the twelve points corresponding to the highest possible score (A Plain). A student who scores C+ or higher is deemed eligible for direct admittance to a university program [1].
Every year around February-March, a ceremony headed by the Minister for Education is held, where KCSE results from the preceding year are released. Until the year 2014, the release of KCSE results included ranking of the students performance individually, (best 100 candidates in each province and nationally by gender) as well as the ranking of schools based on the mean grade of the schools’ candidates. This ranking mostly stimu-lated fierce competition amongst schools in a bid to outperform each other in the subsequent examinations [2]. Some schools were consistent over the years in terms of their ranking while one-time-wonders were also a common occurrence [3]. However, the ranking of schools was purely based on candidates’ KCSE performance thus ignoring other factors such as the facilities available to schools, their secondary school exam entry marks [3] [4], potential temporal variations in schools’ performance amongst others. Moreover, at face value, the ranking popularly reported by the Ministry of Education does not form a good scientific basis for comparison of perfor-mance across boys only, girls only or mixed schools.
Performance in the KCSE examination varies across the country depending on factors such as classification of a school as either national or county; the number of candidates in a school; whether the school is boys only, girls only or of mixed gender; available facilities for teaching; location of a school in terms of political stability in the region amongst a myriad of other factors. There have been few published results on statistical analyses of the KCSE performance in all examinable subjects as a whole. The available published materials have focused on factors affecting KCSE performance in mathematics in diverse regions in Kenya [5] [6]. Mburu et al. [7] per-formed a descriptive survey research to investigate the influence of the type of school on gender differences in KCSE performance in Kericho and Kipkelion districts in the 2010 KCSE examinations. However, they per-formed a descriptive analysis that did not provide a mechanism to evaluate the potential temporal effect on KCSE performance which we evaluate in this article.
To fill in this gap in literature, we assess the temporal effect of the reported performance of schools between the year 2006 and 2010 in Nakuru County. The choice of this period under review is based on the fact that the data publicly availed by the Kenyan government only covers this period. We propose to fit a marginal model, specifically the Generalized Estimating Equations (GEE) of Liang and Zeger [8], in order to account for poten-tial correlation between outcomes of any given school in the five year period. More specifically, the study aims to establish if there exists significant difference in overall KCSE performance between mixed schools, Boys on-ly schools and Girls onon-ly schools in Nakuru County. In so doing, we seek to establish if performance differs sig-nificantly between boys or girls in one-gender schools compared to their counterparts in mixed schools. The outcome of this analysis will provide evidence-based insights to education policy makers as well as other rele-vant education stakeholders in Nakuru County government.
The paper is structured as follows; In Section 2, an overview of the dataset used in this analysis is presented. Section 3 provides an overview of the proposed statistical methodology while the results of the GEE analysis are presented in Section 4. Finally, in Section 5 we give a brief discussion of the main findings.
2. KCSE 2006-2010 Data
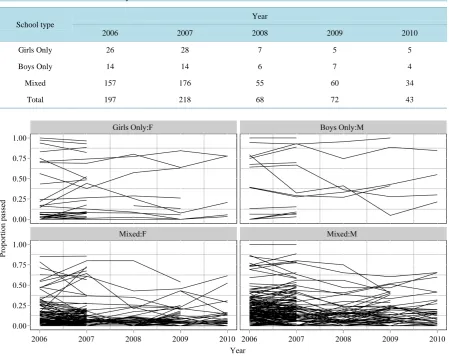
Longitudinal data on Kenya Certificate of Secondary Education (KCSE) performance was obtained from the Kenyan government open data website for the period 2006-20101. Although statistical analysis on a more recent review period would have been more interesting, the 2006-2010 review period was due to the fact that this is the only dataset that has been made publicly available by the Kenyan government. The study covered 237 unique schools within Nakuru district for the 5 year period with atleast one year of data available. Table 1 presents an overview of the number of schools of each type in the five-year period.
For each school, information was available on the number of students of a particular gender who attained a particular mean grade. Using the gender composition for a given school, the type of school was specified as boys’ school only, girls’ school only or a mixed gender school. The outcome of interest was defined as the pro-portion of students of each gender who attained a mean grade of C plus and above on a 12 point scale, where the highest score was an A plain and the lowest score was an E (1 point).
2219
Figure 1 presents the school specific evolution profiles of the proportion of students who passed in the KCSE
(attained the minimum university entry grade). The dataset had a high rate of missingness mainly attributed to the incomplete data provided by the Kenyan government. Considering the high rate of completion of secondary education in Kenya, it is highly unlikely that schools with missing data did not have candidates registered in that particular year. The missing data pattern was non-monotone which poses additional challenges in the analysis.
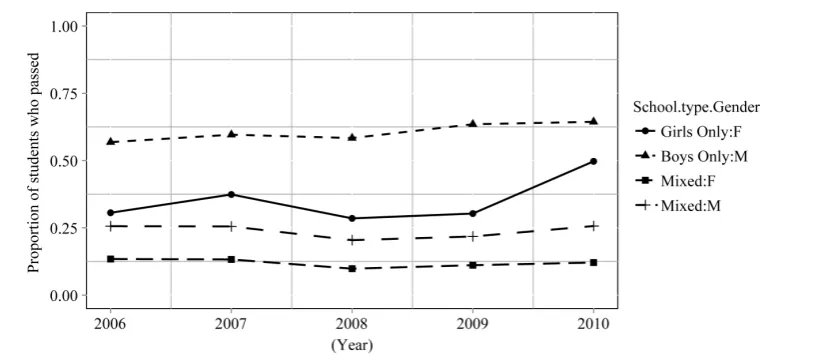
The average evolution profile for each gender in the three school types is shown in Figure 2. On average, the lowest proportion of students who attained the minimum university entry grade was from mixed schools with girls in this category performing even poorer than their male counterparts. There seems to be minimal temporal effect on the proportion of students who passed. The significance of the time effect will however be evaluated via appropriate statistical modelling tools.
3. Statistical Methodology
Let Yijk be the proportion of students who passed (attained the minimum university requirements) from school
1, 2, , 237
[image:3.595.90.540.340.696.2]i= , in time tij (j=0,, 4 for 2006-2010). Further, let k=1,, 4 be the school-type and gender specific indicator for boys from boys only school, girls from girls only school, boys from mixed schools and girls from mixed schools respectively. The variable tij was obtained by subtracting 2006 from each year so as to ease model convergence and to ensure that the model intercepts had a meaningful interpretation (probability of success in the year 2006). The marginal model for the probability of success (attaining a C plus or higher) is denoted as:
Table 1. Overview of the case study data.
School type
Year
2006 2007 2008 2009 2010
Girls Only 26 28 7 5 5
Boys Only 14 14 6 7 4
Mixed 157 176 55 60 34
Total 197 218 68 72 43
Figure 2. Average profiles for the proportion of students that passed over the five year period (2006- 2010). Its observed that on average, boys from boys schools have a higher pass rate over the years. Girls from mixed schools have a lower pass rate compared to boys from mixed schools. Moreover, for a given school type and gender, the pass-rate seems relatively constant over the years.
(
)
(
)
1logit P Yijk tij =βok+βk ijt . (1)
where βok are the gender-specific intercepts for the three types of school and β1k are the gender-specific li-near slope coefficient for each school type.
The generalized linear model [9] specified in (1) implies fitting a linear profile for each of the school-type and gender categories as visualized in Figure 2. The corresponding decomposition of the linear equations is shown in (2);
( )
(
)
01 11 02 12 03 13 04 14: Boys only school,
: Girls only school, logit
: Boys from mixed school,
: Girls from mixed school.
ij ij ij ij ij ij t t P Y t
t t β β β β β β β β + + = + + (2)
Generalized estimating equations (GEE) are an extension of generalized linear models (GLMs) to account for within cluster correlation amongst outcomes of the same school in the five-year period [8] [10]. Consider the vector of ni (of possibly correlated) outcomes Yi for the i
th
school. The within-cluster variance is defined as;
( )
1 1
2 2 .
i i i i
V = A R α A φ
(3)
where
α
is a vector of parameters describing the within-subject correlation, φ is an over-dispersion parame-ter and Ri( )
α is the working correlation matrix to model the within cluster observations. The choice of a working correlation structure Rihas been a subject of debate. One of the key properties of GEE is that, provided the mean structure (1) is correctly specified, valid inference for the covariance of β is obtained even when the working correlation is misspecified [10]. While the Quasi-likelihood under independence (QIC) criterion [11] is widely used for the selection of the working correlation, the method has been shown to result in reduced relative efficiency of parameter estimates when the covariance structure is misspecified [12]. An alternative suggestion on the choice of the working correlation structure based on further modification of QIC is the correlation infor-mation criterion (CIC) [13]. As currently implemented in the SAS Macro CriteriaWorkCorr, CIC can not ap-plied in the KCSE dataset since it requires data with monotone missingness.2221
problem and results in unbiased estimates [16] [17]. Nonmonotone (intermittent) missingness pattern poses ad-ditional difficulties in computing propensity scores (weights) used in weighted GEE [18]. Instead, we apply multiple imputation of missing data [19]-[21] the KCSE data. In the imputation step, five complete datasets are generated using SAS PROC MI, which are then used as input for the analysis step in a classical GEE analysis using PROC GENMOD. In fitting this model, the mean is specified as shown in (1), while an unstructured working correlation matrix is specified. The results of the five analyses are combined into one final output for inference using SAS PROC MIANAYZE.
4. Results
As a starting point, model (1) is fitted to the observed data before multiple imputation although the resulting output may be biased. Results shown in Table 2 were obtained under a Compound Symmetry (CS) working correlation matrix. This was a pragmatic choice since a model with an unstructured working correlation matrix did not attain convergence and formal covariance selection criteria such as CIC could not be applied on the data with intermittent missingness. The intra-cluster correlation coefficient for scores observed within a school was high at ρ=0.83.
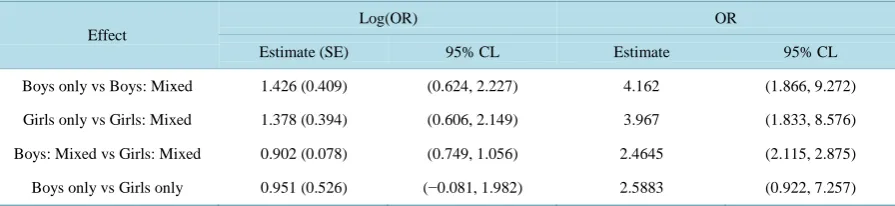
Since the time effects were not statistically significant, we performed contrasts only on the intercepts as shown in Table 3. From the 95% confidence intervals, all contrasts are statistically significant.
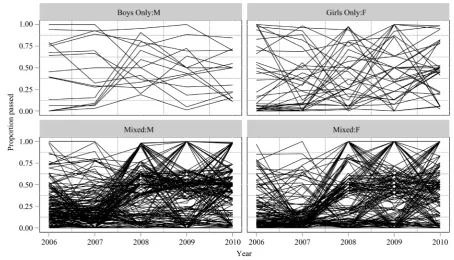
Rather than use these results for inference, multiple imputation was performed and analysis performed on the imputed datasets. Bayesian Monte-Carlo Multiple Chain (MCMC) simulation was used to impute the missing number of students who passed as well as those who failed in a given school. SAS PROC MI was applied with the fully conditional imputation method based on predictive mean matching algorithm with k = 5 closest obser-vations used for imputation. The resulting complete dataset was then used for computing the proportion of stu-dents who passed. Four new datasets were generated during this imputation step. Figure 3 presents the individ-ual profile plot from the first imputed dataset.
[image:5.595.87.539.430.588.2]The analysis step involved fitting (1) in each of the four dataset using classical GEE fitting tools. To this end, SAS PROC GENMOD with an unstructured working correlation matrix was specified. Moreover, contrasts of
Table 2. GEE: Parameter estimates from the observed data model with compound symmetry.
Parameter Effect Estimate (SE) 95% CL
Baseline
Boys only: M 0.16 (0.39) (−0.605, 0.925)
Girls only: F −0.79 (0.353) (−1.483, −0.098)
Mixed: M −1.266 (0.122) (−1.505, −1.026)
Mixed: F −2.168 (0.174) (−2.509, −1.827)
Time effect
Boys only: M −0.018 (0.084) (−0.183, 0.147)
Girls only: F 0.028 (0.069) (−0.107, 0.163)
Mixed: M −0.018 (0.03) (−0.078, 0.042)
Mixed: F 0.008 (0.031) (−0.053, 0.069)
Table 3. GEE: Contrasts for the intercept parameters corresponding to effect size in the year 2006.
Effect
Log(OR) OR
Estimate (SE) 95% CL Estimate 95% CL
Boys only vs Boys: Mixed 1.426 (0.409) (0.624, 2.227) 4.162 (1.866, 9.272)
Girls only vs Girls: Mixed 1.378 (0.394) (0.606, 2.149) 3.967 (1.833, 8.576)
Boys: Mixed vs Girls: Mixed 0.902 (0.078) (0.749, 1.056) 2.4645 (2.115, 2.875)
[image:5.595.90.538.615.718.2]Figure 3. Multiple imputation: Individual evolution profiles for the first imputed dataset.
interest comparing the intercepts and slope coefficient respectively for the three types of schools were specified with appropriately defined ESTIMATE statements. The final step in the analysis entailed combining the results of each imputed dataset for final inference. SAS PROC MIANALYZE achieved this easily for the final esti-mates of fixed effects and contrasts thereof. For the covariance matrix however, SAS output for the working correlation matrix does not include any standard errors. This renders it impossible to use MIANALYZE to ac-count for within and between imputation variability in estimating the overall covariance matrix.
Parameter estimates for fixed effects are shown in Table 4. A slightly different parametrization of the model was adopted in order to achieve error-free estimation during the combination step. As shown in Table 4, females from mixed schools were set as the reference group, from which effects of girls only schools and males was evaluated. The odds of girls from mixed schools attaining the stipulated pass mark in 2006 were exp(−0.959) = 0.383. Compared to girls from mixed schools, boys from mixed schools had a 1.65 times higher odd of success exp(0.502). Similarly, girls from girls only school had a exp(0.667) = 1.95 odds of passing compared to girls from mixed schools, while boys in mixed schools had a 3.62 higher odds of passing compared to girls from mixed schools in the year 2006. On the other hand, temporal effects were not statistically significant since the 95% confidence intervals included zero. This therefore implies that the performance of a school was relatively constant over time.
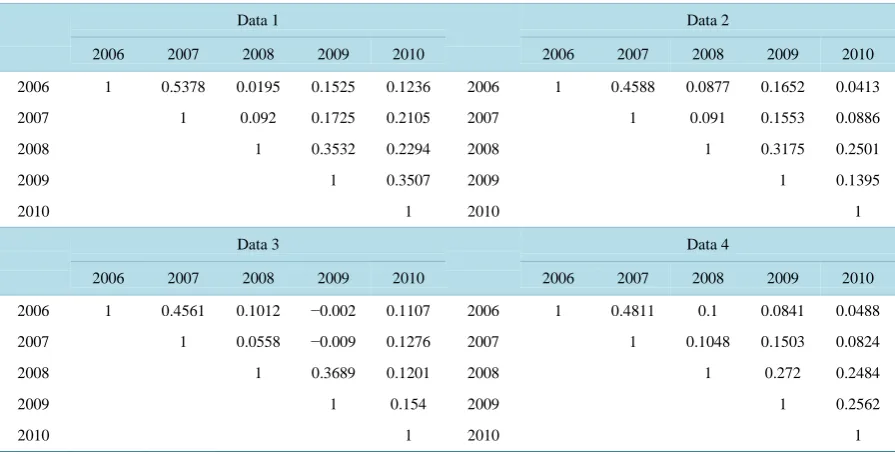
Table 5presents the combined results of the contrasts of interest from the four imputations while the working
correlation matrices for the imputed data sets are presented inTable 6. Results for some of these contrasts were already obtained directly from the parameter estimates in Table 4. The additional contrast for boys from boys only schools versus boys in mixed schools indicates that being in boys only school results in a 2.19 times the odd of passing.
Comparing the imputation results with classical GEE without accounting for missing information, particularly for the contrasts presented in Table 3 and Table 5, there was clearly a huge difference in both the estimated contrast coefficient and the corresponding standard error. This naturally impacts on inference in that, without adjusting for missing information, we conclude that there is a higher effect of gender and type of school (based on the magnitude of the odds ratio) compared to an analysis accounting for the missing information.
2223
Table 4. Multiple imputation: Parameter estimates for the combined datasets after multiple imputation.
Parameter Effect Estimate (SE) 95% CL
Baseline
Girls: Mixed −0.959 (0.129) (−1.221, −0.698)
Boys only vs Girls: Mixed 1.286 (0.42) (0.457, 2.115)
Girls only vs Girls: Mixed 0.667 (0.283) (0.102, 1.233)
Boys: Mixed vs Girls: Mixed 0.502 (0.189) (0.106, 0.899)
Time effect
Mixed:F 0.22 (0.04) (0.139, 0.3)
Boys only vs Girls: Mixed −0.25 (0.187) (−0.657, 0.158)
Girls only vs Girls: Mixed −0.147 (0.109) (−0.372, 0.078)
[image:7.595.92.538.292.464.2]Boys: Mixed vs Girls: Mixed −0.102 (0.056) (−0.216, 0.013)
Table 5. Multiple imputation: Contrasts of interest. Log (OR) 95% confidence limits (CL) not including zero are not statis-tically significant. Equivalently, OR 95% confidence limits (CL) not including 1 are not statisstatis-tically significant.
Parameter Effect
Log(OR) OR
Estimate (SE) 95% CL Estimate 95% CL
Baseline
Girls ony vs Girls: Mixed 0.667 (0.283) (0.102, 1.233) 1.948 (1.107, 3.432)
Boys: Mixed vs Girls: Mixed 0.502 (0.189) (0.106, 0.899) 1.652 (1.112, 2.457)
Boys only vs Boys: Mixed 0.784 (0.388) (0.023, 1.544) 2.19 (1.023, 4.683)
Boys only vs Girls only 0.618 (0.447) (−0.26, 1.496) 1.855 (0.771, 4.464)
Time effect
Girls ony vs Girls: Mixed −0.147 (0.109) (−0.372, 0.078) 0.863 (0.689, 1.081)
Boys: Mixed vs Girls: Mixed −0.102 (0.056) (−0.216, 0.013) 0.903 (0.806, 1.013)
Boys only vs Boys: Mixed −0.148 (0.179) (−0.534, 0.238) 0.862 (0.586, 1.269)
Boys only vs Girls only −0.103 (0.225) (−0.598, 0.392) 0.902 (0.55, 1.48)
Table 6. Multiple imputation: Working correlation matrices from the imputed datasets.
Data 1 Data 2
2006 2007 2008 2009 2010 2006 2007 2008 2009 2010
2006 1 0.5378 0.0195 0.1525 0.1236 2006 1 0.4588 0.0877 0.1652 0.0413
2007 1 0.092 0.1725 0.2105 2007 1 0.091 0.1553 0.0886
2008 1 0.3532 0.2294 2008 1 0.3175 0.2501
2009 1 0.3507 2009 1 0.1395
2010 1 2010 1
Data 3 Data 4
2006 2007 2008 2009 2010 2006 2007 2008 2009 2010
2006 1 0.4561 0.1012 −0.002 0.1107 2006 1 0.4811 0.1 0.0841 0.0488
2007 1 0.0558 −0.009 0.1276 2007 1 0.1048 0.1503 0.0824
2008 1 0.3689 0.1201 2008 1 0.272 0.2484
2009 1 0.154 2009 1 0.2562
[image:7.595.90.538.491.718.2]5. Discussion
The aim of this study was to gain insights on KCSE performance in Nakuru County, while focusing on the rela-tionship between performance of boys and girls in single-gender versus mixed schools over the five year period under review. The KCSE examinations, being the only approved university entry examinations in Kenya, play a big role in moulding the future skilled workforce. Considering the need to provide equal opportunities for both boys and girls, there is need for an evaluation of the disparities that exist in the education sector so as to provide adequate remedial measures. While most of the past research on KCSE performance has focused on mance of both boys and girls in sciences and mathematics, little has been done to compare the overall perfor-mance taking into account temporal variations.
The goal of the analysis presented in this article was twofold. First, the need to evaluate performance for more than one year imposes potential correlation in the performance of a given school over time. This is accounted for by fitting a marginal generalized linear model. Secondly, it is possible that over time, different categories of schools may change, either due to a “learning effect” where schools learn from their “past mistakes” hence im-prove, or generally due to policy changes in the education sector amongst a myriad of other factors.
However, the results of this analysis did not reveal any significant effect of time in the performance of boys and girls in same-gender or mixed schools. Possible reason for this can be the fact that, with the classification of schools as either national, county or even local day schools, admission to these schools is based on a standar-dized examination (the Kenya Certificate of Primary Education, KCPE) and different schools only admit stu-dents meeting a certain threshold. This therefore implies that a school admits a relatively homogeneous lot of students every year, in terms of their academic abilities; hence, there is a limit beyond which these students ex-ceed in terms of academic performance. Thus, national schools, which admit the best performers in KCPE, con-tinue to register constantly higher pass-rates compared to county schools. Future analyses should therefore pos-sibly adjust for this classification of schools in evaluating performance.
With regards to same-gender versus mixed schools, as has been shown in other unrelated studies of perfor-mance in examinations, both in Kenya and abroad, girls in mixed schools do not realize their full potential, probably due to inferiority complex while co-studying with boys. Nationally, this is even more evident from the fact that the best schools overall are mostly same gender schools. Moreover, boys in mixed schools do not achieve their full potential compared to their counterparts in boys-only schools.
From a policy formulation perspective, rather than blatantly dissolve all mixed-gender schools, an objective analysis ought to be performed on how best to bring the performance of boys and girls at par with their counter-parts in same-gender schools. This is due to the fact that mixed schools provide a natural setting that students will always be exposed to in their future lives. For instance, workplaces are rarely defined as one-gender envi-ronments, family composition almost always entails interacting with both genders and even more, social interac-tions cannot be limited to one gender only. One possible ways to boost performance in mixed schools was what was piloted in Nakuru High School. Being a mixed school on paper, the school administration actually separated boys from girls during teaching activities. Each gender attended separate classes, albleit from the same teachers, and only integrated during co-curricular activities on a daily basis. This approach not only fostered direct com-petition between boys and girls, but also provided an opportunity for teachers to dedicate more resources where needed to boost girls performance. The obvious shortcoming of this approach however, is the duplication of re-sources and therefore the implication in terms of cost and time.
The analysis also presented a challenge with availability of appropriate records from government institutions. Although the initiative to provide an open data platform was noble, the government of Kenya has failed in up-dating the database with up to date information in terms of being current and complete. Multiple imputations performed in this analysis to fill in the gaps would not have been necessary, had there been complete data. Data- driven decision making is a growing trend and with the massive data being hoarded by the Kenyan government, a lot more information can be derived to guide policy formulation especially in education.
References
[1] Eshiwani, G. (1993) Education in Kenya since Independence. East African Educational Publishers, Nairobi.
[2] Wanyama, I. and Njeru, E. (2004) The Sociology of Private Tuition. Discussion Paper, Institute of Policy Analysis and Research, Nairobi.
Ex-2225
aminations: The Perception of Teachers and Students. Problems of Education in the 21st Century, 20, 10-24.
[4] K. C. of Inquiry into the Education System of Kenya and D. Koech, Totally Integrated Quality Education and Training, TIQET: Report of the Commission of Inquiry into the Education System of Kenya. Republic of Kenya, 1999.
[5] Mbugua, Z.K., Kibet, K., Muthaa, G.M. and Nkonke, G.R. (2012) Factors Contributing to Students Poor Performance in Mathematics at Kenya Certificate of Secondary Education in Kenya: A Case of Baringo County, Kenya. American
International Journal of Contemporary Research, 2, 87-91.
[6] Yara, P.O. and Catherine, W.W. (2011) Performance Determinants of Kenya Certificate of Secondary Education (KCSE) in Mathematics of Secondary Schools in Nyamaiya Division, Kenya. Asian Social Science, 7, 107-112.
http://dx.doi.org/10.5539/ass.v7n2p107
[7] Mburu, D.D.N.P. (2013) Effects of the Type of School Attended on Students Academic Performance in Kericho and Kipkelion Districts, Kenya. International Journal of Humanities and Social Science, 3, 79-89.
[8] Zeger, S.L., Liang, K.-Y. and Albert, P.S. (1988) Models for Longitudinal Data: A Generalized Estimating Equation Approach. Biometrics, 44, 1049-1060. http://dx.doi.org/10.2307/2531734
[9] McCullagh, P. and Nelder, J. (1989) Generalized Linear Models. 2nd Edition, Chapman & Hall/CRC Monographs on Statistics & Applied Probability. Taylor & Francis, London.
[10] Molenberghs, G. and Verbeke, G. (2005) Models for Discrete Longitudinal Data. Springer Series in Statistics. Springer, Diepenbeek and Leuven.
[11] Pan, W. (2011) Akaike’s Information Criterion in Generalized Estimating Equations. Biometrics, 57, 120-125.
http://dx.doi.org/10.1111/j.0006-341X.2001.00120.x
[12] Fitzmaurice, G.M. (1995) A Caveat Concerning Independence Estimating Equations with Multivariate Binary Data.
Biometrics, 51, 309-317.
[13] Hin, L. and Wang, Y. (2009) Working-Correlation-Structure Identification in Generalized Estimating Equations.
Sta-tistics in Medicine, 28, 642-658. http://dx.doi.org/10.1002/sim.3489
[14] Little, R.J. and Rubin, D.B. (2014) Statistical Analysis with Missing Data. 2nd Edition, John Wiley & Sons, Hoboken.
[15] Zorn, C.J.W. (2001) Generalized Estimating Equation Models for Correlated Data: A Review with Applications.
American Journal of Political Science, 45, 470-490. http://dx.doi.org/10.2307/2669353
[16] Robins, J.M. and Rotnitzky, A. (1995) Semiparametric Efficiency in Multivariate Regression Models with Missing Data. Journal of the American Statistical Association, 90, 122-129.
http://dx.doi.org/10.1080/01621459.1995.10476494
[17] Preisser, J.S., Lohman, K.K. and Rathouz, P.J. (2002) Performance of Weighted Estimating Equations for Longitudinal Binary Data with Drop-Outs Missing at Random. Statistics in Medicine, 21, 3035-3054.
http://dx.doi.org/10.1002/sim.1241
[18] Horton, N.J. and Kleinman, K.P. (2007) Much Ado about Nothing: A Comparison of Missing Data Methods and Soft-ware to Fit Incomplete Data Regression Models. The American Statistician, 61, 79-90.
http://dx.doi.org/10.1198/000313007X172556
[19] Rubin, D.B. (1976) Inference and Missing Data. Biometrika, 63, 581-592. http://dx.doi.org/10.1093/biomet/63.3.581
[20] Berglund, P. and Heeringa, S. (2014) Multiple Imputation of Missing Data Using SAS®. IT Pro, SAS Institute, Cary.