A Comparative Study of Ensemble Methods for
Students’ Performance Modeling
Mrinal Pandey
Banasthali University Rajasthan ,India
S. Taruna
Banasthali University Rajasthan ,India
ABSTRACT
Student performance prediction is a great area of concern for educational institutions to prevent their students from failure by providing necessary support and counseling to complete their degree successfully. The scope of this research is to examine the accuracy of the ensemble techniques for predicting the student’s academic performance, particularly for four year engineering graduate program. To this end, five ensemble techniques based on four representative learning algorithms, namely Adaboost, Bagging, Random Forest and Rotation Forest have been used to construct and combine different number of ensembles. These four algorithms have been compared for the same number (ten) of base classifiers and the Rotation Forest is found to be the best ensemble classifiers for predicting the student performance at the initial stages of the degree program.
General Terms
Algorithms, Performance.Keywords
Prediction, Efficiency, Ensembles, Performance, Learning, Algorithms
1.
INTRODUCTION
Today ensemble learning techniques became more interesting in the field of predictive modeling. It is an effective technique to combine multiple learning algorithms to improve the overall prediction accuracy [1]. The ensemble methodologies have been successfully applied in many fields such as finance, healthcare, bioinformatics, manufacturing, etc. In this research, four popular ensemble techniques, namely Adaboost, Bagging, Random Forest and Rotation Forest have applied to predict the student’s academic performance. This paper contributes in two folds. 1.) To investigate the behavior of the ensemble classifiers in terms of accuracy and error (RMSE) with respect to different number of ensembles (iterations). 2.) To compare and analyze the performance of the aforementioned ensemble classifiers in terms of True Positive Rate, False Positive Rate and Receiver Operator Curve analysis. The remaining paper is organized in the following sections. Section 2 describes the Ensemble Methods used in this study. The related work is presented in section 3. Methodology is discussed in section 4. Conclusion and Future work is discussed in section 5 and section 6 respectively.
2.
ENSEMBLE METHODS
The Ensemble classification is based on the philosophy that a group of experts gives more accurate decisions as compared to a single expert. Ensemble modeling combines the set of
better accuracy. Research shows that prediction from a composite model gives better results as compare to a single model prediction. The research in the field of ensemble methods became popular from the last decades. A number of experimental studies have been performed by the machine learning researchers; they prove that combining the outputs of multiple classifiers reduces the generalization error [2, 3, 4, and 5]. This section describes the ensemble techniques used in this paper.
2.1
Bagging
Bagging [6] is based on Bootstrap [7] sampling technique. In each iteration a different set of bootstrap sample is generated for constructing the individual classifier of the same algorithm. Bootstrap sampling technique selects the data item randomly with replacement, i.e. some instance, can be repeated or some of them can be missed out from the original dataset during the sampling step. The next step of bagging is to combine all the classifiers constructed in previous phase. Bagging combines the result of the classifiers with the help of voting to make final prediction. According to [6] Bagging is an effective ensemble technique for unstable learning algorithms where small changes in the training data set results in big changes in predictions for e.g. Decision Tree, Neural Network etc.
2.2
Boosting
Boosting boosts the performance of the weak classifier to a strong level. It generates sequential learning classifiers using resampling (reweighting) the data instances. Initially equal uniform weights are assigned to all the instances. During each learning phase a new hypothesis is learned and the instances are reweighted such that correctly classified instance having lower weight and system can concentrates on instances that have not been correctly classified during this phase having higher weights. It selects the wrongly classified instance, so that they can be classified correctly during the next learning step. This process continuous tills the last classifier construction. Finally the results of all the classifiers are combined using majority voting to find the final prediction. AdaBoost [8] is a more general version of the Boosting algorithm.
2.3
Random Forest
than considering all possible splits M, and the best split is chosen from this subset. Final classification is done by majority vote across trees.
2.4
Rotation Forest
Rotation Forest is a new ensemble technique based on decision tree and the Principal Component Analysis (PCA) [10]. The attribute set F is randomly divided into K subsets and PCA is applied independently to each subset to generate a training set for base classifier using a K axis rotation of feature subset. Rotation Forest preserves all the information by retaining all the PCA. The decision tree is used as a base classifier for Rotation Forest.
3.
RELATED WORK
A study on student performance prediction using KNN has been conducted to identify students who have a high risk of failure [11]. They observed that evaluation on early stages is more useful for final result prediction as the necessary action can be taken for students who need help and support.
In another study [12], five classification algorithms have been compared to student performance predictions. They used three variations of the naïve bayes algorithm for nominal data, whereas multiple regression and support vector machine algorithms were used for numerical data. The naïve Bayes algorithm was proposed in this study.
Authors of [13] compared the performance of 6 different machine learning algorithms for analyzing student’s performance prediction in final exams particularly for distance education. They studied decision trees, neural networks, naive bayes, instance-based learning, logistic regression, support vector machines and compared them with genetic algorithm based on induction of decision trees. In another research [14], a case study was conducted to predict student drop-out using different classification and the cost-sensitive learning approach for different data sets. They found that the decision tree classifiers e.g J48 and CART give better results as compared to bayes net and JRip rule classifiers.
Authors of [15] proposed online ensembles of a classifier for predicting students’ performance particularly for distance education. They proposed an online ensemble of classifiers that combines an incremental version of Naive Bayes, the 1-NN and the WI1-NNOW algorithms using the voting methodology and conclude that this approach is better than batch line mode of ensemble classifiers for developing decision support tool for distance education.
In another study a CRISP methodology was used to analyze the performance of students in C++ course. The authors of [16] compared 2 decision tree classifiers ID and C4.5 with a naïve Bayes classifier.
A case study for MCA students was conducted [17] to predict the result in final exam based on their internal marks. They employed two decision tree algorithms, namely ID3 and C4.5 for the prediction and the predicted result set was also compared with the original result set to confirm the accuracy of the proposed model.
A research was conducted [18] using ensemble methods. The Authors proposed Adaboost ensemble with the genetic algorithm to predict the performance of the students in early stages so that the risk of failure can be controlled by providing appropriate advising to the students those are at high risk.
In [19] authors proposed a generalized Student Success System (S3) that provides an ensemble-based analytical system for tracking student academic success. This system consists of a flexible predictive modeling engine that uses machine learning techniques to identify student who are at risk, a set of advanced data visualizations and a case management tool for applying management intervention. The authors of [20] compared several different models for tracking student knowledge within intelligent tutoring systems. They also performed some ensemble techniques to ensemble multiple student models at the action level and evaluate the predictions in terms of future performance within the tutor and on a paper post-test.
4.
METHODOLOGY
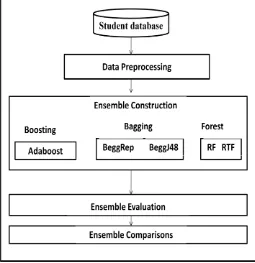
[image:2.595.317.572.441.704.2]The methodology for this research is divided into four steps. The first step starts with the student data collection followed by preprocessing. The next step is ensemble construction and the last step is ensemble comparisons. The methodology is depicted in Figure 1. Initially boosting, bagging and two forest based ensemble models have been constructed for different number of iterations and different numbers of trees. In this experiment Decision Stumps of Adaboost (AdaDS) and 2 base learner namely Reptree (Beggrep) and J48 of Bagging (BeggJ48) were run for (1, 2, 5, 15, 50,100) iterations. Similarly, RF (Random Forest) and RTF (Rotation Forest) were run with their default parameters for (1, 2, 5, 10, 15, 50,100) trees for creating different ensembles. The performance of different ensembles was compared on the basis of traditional accuracy measure and the prediction errors (RMSE) for the each iteration. In the next phase of experiment Bagging, Boosting, Random Forest and Rotation Forest ensemble models were compared and analyze for the standard iteration 10.
4.1
Experimental Setup
4.1.1
Tool Selection
The WEKA toolkit is selected for this study. WEKA is an open source tool [21]. It provides various data mining tasks and machine learning algorithms. This research is based on ensemble techniques. Various ensemble methods, e.g. Adaboost, Bagging and Rotation Forest Algorithms are available in a meta algorithms, branch of classifiers and Random Forest is available under the tree branch on WEKA tool. This study takes the advantages of two interfaces of WEKA tool. The first experiment is carried out with the help of Explorer Interface for constructing different ensembles for different iterations and The Knowledge Flow Interface is used for constructing the multiple ROC curves for classifier comparisons.
4.2
Data Preprocessing
[image:3.595.312.557.410.705.2]The data for the study is collected from an engineering college in an EXCEL sheet from India. The data set consists of student’s demographic information and academic performances from high school to the first year of the engineering course. The classification task is to predict whether a student will be able to complete his degree successfully or not by the end of the final year of his degree program. The original dataset consists of 1000 instances, 10 attributes and 1 class attribute. The student’s performance data were continuous data. It was converted into nominal (categorical) data. The initial data cleaning and transformation were done manually by filling missing values with the standard values. Table 1 shows the attribute description along with possible values.
Table 1: Attribute Description
S. N Name Description Possible Values
1 10th-Grade
Student ‘s Grades in
Class Standard 10th P,F 2
Grade-12th
Student ‘s Grades in
Class Standard 12th P,F 3 Board
of 10th
Name of High school board
CBSE,ICSE,H CSE 4 Board
of 12th
Name of Senior secondary board
CBSE,ICSE,H BSE
5 1
st
year-Grade3
Aggregate grades of 1st
and 2nd semester P,F
6 Gap Gap in study 0,1,2
7 Gender Student Gender Male, Female 8 Age Age of student 22,23,24,25,26
9 region Region of student
NCR,FARIDA
BAD,OUTER-ZONE 10 Branch Student Branch CSE,IT,MECH,
ECE 11 Final/Cl
ass Predicted Value P,F
4.3 Ensemble Construction & Evaluation
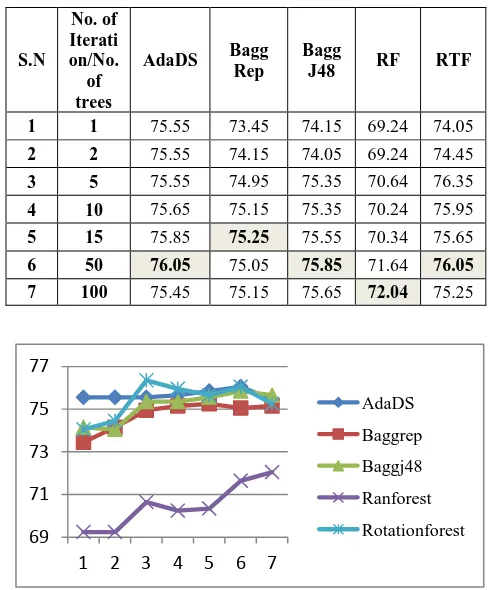
Table 2 shows the results of the first phase of the experiment. Iteration number 1 represents the results for a single model (classifier) construction. While iteration number 2, 5, 10, 50 and 100 represents the results of number of respective ensembles. It can be noticed that the accuracy of the Adaboost is almost stable and the highest accuracy is achieved for 50 ensembles. The accuracy of Bagging varies from 73% to 75% for Reptree and 74% to 75% for J48 base learners. Similarly the accuracy varies from 74% to 76% and 69% to72% of Rotation Forest and Random Forest respectively.Figure 2 shows the behavior of ensembles with respect to the number of iterations. The X axis represents a serial number of iterations and the Y axis represents the accuracy percentages of the ensembles. This can be observed that the accuracy of the ensembles is good enough for Adaboost, Bagging and Rotation Forest, but the accuracy of Random Forest is relatively poorer than the other classifiers in this particular study.
Table 3 shows the prediction error in terms of RMSE and Figure 3 depicts the graphical representation of RMSE errors for aforementioned algorithms. The X axis represents a serial number of iterations and the Y axis represents the RMSE errors. It is noticeable that the error rate for RF is highest.
Table 2: Accuracy of Ensembles in percentage
S.N
No. of Iterati on/No.
of trees
AdaDS Bagg Rep
Bagg
J48 RF RTF
1 1 75.55 73.45 74.15 69.24 74.05
2 2 75.55 74.15 74.05 69.24 74.45
3 5 75.55 74.95 75.35 70.64 76.35
4 10 75.65 75.15 75.35 70.24 75.95
5 15 75.85 75.25 75.55 70.34 75.65
6 50 76.05 75.05 75.85 71.64 76.05 7 100 75.45 75.15 75.65 72.04 75.25
Figure 2: Accuracy of Ensembles with respect to iterations
69 71 73 75 77
1 2 3 4 5 6 7
[image:3.595.50.288.430.742.2]Table 3: RMSE Error
Figure 3: RMSE with respect to iterations
4.3
Ensemble Comparison
In the next phase of the study five aforementioned ensemble models were compared for 10th iteration and for 10 numbers of tree constructions. All the models have been evaluated on 10 fold cross validation. However the accuracy rate is most commonly used empirical measure for model evaluation, but it is not sufficient enough while working with imbalance datasets. It does not differentiate the numbers of correctly and incorrectly classified examples of the respective classes and may lead to erroneous conclusions [22]. Therefore, in this study the True Positive Rate (TPR), False Positive Rate (FPR) and Receiver Operator Curve (ROC) are also used for model evaluations.
TPR can be defined as the proportion of positive tuples that are correctly identified in a given class [24]. It can also be termed as sensitivity and hit ratio.
TPR=TP/TP+FN (1) FPR can be defined as the proportion of negative tuples that are incorrectly identified as positive in a given class [23]. It is also termed as a false alarm.
FPR=FP/FP+TN (2) ROC curves are a useful visualization tool for comparing
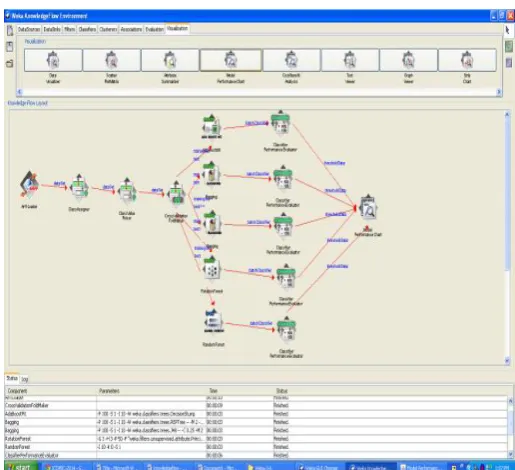
positive rate for a given model [23]. The X axis represents the TPR and Y axis represents the FPR as shown in Figure 4, from [23]. The accuracy of a model using ROC Curves can be measured in terms of the area under the curve (AUC). If a curve is approaching towards the 1.0 values on the Y axis, then the model is more accurate, while the AUC (curve) is closer to 0.5, then the corresponding model is less accurate and a model with perfect accuracy will have an area of 1.0. In our research we have used Knowledge Flow Interface of WEKA for constructing multiple ROC curves for aforementioned ensembles. Figure 5 shows the Knowledge Flow diagram for constructing the multiple ROC curve for class F.
[image:4.595.316.569.239.441.2]Figure 4: ROC curve
Figure 5: Knowledge Flow representation for comparing classifiers
0.41 0.43 0.45 0.47 0.49 0.51
1 2 3 4 5 6 7
AdaDS Baggrep Baggj48 Ranforest Rotationforest
S.N
No. of Iterati on/No.
of trees
Ada DS
Bagg Rep
Bagg
J48 RF RTF
1 1 0.4301 0.4435 0.4439 0.5203 0.4409
2 2 0.4217 0.4363 0.4261 0.4876 0.4332
3 5 0.4143 0.423 0.4182 0.458 0.4197
4 10 0.4217 0.4176 0.4178 0.4514 0.4206
5 15 0.4135 0.4146 0.4174 0.458 0.4173
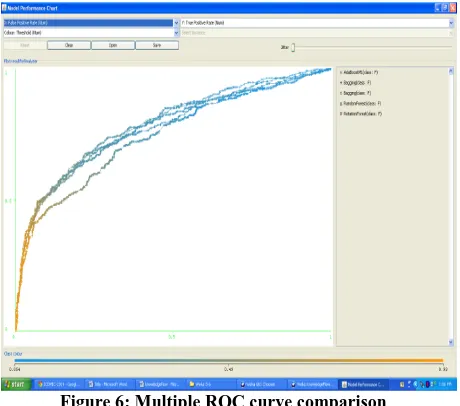
[image:4.595.315.573.466.701.2]Figure 6 shows the ROC curve comparison for five aforementioned ensembles for class value ‘F’. Ideally an optimal classifier should have ROC area values approaching towards 1. The ROC area value (AUC) for the classifiers is given in Table 4. It can be observed that the AUC has maximum value .789 by using AdaDS and minimum for RF (.742). The AUC values for the classifiers are in the range of .74 to .78. Therefore, this evaluation process is worthwhile in this study. Table 4 also depicts the evaluation results in terms of TPR and FPR for both the classes ‘P’ and ‘F’. Figure 7 and 8 represents the graphical representation of TPR and FPR respectively, for all the five ensembles. The range of TPR is greater than 80% for class ‘P’ and the range of TPR is less than 60% for class ‘F’ as shown in Figure 6. Similarly the FPR is less than 50% for class ‘P’ and less than 20% for class ‘F’ except using RF. It has the highest FPR rate for class F amongst all 5 ensemble classifiers as shown in Figure 7.
Figure 6: Multiple ROC curve comparison
Table 5 shows the summary of the experiment in terms of the kappa statistics value, time to build models, accuracy of the model, RMSE and the efficiency of the individual classes.
Table 4: Evaluation results of ensembles
Classifiers Class TP Rate FP Rate ROC Area
AdaDS P 0.898 0.482 0.789
F 0.518 0.102 0.789
BaggRep P 0.882 0.469 0.778
F 0.531 0.118 0.778
RTF P 0.906 0.488 0.769
F 0.512 0.094 0.769
BaggJ48 P 0.893 0.482 0.774
F 0.518 0.107 0.774
RF P 0.804 0.469 0.742
F 0.531 0.196 0.742
Figure 7: TPR for ensembles
[image:5.595.55.285.279.482.2]Figure 8: FPR for ensembles
Table 5: Summary of Experiment
0 0.2 0.4 0.6 0.8 1
RTF RF Baggj48 Baggrep AdaDS P
F
0 0.2 0.4 0.6
P
F
Experimental Statistics Efficiency of classes in %
Classifiers Time in
Seconds Efficiency
Correctly Classified Instances
Incorrectly Classified Instances
Kappa Statistic
Root Mean Squared
Error
P F
RTF 1.25 75.95% 758 240 0.4481 0.4206 75.83 76.31
AdaDS 0.05 75.65% 755 243 0.4435 0.4135 75.88 75.00
BeggRep 0.08 75.15% 750 248 0.437 0.4176 76.07 72.69
BeggJ48 0.14 75.35% 752 246 0.4376 0.4178 75.78 74.13
[image:5.595.70.528.595.751.2]Figure 9: FPR for ensembles
Kappa is a measure of agreement normalized for chance agreement. It can be defined as
) E ( P 1
) E ( P ) A ( P K
(4) Where: P (A) is the percentage agreement, between the classifier and the actual truth.
P (E) is the chance agreement. The ideal value of K=1, indicates perfect agreement, and K=0 indicates chance agreement.
Root Mean squared error is also known as the root mean square deviation (RMSD). It is a frequently used measure of the difference between values predicted by a model and the values actually observed from the environment that is being modeled. The RMSE of a model prediction with respect to the estimated variable is defined as the square root of the mean squared error. It can be defined as
d
)
y
y
(
RMSE
d
1 i
2 ' i i
(5) It is clear from the table that RTF is the best ensemble classifier for the study in terms of classifier accuracy as well as in terms of class accuracy for class ‘P’ and ‘F’ both. RTF is having highest kappa statistics value, where as the RF ensemble is lowest in the classifier’s performance, class predictions as well as poor in terms of kappa statistic and RMSE values for this particular study.
5.
CONCLUSION
In this study five ensemble classifiers of four aforementioned algorithms have been compared and analyzed for predicting student performance. It has been observed that the performance of Rotation Forest algorithm is highest where as the performance of Random Forest algorithm is lowest for student performance prediction. The performance of Adaboost and Bagging ensembles are better than RF and close to RTF.
The performance of RTF ensemble is best amongst all algorithms is terms of model accuracy, class accuracy as well as TPR, FPR and for ROC curves. The RTF is leading with 75.95% model accuracy, and obtained 75.83% and 76.31% class accuracy for class ‘P’ and ‘F’ is respectively. TPR rate is higher for class ‘P’ and lower for class ‘F’, but the FPR is good for class F using RTF classifiers.
6.
FUTURE WORK
In this research a limited number of academic performances are available for the prediction. We will use more academic grades at different stages of the degree program in order to improve the accuracy of the models as a future work. This work can be enhanced by improving the TPR rate for class F.
7.
REFERENCES
[1] Dietterich TG.(2000). Ensemble methods in machine learning. In: Proceedings of Multiple Classifier System. vol. 1857. Springer;( 2000). pp. 1–15.
[2] Bauer, E. and Kohavi, R. 1999. An Empirical Comparison of Voting Classification Algorithms: Bagging, Boosting, and Variants. Machine Learning, 35: 1-38.
[3] Domingos, P. 1996. Using Partitioning to Speed Up Specific-to-General Rule Induction. In Proceedings of the AAAI-96 Workshop on Integrating Multiple Learned Models, pp. 29-34, AAAI Press..
[4] Opitz, D. and Maclin, R. 1999. Popular Ensemble Methods: An Empirical Study, Journal of Artificial Research, 11: 169-198, 1999.
[5] Quinlan, J. R.1996. Bagging , Boosting, and C4.5. In Proceedings of the Thirteenth National Conference on Artificial Intelligence, pages 725-730.
[6] Breiman L.1996. Bagging predictors, Machine Learning, 24(2):123-140.
[7] Efron, B. and Tibshirani, R.J. 1993. An Introduction to the Bootstrap, Chapman & Hall, New York.
[8] Freund, Y. and Schapire, R. Experiments with a New BoostingAlgorithm, Proceedings: ICML’96, 148–156. [9] Breiman, L.: Random forests.2001. Mach. Learn. 45(1),
5–32 .
[10]Rodrguez, J. J., Kuncheva , L. I. and Alonso, C. J. 2006. Rotation forest: A new classifier ensemble method,IEEE Transactions on Pattern Analysis and Machine Intelligence, vol.28, no.10, pp.1619-1630, 2006.
[11]Tanner, T. and Toivonen H. 2010. Predicting and preventing student failure – using the k-nearest neighbour method to predict student performance in an online course environment,International Journal of Learning Technology(IJLT) ,Vol. 5, pages 356-377. [12] Wilhelmiina, H. and Vinni, M. 2006. Comparison of
machine learning methods for intelligent tutoring systems,Intelligent Tutoring Systems, Vol. 4053, of Lecture Notes in Computer Science, pages 525-534. [13]Kalles, D. and Pierrakeas C. 2004. Analyzing student
performance in distance learning with genetic algorithms and decision trees, Laboratory of Educational Material and Educational Methodology Hellenic Open University, Patras, Greece.
[14]Dekker,G., Pechenizkiy, M., and Vleeshouwers , J. 2009. Predicting students drop out: a casestudy. Proceedings of the 2nd International Conference on Educational Data Mining, pages 41-50.
[15]Kotsiantis,S., Patriarcheas, K., Xenos, M. 2010. A combinational incremental ensemble of classifiers as a 0
0.2 0.4 0.6
P
Systems 23 (2010) Pages 529–535, journal homepage: www.elsevier.com/ locate/knosys.
[16]Kumar , S. Anupama and Vijayalakshmi, M.N . 2011. Efficiency of Decision Trees in Predicting Student,Academic Performance.Computer Science & Information Technology 02, pp. 335–343,2011.
[17]Sharaf, Ahmed., Malaka, ElDen., Moustafa, A., Harb, Hany M., Emara, Abdel H.(2013). Adaboost Ensemble with Simple Genetic Algorithm for Student Prediction Model, International Journal of Computer Science & Information Technology (IJCSIT) Vol 5, No 2, April 2013.
[18]Essa, Alfred. and Ayad, Hanan. 2012. Improving student success using predictive models and data Visualizations, Research in Learning Technology Supplement: ALT-C 2012 Conference Proceedings, ISBN 978-91-977071-4-5 (print), 978-91-977071-5-2(online), http://dx.doi.org/10.3402/rlt.v20i0.19191.
[19] M., Bahador B. Nooraei., and Heffernan, Neil T.2011. Ensembling Predictions of Student Knowledge within
Intelligent Tutoring Systems, Joseph A. Konstan et al. (Eds.): UMAP 2011, LNCS 6787, pp. 13–24, 2011.© Springer-Verlag Berlin Heidelberg .
[20]Weka, University of Waikato, New Zealand,http://www.cs.waikato.ac.nz/ml/weka/.
[21]Galar, Mikel., Fern´andez, Alberto., Barrenechea, Edurne., Bustince Humberto, and Herrera, Francisco .2011.A Review on Ensembles for the Class Imbalance Problem: Bagging-, Boosting-, and Hybrid-Based Approaches. IEEE Transcations on systems, Man and Cybernetics—Part –c:Applications and Reviews, Digital Object Identifier 10.1109/TSMCC.2011.2161285. [22]Han, J., Kamber M. and Pie. 2006. Data Mining
Concepts and Techniques 2nd edition, Morgan Kaufmann Publishers 2006.