Texture Feature Extraction of RGB, HSV, YIQ and
Dithered Images using GLCM, Wavelet Decomposition
Techniques
Manisha Lumb
Research Scholar, D.A.V.I.E.T, Jalandhar
Poonam Sethi
Asst. Prof. D.A.V.I.E.T, Jalandhar
ABSTRACT
When changing the format of an image from simple RGB to HSV, YIQ and Dithered image, the characteristics of image also change. In this paper, the similar images in the above formats are retrieved using statistical and structural retrieving techniques i.e. GLCM (Gray Level Co-occurrence Matrix) and Wavelet Decomposition techniques. The best results are coming for dithered, HSV images by using GLCM technique for feature extraction and by using Wavelet decomposition; HSV images are giving the best results. While other formats also give the correct retrieval but from the accuracy point of view, HSV images are retrieved with better accuracy using both techniques.
Keywords: HSV (Hue Saturation Value), YUV (Y – luminance component, U,V – chrominance component.
1. INTRODUCTION
The recent revolution in communication systems, digital image sensor technologies and storage devices has caused a rapid increase in the size of digital image databases. Every day, many computer-based applications and equipment generate Terabytes of digital images. A huge amount of information exists in arts, medicine, military and many other fields. This huge amount of image data must be well organized to allow rapid and efficient browsing, searching and retrieval. Researchers are studying image retrieval from two different angles, one being text-based and the other visual based.
Text-based methods use keywords and annotations, while visual-based methods use the visual contents of the image like color, shape, texture and spatial layout. Content-based image retrieval (CBIR) is a technique which uses visual content to search and compare images from large scale image databases according to the interests of users, in such databases each image is represented by a unique [1].
The algorithms used in these systems are commonly divided into three tasks:
- Extraction, - Selection, and - Classification.
The extraction task transforms rich content of images into various content features. Feature extraction is the process of generating features to be used in the selection and classification tasks. Feature selection reduces the number of features provided to the classification task. Those features which are likely to assist in discrimination are selected and used in the classification task [2].
There are four major issues in texture analysis:
1) Feature extraction: to compute a characteristic of a digital image able to numerically describe its texture properties;
2) Texture discrimination: to partition a textured image into regions, each corresponding to a perceptually homogeneous texture (leads to image segmentation);
3) Texture classification: to determine to which of a finite number of physically defined classes (such as normal and abnormal tissue) a homogeneous texture region belongs; 4) Shape from texture: to reconstruct 3D surface geometry from texture information [3].
The classification problem is basically the problem of identifying an observed textured sample, as one of several possible texture classes by a reliable but computationally attractive texture classifier. This implies that the choice of the textural features should be as compact as possible and yet as discriminating as possible. In other words, the extraction of texture features should efficiently embody information about the textural characteristics of the image [4].
2. FEATURE EXTRACTION IN
DIFFERENT FORMATS
There are so many formats of an image in which it can be transformed from a simple RGB image. While doing this transforming, the image characteristics are changed and to retrieve this type of image, different parameters are to be explored. When comparing the features of similar images, it can be concluded that in some of the formats image retrieval is possible from texture feature approaches.
Typically, the color of an image is represented through some color model. There exist various color models to describe color information. A color model is specified in terms of 3-D coordinate system and a subspace within that system where each color is represented by a single point. The more commonly used color models are RGB (red, green, blue), HSV (hue, saturation, value) and Y,Cb,Cr (luminance and chrominance)[2].
2.1 Feature extraction in RGB
Fig.1 RGB Query image
2.2 Feature extraction in HSV
It is essential to quantify HSV space component to reduce computation and improve efficiency. Unequal interval quantization according the human color perception has been applied on H, S, and V components. In accordance with the different colors and subjective color perception quantification, quantified hue (H), saturation (S) and intensity (V) are obtained.[5] Hue ranges from 0 to 360 degrees, with variation beginning with red, going through yellow, green, cyan, blue and magenta and back to red [2].
Fig.2 HSV image
2.3 Feature extraction of YIQ
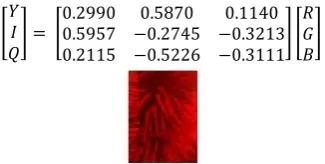
For a color image, the RGB model is the well-known color model. However, it is not a uniform color model. The YIQ model is more related to the human perception, since it can isolate luminance and chrominance. Hence, in this paper, the image retrieval is performed using the YIQ model. Because a probability distribution is uniquely characterized by its moments, the color distributions of the Y, I, and Q components of an image can be represented respectively by its color moments. The first color moment of the i-th color component ( i 1, 2, 3) is defined by
Where , is the color value of the i-th color component of
the j-th image pixel and N is the total number of pixels in the image [7]. The Y IQ color space is adopted by the NTSC (National Television System Committee) video standard in reference to RGB NTSC.[8] The color space of YIQ images is given by:
[image:2.595.86.249.627.709.2]
Fig. 3 YIQ image
2.4 Texture Feature extraction form the
dithered image:
Image dithering is often used for commercial print products like newspapers and magazines. Many printers (e.g., laser and inkjet printers) can only put a series of single black dots on paper. Intensity is then regulated by the local density of the dots. This process is called dithering. However, when a dithered image is scanned, the interaction between the discrete scanning process and dithering may seriously degrade the image. Dithering and scanning are often both periodic, leading to periodic interference artifacts. These can be removed by proper filtering in the spatial 2D Fourier domain. It is simplest to replace each pixel with a small array of random black dots, with the number of dots proportional to the intensity [9].
Fig.4 Dithered image
3. TECHNIQUES OF FEATURE
EXTRACTION
3.1 Use of GLCM matrix computation:
To design an effective algorithm for texture classification, it is essential to find a set of texture features with good discriminating power. Most of the textural features are generally obtained from the application of a local operator, statistical analysis, or measurement in a transformed domain. Generally, the features are estimated from co-occurrence matrices [10].
Gray Level Co-occurrence Matrix (GLCM) is a matrix of frequencies at which two pixels, separated by a certain vector, occur in the image. The distribution in the matrix will be depending on the angular and distance relationship between pixels. By varying the separation vector it allows to capture different texture characteristics. After making the GLCM symmetrical, there is still one step to take before texture measures can be calculated [11].
For each GLCM matrix, compute the statistical features Energy (Angular second moment), Entropy (ENT), Correlation (COR), and Contrast (CON) as follows:
Energy: (Angular Second Moment (ASM))
ASM = P2 (i, j) ……… (3.1)
Where P (i,j) is probability density. Energy measures textural uniformity (i.e. pixel pair repetitions).
Contrast (CON):
CON = (i- j)2 P(i, j) ………..(3.2) Contrast indicates the variance of the gray level.
Entropy (ENT)
Correlation: (COR)
COR =
………….. (3.4)
Where μx, μy, σx, σy are the means and standard deviations of Px and Py respectively. Px is the sum of each row in occurrence matrix, Py is the sum of each column in the co-occurrence matrix[4].
3.2 Feature extraction using Discrete
Wavelet Transform (DWT):
Wavelets are functions generated from one single function W by dilations and translations. The basic idea of the wavelet transform is to represent any arbitrary function as superposition of wavelets. Any such superposition decomposes the given function into different scale levels where each level is further decomposed with a resolution adapted to that level. The discrete wavelet transform (DWT) is identical to a hierarchical sub band system where the sub-bands are logarithmically spaced in frequency and represents octave-band decomposition [12].
4. EXPERIMENT AND ANALYSIS
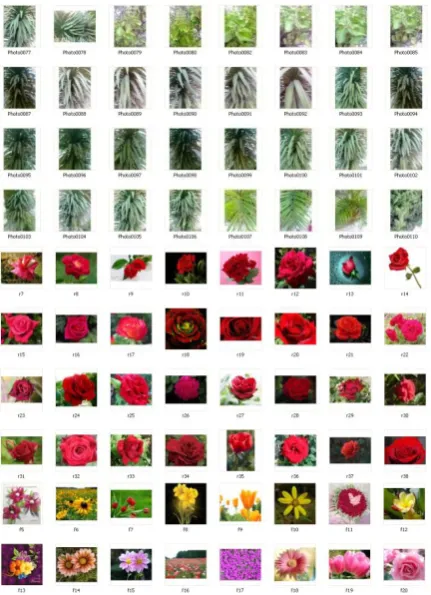
In this paper, the images that are similar to the query image of the plant as shown below is retrieved from the set of images. There is a set of 500 images including the HSV, YIQ and dithered images from which the query image is retrieved successively.
There is a set of image database given below through which the images which are similar to the query image are retrieved:
Fig. 5 Data base of different set of images.
Firstly, the RGB, HSV, YIQ and Dithered set of images are computed through GLCM computational matrix, and the following results are obtained:
4.1 RESULTS FROM GLCM
COMPUTATION TECHNIQUE
In GLCM computations, the parameters energy, contrast, entropy, correlation, mean and standard deviation are calculated from the original image. Means without any decomposition, the parameters of the image are considered.
[image:3.595.320.535.84.202.2]4.1.1 For RGB images:
Table 1 GLCM parameters for RGB image
Name of image
Contras t
Correlatio n
Homogeneit y
Entrop y
Query image(7 8)
0.0866 0.9815 0.9598 7.5052
[image:3.595.57.273.465.763.2]95 0.0889 0.9748 0.9571 7.3597 96 0.0831 0.9760 0.9595 7.3081 100 0.0817 0.9810 0.9609 7.5685 101 0.0821 0.9847 0.9602 7.5824 105 0.0855 0.9831 0.9591 7.6061 108 0.0896 0.9681 0.9590 7.6283 109 0.0861 0.9791 0.9572 7.5438 99 0.0875 0.9781 0.9589 7.4640
Fig. 6 Retrieved RGB images using GLCM
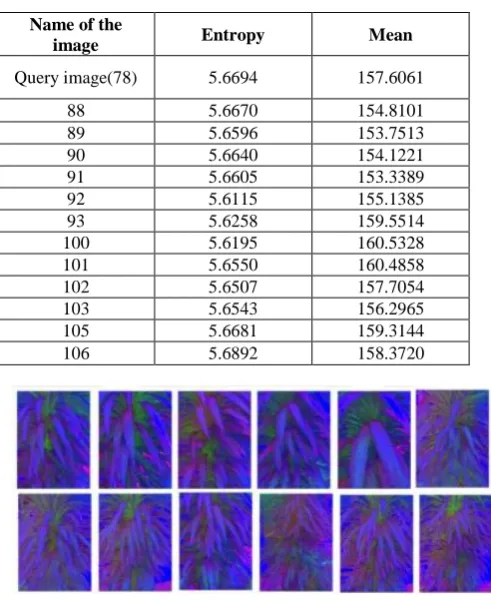
4.1.2 For HSV images:
Table 2. GLCM parameters for HSV image
Name of the
image Entropy Mean
Query image(78) 5.6694 157.6061
88 5.6670 154.8101
89 5.6596 153.7513
90 5.6640 154.1221
91 5.6605 153.3389
92 5.6115 155.1385
93 5.6258 159.5514
100 5.6195 160.5328
101 5.6550 160.4858
102 5.6507 157.7054
103 5.6543 156.2965
105 5.6681 159.3144
106 5.6892 158.3720
Fig7. Retrieved HSV images using GLCM
All the above images are similar to the query image that are retrieved on the basis of entropy and mean. This shows that HSV images can be easily retrieved through GLCM computation technique. The similar HSV images are having similar entropy and mean values on the basis of which these can be extracted. From the accuracy point of view, the HSV retrieved images are having 100% accuracy to retrieve the correct images from the database available.
[image:4.595.311.546.361.554.2]4.1.3 For Dithered Images:
Table 3. GLCM parameters for Dithered image
Name of the image
Correlati
on Energy
Homoge
neity Entropy
Query
Image 0.9718 0.3887 0.9324 4.1460 Deth_8 0.9717 0.3841 0.9268 4.1186 Deth_9 0.9746 0.3878 0.9404 4.1766 Deth_14 0.9738 0.3703 0.9164 4.0716 Deth_15 0.9765 0.3878 0.9326 4.0887 Deth_17 0.9770 0.3804 0.9289 4.0619 Deth_20 0.9709 0.3999 0.9368 4.1460 Deth_21 0.9759 0.3892 0.9417 4.1155 Deth_23 0.9755 0.3819 0.9385 4.2076 Deth_24 0.9742 0.3849 0.9372 4.1755 Deth_35 0.9748 0.3899 0.9367 4.1397
Fig8. Retrieved Dithered images using GLCM
All the 10 retrieved dithered images from the available data base are similar to the query image and these are retrieved on the basis of all the GLCM parameters. The accuracy of retrieval images is 100%. Dithered images are having less RGB color components. So, the images are retrieved correctly.
4.1.4 For YIQ images:
Table 4. GLCM parameters for YIQ image
Name of the image Correlation Co-efficient
Query Image 0.9926
87 0.9920
91 0.9920
93 0.9926
94 0.9923
100 0.9921
105 0.9922
107 0.9921
Fig.9 Retrieved YIQ images using GLCM
The above images are retrieved YIQ images using GLCM. Out of 7 images retrieved, 6 are the correct one and the seventh one is of different plant. Thus the accuracy of the correct image retrieval is 86%. The shape of the 7th image is similar to the query image that is why it is retrieved as that of the correct one.
4.2 RESULTS FROM WAVELET
DECOMPOSITION TECHNIQUE
[image:4.595.49.288.593.759.2]transformation performs single-level two-dimensional wavelet decomposition with respect to either a particular wavelet (Haar). It computes the approximation coefficients matrix cA and details coefficients matrices cH, cV, and cD (horizontal, vertical, and diagonal, respectively), obtained by wavelet decomposition of the given matrix.
[image:5.595.310.555.67.364.2]4.2.1 For RGB images:
Table 5. Wavelet parameters for RGB image
Name of the image Vertical Component
Query Image 1.3917
80 1.3908
87 1.3949
89 1.3934
91 1.3902
94 1.3941
97 1.3938
98 1.3980
99 1.3903
100 1.3927
Fig.10 Retrieved RGB images using Wavelet Decomposition
The RGB images are retrieved using Wavelet Decomposition and is shown above. From the above result, it can be seen that the RGB images can be retrieved on the basis of vertical component of wavelet transformed images. Out of the 9 images retrieved, 8 are correct one. The very first image is different from the query image. Thus, the accuracy of correct image retrieval is 89%.
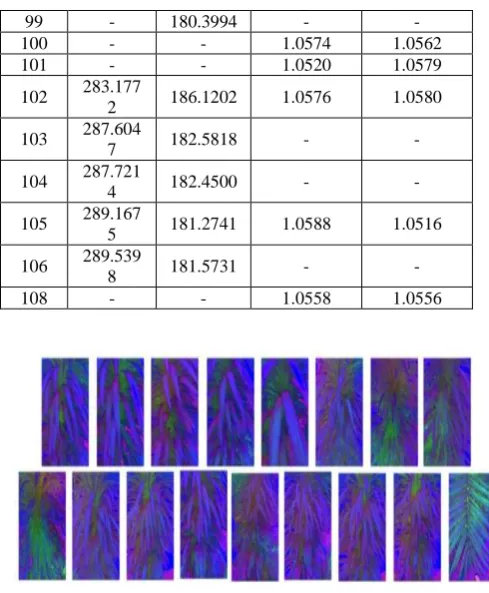
4.2.2 For HSV images:
Table 6. Wavelet parameters for HSV image
Name of the imag
e
Mean
Standard Deviatio
n
Horizontal Componen
t
Vertical Componen
t
Query Image
288.889
5 181.4355 1.0579 1.0596
88 281.536
5 187.3006 - 1.0557
89 - 189.3897 1.0595 1.0517
90 281.853
5 187.2095 - 1.0535
91 - - 1.0583 -
92 281.605
6 187.7221 - 1.0587
93 - - 1.0532 1.0514
95 287.206
9 182.6033 - -
97 289.206
9 181.3430 - -
99 - 180.3994 - -
100 - - 1.0574 1.0562
101 - - 1.0520 1.0579
102 283.177
2 186.1202 1.0576 1.0580
103 287.604
7 182.5818 - -
104 287.721
4 182.4500 - -
105 289.167
5 181.2741 1.0588 1.0516
106 289.539
8 181.5731 - -
108 - - 1.0558 1.0556
Fig.11 Retrieved HSV images using Wavelet Decomposition
Through Wavelet Decomposition, the above similar images are retrieved on the basis of mean, standard deviation, horizontal and vertical component of the decomposed image. It can be seen that all retrieved images are similar to the query image.
RGB is an m-by-n-by-3 image array whose three planes contain the red, green, and blue components for the image. HSV is returned as an m-by-n-by-3 image array whose three planes contain the hue, saturation, and value components for the image.
From the retrieval, the number of retrieved images is 17, and the correct one is 16. The last image also looks like the query image but in actual case it is different. So accuracy of correct retrieval is 94%. It can be seen that out of the data base available, the number of similar images retrieved through HSV images is maximum.
4.2.3 For dithered Images:
Table 7. Wavelet parameters for Dithered image
Name of the image
Standard Deviation
Horizontal Component
Query Image 127.5445 0.7987
6 124.6003 0.7975
7 - 0.7917
10 125.2246 -
13 125.7092 -
16 - 0.7937
17 - 0.7925
18 - 0.7983
[image:5.595.49.288.197.396.2]20 128.7653 -
21 120.3331 -
24 125.9096 -
32 - 0.7942
33 - 0.7958
[image:6.595.51.289.70.285.2]35 124.5738 0.7940
Fig.12 Retrieved Dithered images using Wavelet Decomposition
Out of the images in the data base, the above are retrieved after wavelet decomposition of dithered images. These are extracted on the basis of standard deviation and horizontal component of wavelet transform.
Here from the 14 retrieved images, 12 are the correct and are other two are different. The accuracy of correct image retrieval is 86%.
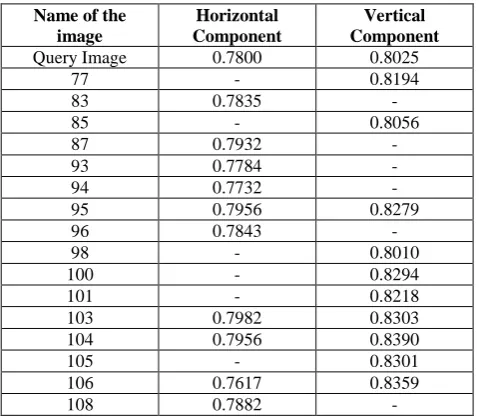
[image:6.595.317.549.72.187.2]4.2.4 For YIQ images:
Table 8. Wavelet parameters for YIQ image
Name of the image
Horizontal Component
Vertical Component
Query Image 0.7800 0.8025
77 - 0.8194
83 0.7835 -
85 - 0.8056
87 0.7932 -
93 0.7784 -
94 0.7732 -
95 0.7956 0.8279
96 0.7843 -
98 - 0.8010
100 - 0.8294
101 - 0.8218
103 0.7982 0.8303
104 0.7956 0.8390
105 - 0.8301
106 0.7617 0.8359
108 0.7882 -
[image:6.595.48.288.475.684.2]
Fig.13 Retrieved YIQ images using Wavelet Decomposition
From the above result of image retrieval, it can be seen that the YIQ images can easily retrieved on basis of horizontal and vertical component of wavelet transformed images. 15 images are retrieved, out of which 12 are the correct one. Hence the percentage accuracy of correct retrieval is 80%.
5. CONCLUSION
From the above results it can be concluded that dithered & HSV images can be more easily extracted than RGB and YIQ images when GLCM computations are used and HSV images can be easily extracted than RGB, YIQ and Dithered images when using Wavelet decomposition technique.
Through GLCM, Simple RGB and Dithered images can be extracted on the basis of contrast, correlation, homogeneity and energy; whereas HSV images can be extracted on the bases of entropy and mean, and YIQ images can be easily extracted on the basis of correlation co- efficient.
Through Wavelet decomposition, HSV images are extracted on the basis of mean, standard deviation, horizontal and vertical component; whereas RGB images are extracted on the basis of vertical component, YIQ images are extracted on the basis of horizontal and vertical component and Dithered images are extracted on the basis of standard deviation and horizontal component.
Hence, on combining the results of both techniques, it can be concluded that HSV images are giving the best results. As its accuracy for GLCM is 100% and for Wavelet transform, it is 94%.
In future, many other techniques can also be used to extract the features and finally comparative analysis can be done on the basis of these features.
6. REFERENCES
[1] Samia G. Omar, Mohamed A. Ismail and Sahar M. Ghanem, “WAY-LOOK4: A CBIR System Based on Class Signature of the Images’ Color and Texture Features”, Computer Systems and Applications, Vol. 14, No. 2, pp.464 - 471, Aug. 2009.
[2] Ryszard S. Chora´s, “Image Feature Extraction Techniques and Their Applications for CBIR and Biometrics Systems”, BIOLOGY AND BIOMEDICAL ENGINEERING, Vol.1, pp. 6 – 16, 1, 2007.
[4] Dr. H.B.Kekre, Sudeep D. Thepade, Tanuja K. Sarode and Vashali Suryawanshi, “Image Retrieval using Texture Features extracted from GLCM, LBG and KPE”, International Journal of Computer Theory and Engineering, Vol. 2, No. 5, pp 695 – 700, October, 2010.
[5] Ramadass Sudhir, Lt. Dr. S. Santhosh Baboo, “An Efficient CBIR Technique with YUV Color Space and Texture Features”, Computer Engineering and Intelligent Systems, Vol 2, No.6, pp 78 – 85, 2011.
[6] Teinwei Tsai, Yo- ping Huang, Te- Wei Chiang, “Image Retrieval Based on Dominant Texture Features”, IEEE ISIE, pp 441- 446, July 9-12, 2006.
[7] Primitives of Color Moments, ‘Color Image Retrieval Based on Primitives of Color Moments’, vision, image and signal processing, IEE proceedings, vol. 149, issue:6, pp 370-376, December,2002
[8] Peichung shih, Chengjun liu, ‘Comparative Assessment of Content-Based Face Image Retrieval in Different
Color Spaces’, International Journal of Pattern Recognition and Artificial Intelligence, pp 1039 – 1048, 2005
[9] Bart M. ter Haar Romeny, “Dither Removal”, The Mathematica Journal,Vol. 10, pp 432-441, 2006.
[10] B.V. Ramana Reddy, A. Suresh, M. Radhika Mani, and V.Vijaya Kumar, “Classification of Textures Based on Features Extracted from Pre-processing Images on Random Windows”, International Journal of Advanced Science and Technology, Volume 9, pp 9 – 18, August, 2009.
[11] P. Gangadhara Reddy1, “Extraction of Image Features for an Effective CBIR System”, IEEE, pp.138 -142, 2010.