Detection of Exudative Maculopathy from Retinal
Fundus Images
Sreedevi K S
Hema P Menon
Department of CSE Department of CSE
Amrita Vishwa Vidhyapeetham Amrita Vishwa Vidhyapeetham Coimbatore, Tamil Nadu – 641 112, India Coimbatore, Tamil Nadu – 641 112, India
ABSTRACT
Diabetic retinopathy is a group of eye problems caused due to diabetes. Longer time a person has diabetes; the higher is his or her chances of developing diabetic retinopathy. One of the stages of diabetic retinopathy is Exudative Maculopathy. Spontaneous progression and regression of exudates causes Exudative Maculopathy.This work focuses on extraction of exudates from retinal fundus images using image processing techniques.
Keywords
Exudative Maculopathy,Local Contrast Enhancement, Fuzzy C Means Clustering,Artificial Neural Network
1.
INTRODUCTION
Diabetic retinopathy refers to a group of eye problems that people with diabetes may face as a complication. Worldwide, it is a leading cause of blindness among population. Retina is an important part of the eye and vascular changes caused due to diabetes, which is a blood related phenomenon, can lead to partial or total blindness, if it is not detected early. The macula is the central area of the retina, where the images are focused, and enabling one to recognize objects and colors and to read and write. In Exudative maculopathy, anomalous vessels appear that secretes out serum or bleed, leading to formation of scars. Exudative maculopathy can be blocked by laser treatment. It is more common in type 2 diabetes (Adult Onset). It will be useful for doctors if an automated method is available for identifying the exudates at early stage or during progression. This can be achieved by using different image processing techniques for detecting the presence of Exudative maculopathy by extracting the exudates from the retinal fundus image.
This paper is organized as follows: section 2 focuses on literature survey for exudates extraction. Section 3 consists of implementation details which comprises of dataset details, system design, preprocessing, extraction of exudates(level 1) and classification using artificial neural networks (level 2). Section 4 consists of results and analysis. Section 5 gives conclusion and summary.
[image:1.595.87.232.632.723.2]Fig 1: Sample retinal image showing Exudates
2. LITERATURE SURVEY
using fixed thresholding.But candidates are not proper representation of these red lesions. So a simple region growing method is applied. Then various stages of abnormalities are classified based on features like standard deviation, entropy, mean etc Adaptive Neuro Fuzzy Inference System(ANFIS).ANFIS classifies the image into normal,mild, severe depending on their severity.Kande et al [11] use two approaches for exudates and optic disk. The centre of optic disk was estimated by finding a point that has maximum local variance. The color morphology in Lab space was used to have homogeneous optic disk region. Optic disk boundary is located using geometric active contour with variational formulation. Preprocessing, Optic disk elimination and Segmentation are done for extracting exudates .The enhanced segments are extracted based on Spatially Weighted Fuzzy c-Means clustering algorithm.
A local contrast enhancement technique invented by Sinthanayothin does not depend on global statistics of the image. It is applied to local areas depending on its mean and variance.This method gave more contrast compared to global contrast enhancement as well as other enhancement techniques. Fuzzy C-Means clustering gave better result than K-Means Clustering.
3. IMPLEMENTATION DETAILS
3.1 Dataset details
The dataset consists of 25 retinal fundus images. The training dataset consists of both normal images and images with Exudative Maculopathy. Here all images considered are of type JPEG.
3.2 System Design
Fig2: General architecture
3.3Preprocessing
Retinal fundus image of the affected eye is taken as the input. In the preprocessing stage the RGB color channel is converted to HSI Color Space. Then a local contrast enhancement method is applied to improve the contrast of the exudates in image. This method is applied on the intensity channel of the fundus image. Here a transformation is applied in small windows of the image such that all intensity values are distributed around the mean and standard deviation.A Sigmoid function
S
W(
p
)
is applied in the filtering function: 1)]
exp(
1
[
)
(
W W Wp
p
S
Here
W and
W gives the mean and standard deviation within each window. For each pixel p in the original image and a running window W then the image is filtered using the filtering function to produce a new image I:]
)
(
)
(
)
(
)
(
[
255
]
,
[
Min
S
Max
S
Min
S
p
S
j
i
I
W W W W
Min and Max are minimum and maximum intensity values of the whole retinal image.
3.4Extraction of exudates
3.4.1Level1-Extraction
The preprocessed image is then used for segmenting the exudates using Fuzzy C Means clustering. Fuzzy C-Means clustering gives better result for overlapped data set. In K-Means clustering data point must absolutely belong to one cluster center; in FCM data point is assigned membership to each cluster center as a result of which data point may belong to more than one cluster major.
The FCM algorithm used is given below:
1. Initialize
V
[
v
ij]
matrix,V
(0)2. at k-step: calculate the centre vectors
C
(k)
[
c
j]
withV
(k),
N k m ij j N i m ij jv
x
v
C
1 13. Update
V
(k),
V
(k1)
c k m k j j j ijc
x
c
x
v
1 1 2)
(
1
4. If
V
(k1)
V
(k)
then stop, otherwise return to step 2.Here exudates and optic disk are extracted.
3.4.2 Level 2-Classification of exudates using
Artificial Neural networks
architecture was used.The teaching algorithm used is multilayer perceptron. The general steps are:
a. The structure of network is first created where activation functions are chosen and network parameters, biases and weights are initialized.
b. Parameters for training algorithm like error goal, maximum number of epochs are defined.
c. The training algorithm is called.
d. After neural network has been determined, result is first tested by simulating the output of the neural network with the measured input data which is then compared with the measured outputs. Final validation must be carried out with independent data. The number of nodes in the first hidden layer was five and 1 is the number of nodes in the output layer.
Measured input data used are mean, energy, entropy, standard deviation and covariance.
i) Mean: average intensity
1 0)
(
L
i
i i
p
z
z
m
ii) Energy: is calculated by summing absolute values in a local neighborhood:
mi n
j
e
c
i
j
L
1 1
)
,
(
iii) Entropy: Entropy is a measure of information content. It calculates the randomness of intensity distribution. Entropy is highest when all entries in P [i, j] are of similar magnitude, and small when the entries in P [i, j] are unequal.
iv)Standard Deviation: Shows how spread out intensities are.
v) Covariance: sum of difference between intensity of the central pixel and its neighborhood.
4. RESULTS AND ANALYSIS
In this section we compare the results obtained for images containing exudates and non exudates. Fig 3 shows classification result using neural network for abnormal image. The preprocessed Fundus image is converted to HSI Color space. The intensity component alone is extracted. It is then applied to Fuzzy C-Means clustering algorithm. The result consists of three clusters. Since Optic Disc and Exudates are homogenous in color, cluster containing Optic Disk also gets selected for feature extraction. Based on the feature extracted, the neural network is trained for normal and abnormal images. Then image is classified as exudates or non-exudates using artificial neural network. The classifier is needed as along with the exudates the optic disk also gets detected. Hence further segregation of the optic disc and exudates is done using the classifier.
4.1 Results for Fundus image with Exudates
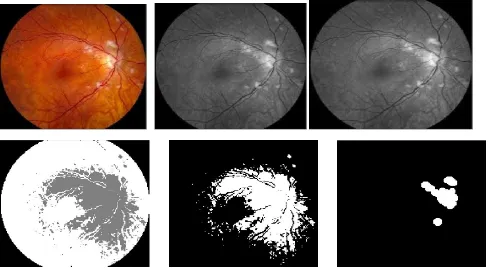
[image:3.595.55.545.451.721.2]4.2Results for Fundus images with
Exudates
[image:4.595.55.557.77.470.2]Fig 4: Classification result for normal image containing Exudates :(a)input image (b)intensity image (c)contrast enhanced image (d)fcm 2 clusters (e)exudates (f) optic disk
Tables 1 and 2 gives an average values obtained for some of the tested image samples,for the feature that are executed. The extracted features are mean, entropy, standard deviation, covariance, energy for four samples each from normal and abnormal images.
Table 1: Feature extraction for an abnormal image
Sample Mean Entropy Standard
Deviation
Covariance Energy
S1 41.4450 0.2085 23.9197 16.3467 8289
S2 34.9250 0.1936 21.6794 56.6883 20758
S3 50.2400 0.1955 23.9300 17.1277 6985
S4 48.9200 0.2085 31.3742 13.5714 10048
Table 2: Feature extraction for a normal image
Sample Mean Entropy Standard
Deviation
Covariance Energy
S1 5.3550 0.0204 5.0251 0.2309 1071
S3 16.970 0.0627 11.7113 1.6545 3374
S4 10.143 3
0.0421 8.9284 0.4566 2041
From the above two tables it can be clearly seen that statistical features like mean, entropy, standard deviation, covariance and energy of image containing exudates is much higher than that of the image without exudates. Thus using the statistical features we can then identify the abnormality in the image.
Fig 5: Graph showing the variation in statistical features for images containing exudates and normal image
5. CONCLUSION AND SUMMARY
In this paper the exudates that are present in human retinal fundus image was detected successfully using FCM and ANN classifier. The features like mean, standard deviation, entropy ,covariance and energy are used for the classification of exudates and non exudates. The analysis of the features extracted shows that the values obtained will be high for exudates and hence can be used as distinct feature for identification of the presence of exudates. This can be used for the detection of the various stages in the diabetic retinopathy fundus images. The algorithm can be further enhanced by using more features like texture and perceptual measures.
6. ACKNOLOWLEDGEMENT
We thank the doctors of Giridhar Eye Institute for their continual support and suggestions throughout the execution of this work.
7.
REFERENCES
[1] Akara Sopharak , Bunyarit Uyyanonvara, Sarah Barman, Thomas H Williamson. 2008.”Automatic detection of diabetic retinopathy exudates from non-dilated retinal images using mathematical morphology methods”, Elsevier, Computerized Medical Imaging and Graphics 32 (2008),pp 720–727.
[2] V Vijaya Kumari, N SuriyaNarayanan. 2010. ”Diabetic Retinopathy-Early Detection Using Image Processing Techniques”; (IJCSE) International Journal on Computer Science and Engineering Vol. 02, No. 02, 2010, 357-361. [3] Osareh, A., Mirmehdi, M. Thomas, B. , Markham, R. 2010, ” Automatic recognition of exudative maculopathy using fuzzy c- means clustering and neural networks”, In Medical Image Understanding Analysis, Claridge, E. ; Bamber ,J. , editors. BMVA Press, pp. 49–52.
[4] G S Annie Grace Vimala,, Dr.Kaja Mohideen. 2012, ”An
Efficient Approach for Detection of Exudates in
Diabetic Retinopathy Images Using Clustering
Algorithm” , IOSR Journal of Computer Engineering
(IOSRJCE) ,ISSN: 2278-0661 Volume 2, Issue 5, pp 43-48.
[5] C. Sinthanayothin, 2000, “Image analysis for automatic diagnosis of Diabetic Retinopathy”, World Congress on Information and Communication Technologies, pp. 522-532 .
[6] Maria Garciaa, Clara I sancheza, maria I Llopez, daniel Abasoloa, Roberto Horneroa,2008, “A novel automatic image processing algorithm for detection of hard exudates based on retinal image analysis”, Medical Engineering and Physics, Volume 30,issue 3,pp350-357. [7] Leistritz, Lutz; Schweitzer, Dietrich, “Automated
Detection and quantification of exudates in retinal images’, Proc. SPIE Vol.2298, Applications of Digital Image Processing, pp 690-696.
[8] Niemeijer.M, Abramoff.M.D, Van Ginneken.B, 2007, “Information fusion for Diabetic Retinopathy CAD in Digital color fundus photographs”, IEEE Transactions on medical imaging, vo7l. 26, no. 10, pp. 1357-1365. [9] T. Walter, J. Klein, P. Massin, and A. Erginary, 2002, ”A
contribution of image processing to the diagnosis of diabetic retinopathy”,detection of exudates in colour fundus images of the human retina‖. IEEE Trans. Medical. Imaging,Vol. 21, No. 10, pp.1236–1243. [10] T Yamuna,S Maheshwari, 2013,” Detection of
abnormalities in retinal images”;IEEE,2013 International conference on emerging trends in computing, communication and nanotechnology;pp.236-240. [11] Giri Babu Kande, P. Venkata Subbaiah, T. Satya
[image:5.595.55.284.258.494.2]