http://dx.doi.org/10.4236/ajps.2015.612197
Evaluation and Selection of High Biomass
Rice (
Oryza sativa L.
) for Drought Tolerance
Aditi Kondhia, Rodante Escleto Tabien, Amir Ibrahim
Texas A&M AgriLife Research and Extension, Texas A&M University, Beaumont, USA Email: kondhia.aditi@gmail.com
Received 5 June 2015; accepted 18 August 2015; published 21 August 2015
Copyright © 2015 by authors and Scientific Research Publishing Inc.
This work is licensed under the Creative Commons Attribution International License (CC BY). http://creativecommons.org/licenses/by/4.0/
Abstract
Biomass production is important in increasing yield not only for food but also for bio-fuel produc-tion that depends on high dry matter. Due to climate change, occurrence of drought may be preva-lent and this affects both grain and biomass yields in crops including rice. The objectives of this study were to determine the performance of selected high biomass breeding rice lines to different levels of drought and use several drought tolerance indices to identify best genotypes that could be grown in unfavorable water stressed areas. A rainfed and flooded trial was conducted to evaluate 20 selected breeding lines for biomass production and ten entries from the same set were grown in the greenhouse at three different field capacities (FC, 50%, 75%, 100%). Most of the genotypes performed well under non-stressed conditions (flooded and 100% FC) but some genotypes per-formed well in water stressed condition. The plants had lower plant height, tiller plant−1, and total biomass at maturity under rainfed conditions and their flowering was delayed compared to flooded conditions. In the greenhouse, water stress slowed the rate of increase in height, and pro-duced lower shoot and root weight, percent dry matter (% DM) and total biomass. However, drought enhanced the rate of tiller production. Two genotypes were found to more tolerant to drought stress and could be used for cultivation under water stress condition to get optimum biomass yields. These genotypes can be identified using drought tolerance indices, particularly stress tolerance index (STI), geometric mean productivity (GMP), mean productivity (MP) and harmonic mean (HARM), as these have a similar ability to separate drought sensitive and tolerant genotypes. Genetic and molecular analyses, and detailed characterization of these genotypes will help understand their inheritance pattern and the number of genes controlling the traits and de-termine specific leaves and root traits important in developing high biomass rice.
Keywords
1. Introduction
Rice (Oryza sativa) is the staple food for a large part of the world’s human population, which is the most con-sumed cereal after wheat. Javanica known also as “tropical japonica” [1] (Mae, 1997) is the type of rice com-monly grown in the U.S. Rice has been grown in several states in the U.S., but currently large rice areas can be found in six states including Arkansas, California, Louisiana, Mississippi, Missouri and Texas. Long and me-dium grain rice is the major grain type but none is grown mainly for fodder or biomass.
Different environments have different effects on the production of rice grain and biomass. Rice which is grown in humid tropics in rainfed (dry land) areas covers 19% of the total rice production areas and the 15 mil-lion hectares of rain dependent rice fields contribute about 4% of total world rice production [2] (GRiSP, 2013). These areas generally suffer from drought but may also have acidity of soil and deficiency of phosphorus and zinc. Drought is one of the most important limiting factors in the production of the major crops in the world and affects 20% of the total rice-growing area in Asia [3] (Pandey and Bhandari, 2008). The percentage of drought affected land areas has doubled from 1970 to the early 2000 [4] (NCAR-UCAR, 2005). Furthermore, the global warming increases the occurrence of drought [5] (Farooq et al., 2009) and that in turn results in global water shortage. Improving drought tolerance of crops along with water management will have an impact on production
[6] (Long and Ort, 2010). Drought causes yellowing of leaves, reduces number of tillers, height of plant, number of panicles and overall vegetative weight and increases number of unfilled grains. It has been shown that there are more productive tillers plant−1 under flooded than non-flooded (rainfed) conditions [7] (Chaudhry and McLean,
1963). The current drought resistance levels and those needed for rice grain yield stability are significantly dif-ferent as rice is very sensitive to water scarcity [8] (Xiao et al., 2007).
The rise in concerns about the environment and price of volatile oils has diverted the attention of the world to using alternative energy resources [9] (Lim et al., 2012). One of the most important sources for renewable ener-gy is crop biomass [10] (Kirubakaran et al., 2009) or agricultural biomass like rice husk, straw and bagasse and it has received attention as it does not threaten the food supply (Lim et al., 2012). One third of the primary energy sources after coal and oil are biomass [11] (Werther et al., 2000). Rice is a potential source of feedstock for bio-refinery since it can produce a lot of biomass; however, it should not compete for the areas which are favor-able for grain production. There are many unfavorfavor-able areas for rice production that can be tapped for high bio-mass production. Hence, our goal is to study the response of high biobio-mass rice grown under stress conditions so that adapted genotypes can be grown in unfavorable environments for biomass and grain production. The main impact of this study is the generation of base information on high biomass rice genotypes which is important for the future bioenergy related research activities. The evaluation of agronomic traits will be useful in crop im-provement and in basic research to understand their relationship with high biomass production. It will help us understand the science needed to achieve high stable biomass yields under unfavorable environments.
One of the objectives of this study was to determine the response of selected high biomass rice genotypes to drought and rainfed growing condition. Specifically, the study aimed to determine growth and biomass yield of selected O. sativa lines under two levels of drought and their agronomic response in rainfed and flooded condi-tions. Six selection indices were used to identify best genotypes that could be grown in unfavorable areas. Drought tolerance indices provide a measure of drought based on yield loss under drought conditions as compared to normal conditions and hence they are used to screen drought tolerant genotypes [12] (Nazari and Pakniyat, 2010).
2. Materials and Methods
2.1. Source of Test Entries
The materials for evaluation were obtained from high biomass rice project of Texas A&M AgriLife Research and Extension Center, Beaumont, Texas which was aimed to identify high biomass rice as alternative source of feedstock for bioenergy generation. These breeding lines were generally late maturing, with large tiller or with many tillers, leafy and taller than conventional rice. These were derived from breeding populations developed for breeding high grain yield thus these were undesirable for high grain yield but has potential for high biomass production.
with equal amount of soil arranged in a completely randomized design with three replications. Equal amount of water was used until germination. At 20 days after sowing (DAS), thinning to one plant was done and the fol-lowing treatments were used; 50%, 75% and 100% FC. These water levels were maintained throughout the ex-periment by weighing the pots every other day while the evaporated water was compensated by adding extra water. One extra pot without plant for 75% and 50% FC was maintained and the water evaporated from those pots was used to add water in the experimental pots at the same FC. Nitrogen fertilizer was applied in two splits; first at planting at the rate of 57 kg∙ha−1 and second at tillering at the rate of 91.2 kg∙ha−1. The final data gathering
was done 85 DAS.
The data collected were the days to first tiller emergence, weekly tiller count, weekly increase in plant height, shoot fresh weight (FW) and dry weight (DW), root FW and DW, total fresh and dry biomass. Tiller emergence was the day when the first tiller with one fully expanded leaf appeared at the base of the plant. Tiller count was gathered by counting the tillers including the newly emerged tillers with one fully expanded leaf while plant height was gathered by measuring the length of the plant from soil surface to the tip of the longest leaf. The shoot and root weights were collected by weighing the upper part of the plant and root including the node where the upper most roots originated after carefully removing soil at the end of the experiment (85 DAS). These sam-ples were air dried for 30 days to obtain the shoot and root dry weights. Rate of tiller production, rate of leaf production and rate of increase in plant height were computed by finding the slope of number of tillers and leaves, and plant height at weekly intervals.
2.3. Response of Selected High Biomass Rice to Rainfed and Flooded Conditions
This experiment was conducted in the field of Texas A&M AgriLife Research and Extension Center at Beau-mont, Texas (30.06˚N, 94.29˚W). Twenty selected high biomass rice genotypes were field planted to evaluate their biomass production in rainfed and flooded environment. Ten of these were included in the pot experiment on field capacity. The soil for direct seeding was prepared using disc harrow and rotavator to pulverize the soil, and was laser leveled. Before planting, levees were made to facilitate water control. Urea was applied in three splits; 57 kg∙ha−1 at planting, 91 kg∙ha−1 at flooding and at panicle differentiation at the rate of 80 kg∙ha−1. The
P2O5 fertilizer was applied at planting at the rate of 34 kg∙ha−1. A split-plot design with two replications was used,
with the flooded and rainfed environments as the main plot, and high biomass rice genotype as sub-plot. Each sub-plot had three rows that were 3 m long and 25 cm apart. Seeds were sown using a planter at the rate of 2 - 3 grams row−1. The flooded treatment had permanent flood starting from 30 days after seedling emergence while
rainfed treatment was flush flooded when rain water was not enough to avoid severe soil cracking and wilting of the plants. In most cases, flushing of irrigation water was done when high noon leaf rolling was observed in some of the test entries. The rainfall received during emergence to harvest was 11.57 inches.
The data collected were average height, tillers plant−1 at 105 DAS, days to 50% heading and total fresh
bio-mass yield (kg∙ha−1) at maturity. The plant height at maturity was measured from the soil level to the tip of the
tallest panicle. The number of tillers plant−1 at 105 DAS was computed by dividing the total number of tillers/
750 cm2 by number of plants/750 cm2. Flowering date was gathered when 50% of the panicles of plants in a plot
had opened florets. The total fresh weight of above ground biomass of all the plants in a plot at maturity was ga-thered along with the date at which the crop was harvested.
2.4. Statistical Analysis
All the data gathered were statistically analyzed using analysis of variance (ANOVA; SAS software). The means were separated using Duncan’s t test at an alpha level of 0.05.
2.5. Screening Methods (Drought Tolerance Indices) Drought tolerance indices were calculated using the following equations:
Drought Tolerance Indices Formulae References
Stress Tolerance Index (STI) (Y YP× S)
( )
yp [13] (Fernandez, 1992)Tolerance Index (TOL) Y YP− S [14] (Rosielle and Hamblin, 1981)
Continued
Mean Productivity (Y YP+ S) 2 [14] (Rosielle and Hamblin, 1981)
Stress Susceptibility Index (SSI) (Y YP S)
(
1−(
Y YP S)
)
[13] (Fernandez, 1992)Harmonic Mean (HARM) 2(Y YP× S) (Y YP+ S) [15] (Fischer and Maurer, 1978)
where Ys and Yp are yield under stress and non-stress yield of a given genotype, respectively.
Ys and Yp are average yields of all genotypes under stress and non-stress conditions, respectively.
3. Results and Discussion
3.1. Experiment 1: Response of Selected High Biomass Rice to Different Percentages of Field Capacity
The analysis of variance showed that the differences in the number of days to first tiller, rates at which tillers were produced, shoot and root fresh and dry weight as well as the total fresh and dry biomass in three levels of FC and in genotypes was significantly different. The variations in plant heights at 43 DAS and 85 DAS and the rates of height increase in three levels of FCs and 10 genotypes, however, were highly significant. The number of tillers at 43 and 85 DAS varied significantly among genotypes but it varied only with FC at 43 DAS but not at 85 DAS. The interaction of genotype x FC for these parameters was non-significant except for the plant height at 85 DAS.
The genotypes grown at 100% FC had significantly faster tiller emergence and the rate of increase in plant height than those grown at 75% and 50% FC but plant grown at 50% FC had fastest rate of tiller production (Table 1). The fresh and dry weights of shoot, root and total biomass were always significantly higher at 100% FC than those obtained in 50% and 75% FC. Percent dry matter, however, was significantly higher at 75% than both 50% and 100% FC. Relative to 100% FC, 50% less available water reduced both FW and DW of shoot by 64%, 75% for root FW, 70% for root DW, and 65% for both FW and DW of total biomass. The 25% reduction of available water caused 33% reduction in shoot FW, 28% in shoot DW, 13% in root FW, 16% in root DW, 35% in total biomass FW and 26% total biomass DW. Sixteen percent and 5% more dry biomass were obtained in 75% and 50% FC, respectively compared to plants at 100% FC indicating plant succulence in fully saturated soil. These results further suggest that a full field capacity is not needed to produce high dry biomass for high biomass rice and severe drought (50% FC) may not severely affect dry biomass production. The increase dry biomass at 50% FC could be attributed to faster tiller production, even though the total tiller number was reduced.
[image:4.595.89.538.630.706.2]Among the ten genotypes studied, genotype 12 had the lowest number of days to first tiller emergence (early tiller production) but it was statistically comparable to genotype 10 and 11 (Table 2). The early tillering ability of genotype 11 may have originated from the parent ‘Zhe 733’ which is known to produce tillers earlier than-conventional U.S. rice varieties [16] (Tabien et al., 2005). Genotype 11 also had the fastest rate of tiller produc-tion that was comparable to genotype 12 and fastest rate of increase in plant height. The shoot FW and DW was highest in genotype 12 having 40% and 71.06 % increases, respectively when compared to Banks. The root FW and DW was highest in genotype 11 showing 37.9% and 43% increase compared to Banks, respectively. How-ever the total fresh (43.71 g) and dry (11.94 g) biomass is highest in genotype 12 having 34% and 64% increase
Table 1.Means of days to first tiller emergence, rate of tiller production, rate of increase in plant height, shoot and root fresh and dry weights, total fresh and dry biomass and % dry matter in three percentages of field capacity across ten genotypes in Beaumont, Texas.
% Field
capacity Days to first tiller emergence Rate of tiller production Rate of increase in plant height Shoot weight (g) Root weight (g) Total biomass (g) % Dry Fresh Dry Fresh Dry Fresh Dry matter
50 45.59a 0.1117a 0.3044a 15.01c 3.99c 2.08c 0.44c 17.08c 4.44c 26.52b
75 41.32b 0.0785b 0.4518a 27.37b 7.94b 5.05b 1.25b 32.41b 9.19b 29.27a
Table 2.Means of the days to first tiller emergence, rate of tiller production, rate of increase in plant height, shoot and root fresh and dry weights, total fresh and dry biomass and % dry matter across drought levels of nine high biomass rice and cul-tivar Banks at Beaumont, Texas.
Genotypes tiller emergence Days to first Rate of tiller production increase in Rate of plant height
Shoot weight (g) Root weight (g) Total biomass (g) % Dry matter
Fresh Dry Fresh Dry Fresh Dry
4 42.56abc 0.0408e 0.3160b 24.77c 6.27d 5.67abc 1.02abcd 30.44bcd 7.28d 24.17cd 5 42.88abc 0.0605de 0.3721b 24.06c 7.28bcd 4.45bc 0.95bcd 28.51cd 8.23bcd 28.89ab 6 41.33bc 0.0419e 0.3704b 31.71ab 8.58bc 5.26abc 1.19abc 36.97abc 9.78abc 26.27bcd 7 40.67cd 0.0941cd 0.3894b 24.23c 6.94cd 5.11bc 0.94bcd 29.33cd 7.88cd 26.83bcd 10 38.89cde 0.1247bc 0.3653b 33.66ab 9.25ab 5.63abc 1.31a 39.29ab 10.56ab 26.56bcd 11 36.89de 0.1757a 0.6216a 33.99a 8.32bcd 7.74a 1.46a 41.73a 9.78abc 23.52d 12 36.11e 0.1439ab 0.2942b 37.80a 10.64a 5.91ab 1.30ab 43.71a 11.94a 27.43abc 14 42.00abc 0.0623de 0.4569b 21.72c 6.34d 3.14c 0.80cd 24.86d 7.14d 30.60a 16 45.22ab 0.0674de 0.4240b 21.99c 6.54d 3.18c 0.66d 24.18d 7.20d 31.09a Banks 46.14a 0.0553de 0.4398b 26.83bc 6.22d 5.61abc 1.02abcd 32.44bcd 7.24d 23.12d Means in each column followed by the same letter are not significantly different at 5% level of significance.
when compared to the check. The % DM was highest in genotype 16 having 34.4% more than Banks and geno-type 11. Being best in all the parameters measured, genogeno-type 12 has the best potential for higher biomass pro-duction in any FCs. For high % DM, however, genotypes 5, 14 and 16 are the best together with genotype 12. Genotype 6, 10 and 11 showed similar pattern but all were included in the group with lower % DM.
The amount of available water affected the growth and development of the ten high biomass rice lines. The observed reduction in tiller production under stress could be due to limited assimilates produced from inhibited photosynthesis which is directly caused by drought [17] (Mostajeran and Rahimi-Eichi, 2009) while the signifi-cant differences in rate of increase in plant height can be due to differences in cell elongation, internode elonga-tion and number of nodes, the traits shown to be affected by drought and genotypes [18] (Guevarra and Chang, 1965). Furthermore, the reduction in available water or the increase in stress was shown to reduce the rate of growth of stems, thereby affecting plant height [19] (Bunnag and Pongthai, 2013). Several studies have shown that water stress can reduce shoot growth [20] [21] (Price et al., 2002; Suralta and Yamauchi, 2008). In drought stress, the reduction in shoot fresh and dry matter can be attributed to the reduction of leaf area and slow photo-synthesis rate [22] [23] (Sinaki et al., 2007; Zubaer et al., 2007). Like the shoot, root growth is also affected by limited water supply. Reference [21] reported that the nodal root production was reduced in drought condition and this influenced the formation of root biomass. In soils which are water stressed, there is reduced oxygen supply, physical barrier like hardpans and poor adaptation of roots to aerobic condition that limit exploitation of deeper soil layers hence reducing root biomass [24] (Samson and Wade, 1998). Similar to the root and shoot of the 10 genotypes, the total biomass was also affected by the amount of available water. The observed reduction in total biomass in water stressed condition might be attributed to low net photosynthesis and low nutrition asso-ciated oxidative damage to shoot tissues [25] (Zhang and Kirkham, 1996) in drought environment. Drought stress suppresses leaf expansion, tillering and midday photosynthesis [19] (Bunnag and Pongthai, 2013) that can lead to lower production of biomass.
Limited water availability can cause cascade of signals mediated by phytohormone ABA [26] (Christmann et al., 2007). Higher % DM at 75% FC could be due to mild stress signal that caused faster accumulation of pho-toassimilates [27] (Matsuo et al., 2007).
3.2. Experiment 2: Response of Selected High Biomass Rice to Rainfed and Flooded Conditions
to 50% heading but not for biomass yield (Table 3) indicating that some genotypes varies in heading, plant height and tiller count depending on the field condition. The tallest genotype was genotype 2 in flooded field and it was the shortest genotype in the rainfed condition. The mean height of genotypes at harvest across two envi-ronments ranged between 100.83 and 115.29 cm with a mean of 109.79 cm. The number of tillers plant−1 at 105
DAS in flooded was 16.13 and this was significantly higher than in rainfed with 13.18 tillers. The highest tillers plant−1 was from genotype 11 in flooded field and lowest from genotype 8 in flooded condition. Among the
ge-notypes across the two environments, the number of days to 50% heading ranged from 93 to 113 with a mean of 102.54 days. Genotype 18 and 10 flowered the earliest in flooded and rainfed condition, respectively.
Among the genotypes, there were significant differences for tiller plant−1 at 105 DAS, days to 50% heading
and biomass yield (kg∙ha−1) but not for plant height (Table 4). Average plant height ranged from 100.83 - 115.29
cm, and these are generally closer to the commercial rice varieties like Banks. Plant height could be critical to avoid lodging that may cause lower biomass harvest. Taller plant should have big tillers to minimize lodging. Number of tillers plant−1 at 105 DAS was highest in genotype 11 (22 tillers) and lowest in genotype 17 (9 tillers).
[image:6.595.88.540.313.708.2]The tillers count of genotype 11 was statistically comparable to other 10 genotypes while the low tiller count of genotype 17 was similar to the majority of the genotypes. Genotype 10 attained 50% heading fastest (93 days) and this was not significantly different to the heading of four other genotypes. Genotype 12 was last to
Table 3.Average height, tillers plant−1 at 105 Days after sowing (DAS), days to 50% heading and biomass yield (kg∙ha−1) of
selected high biomass rice lines and Banks in two environments in Beaumont, Texas.
Genotype
Average height (cm) Tillers plant−1 at 105 DAS Days to 50% heading Fresh biomass yield
(kg∙ha−1)
Environment Environment Environment Environment
Rainfed Flooded Rainfed Flooded Rainfed Flooded Rainfed Flooded
flower (113 days) and this heading was comparable to genotype 3, 5, 11 and 19. The highest fresh biomass yield was from genotype 11 (45,129.56 kg∙ha−1) followed by genotype 6 (37,284.24 kg∙ha−1) and these were not
sig-nificantly different from yields obtained from seven genotypes including Banks. The lowest biomass was ob-tained from genotype 18. Late heading produce more tiller and higher biomass. Genotypes having more tillers had higher biomass.
Evaluation of plant agronomic traits in stressed and non-stressed environment, can give an insight on how that genotype performs under stress. Previous studies have showed that plants grow taller in flooded condition than non-flooded condition [28] [29] (Kamoshita and Abe, 2007; Patel et al., 2010). Reduction in plant height under rainfed condition may be due to water stress which limits cell elongation resulting in reduction of internodal length and eventually giving shorter plant height [29] (Patel et al., 2010). Moreover, plant height and tiller plant−1 were reduced under conditions of water deficit because plants are unable to absorb soil water resulting in
essential elements being less available [19] (Bunnag and Pongthai, 2013). In an experiment conducted by [30]
Owusu-Sekyere, (2005), the number of tillers in flooded plants was significantly greater than that for rainfed plants. Delay in flowering in rainfed plots compared to flooded plots was reported by [31] Bouman and Tuong, (2001). Reference [32] Lilley and Fukai, (1994) showed that the delay in flowering and the magnitude of this delay was associated with severity of drought conditions. [33] Yan et al., (2010) reported that biomass was sig- nificantly affected by water regime.
Simple correlations indicated that biomass yield was significantly and positively correlated with tillers meter−1
[image:7.595.88.540.348.707.2]at 56 DAS, 105 DAS and number of tillers plant−1 at 105 DAS (Table 5). The tillers at 56 DAS were found
Table 4. Mean of plant height, tillers plant−1 at 105 days after sowing (DAS), days to 50% heading and biomass yield
(kg∙ha−1) across two environments of nineteen high biomass rice lines and cultivar Banks in Beaumont, Texas.
Genotype Plant height (cm) Tillers plant105 DAS −1 at Days to 50% heading Fresh biomass yield (kg∙ha−1)
1 113.71 15.04abcd 101.00efgh 27,663.44abc
2 114.33 10.63cd 103.75cdef 24,661.56bc
3 113.08 16.94abcd 108.50abc 35,086.80ab
4 100.83 18.06abc 101.50defg 32,312.00abc
5 106.50 11.98bcd 111.75ab 20,980.40bc
6 111.92 12.00bcd 103.00cdef 37,284.24ab
7 113.08 16.62abcd 101.00efgh 25,693.64bc
8 111.17 11.85bcd 95.25hij 25,919.32bc
9 111.04 14.76abcd 106.00bcde 24,758.16bc
10 115.29 14.01bcd 93.00j 16,914.24c
11 108.58 22.08a 111.50ab 45,129.56a
12 113.54 16.67abcd 113.00a 29,052.80abc
13 104.67 11.80bcd 103.75cdef 32,215.40abc
14 108.04 10.89cd 99.50fghi 25,241.44bc
15 110.50 15.94abcd 103.75cdef 22,111.04bc
16 107.92 16.85abcd 96.75ghij 29,568.28abc
17 103.96 9.55d 94.75ij 21,981.96bc
18 112.17 11.31cd 93.75ij 14,689.08c
19 110.33 19.04ab 107.25abcd 29,052.80abc
Banks 105.21 17.08abcd 102.00defg 27,695.08abc
significantly and positively correlated with tillers meter−1 at 105 DAS, number of tillers plant−1 at 105 DAS and
days to 50% heading. Average height was significantly and negatively correlated with days to 50% heading. These results suggest the importance of tiller number in biomass production and it can be taken earlier (56 DAS) or later (105 DAS) to estimate biomass yield.
3.3. Drought Tolerance Indices to Identify Tolerant Genotypes
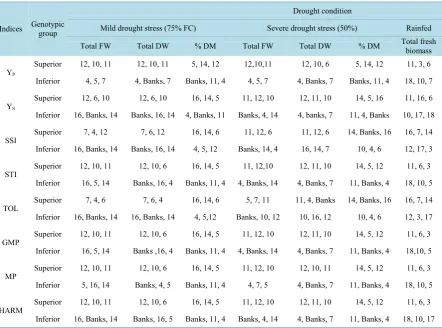
Different drought tolerance indices were calculated for total fresh and total dry weight at a mild drought stress (75% FC), severe drought stress (50%) and for total fresh biomass in rainfed condition. The three superior and inferior genotypes for each of the drought indices are shown in Table 6. Based on SSI and TOL indices com- puted using the greenhouse data, in both total fresh and dry weights, genotype 7 was identified as a tolerant ge-notype in mild stress. Gege-notype 11 was identified as a tolerant gege-notype based on SSI in severe stress in both to-tal fresh and dry weights and Banks and 11 in toto-tal fresh and dry weight, respectively based on TOL. Based on the indices values, it seems that TOL can succeed in selecting genotypes with high yield under stress, but cannot select genotypes with good yield under both stress and non-stress condition [34] (Golbashy et al., 2010). Using SSI, for fresh weights genotype 16 and Banks were selected as sensitive ones in mild and severe stresses, respec-tively and for dry weights, Banks and genotype 16 in mild and severe stress, respecrespec-tively (Table 6) as they had higher values of SSI [12] (Nazari and Pakniyat, 2010). SSI could not identify genotypes having high yields under both stressed and non-stressed condition [34] (Golbashy et al., 2010) for e.g., genotype 12 in mild stress for both fresh and dry weights. Higher values of STI, GMP, MP and Harm indicate stress tolerance [13] (Fernandez, 1992). Based on these indices, genotype 12 and genotype 10 were identified as tolerant genotypes in mild stress for both fresh and dry weights (Table 6) and genotype 11 and genotype 12 for fresh weights and genotype 12 and genotype 11 for dry weight in severe stress based on STI, GMP and HARM whereas genotypes 12 and 10 based on MP. Based on SSI and TOL, in % DM genotypes 16 and 14 are identified as tolerant whereas geno-types 4 and 5 are sensitive and in severe stress genotype 14 and Banks as tolerant and genogeno-types 10 and 4 as susceptible. Based on STI, GMP, MP and HARM, genotypes 16 and 14 are superior in % DM in mild stress and genotypes 14 and 5 in severe stress.
Table 6 similarly shows the three superior and inferior genotypes based on different indices in rainfed and flooded condition. Based on SSI and TOL, genotypes 16 and 7 were identified as tolerant, however using the other calculated indices i.e. STI, GMP, MP and HARM, genotypes 11 and 6 were identified as tolerant geno-types. As mentioned earlier, SSI and TOL are not very successful in identifying genotypes having high yield in both stressed and non-stressed condition [14] [35] (Jafari et al., 2009; Rosielle and Hamblin, 1981).
4. Conclusion
[image:8.595.88.536.566.707.2]In the green house and field experiments, the availability of water affected the agronomic traits and biomass pro- duction. Most of the genotypes performed better under non stressed conditions. The best performing genotypes were impressive as these genotypes had the best traits measured in this study that could be the determinants
Table 5. Correlation among various traits of high biomass rice genotypes grown in rainfed and flooded environments at
Beaumont, Texas.
Trait Average height Tiller meterat 56 DAS−1 Tiller meterat 105 DAS −1 Rate of tiller production Tillers plantat 105 DAS −1 Days to 50% heading
Average height
Tiller meter−1 at 56 DAS −0.01
Tiller meter−1 at 105 DAS −0.06 0.80**
Rate of tiller production −0.09 0.02 0.60**
Tillers plant−1 at 105 DAS 0.14 0.46** 0.57** 0.34**
Days to 50% heading −0.43** 0.24* 0.24* 0.09 −0.11
Biomass yield (kg∙ha−1) 0.04 0.32** 0.27* 0.04 0.45** 0.01
Table 6.Selected superior and inferior genotypes using the six drought tolerance indices at mild and severe drought stress based on percent field capacity, and in rainfed condition.
Indices Genotypic group
Drought condition
Mild drought stress (75% FC) Severe drought stress (50%) Rainfed
Total FW Total DW % DM Total FW Total DW % DM Total fresh biomass
YP
Superior 12, 10, 11 12, 10, 11 5, 14, 12 12,10,11 12, 10, 6 5, 14, 12 11, 3, 6 Inferior 4, 5, 7 4, Banks, 7 Banks, 11, 4 4, 5, 7 4, Banks, 7 Banks, 11, 4 18, 10, 7
YS
Superior 12, 6, 10 12, 6, 10 16, 14, 5 11, 12, 10 12, 11, 10 14, 5, 16 11, 16, 6 Inferior 16, Banks, 14 Banks, 16, 14 4, Banks, 11 Banks, 4, 14 4, banks, 7 11, 4, Banks 10, 17, 18
SSI Superior 7, 4, 12 7, 6, 12 16, 14, 6 11, 12, 6 11, 12, 6 14, Banks, 16 16, 7, 14 Inferior 16, Banks, 14 Banks, 16, 14 4, 5, 12 Banks, 14, 4 16, 14, 7 10, 4, 6 12, 17, 3
STI Superior 12, 10, 11 12, 10, 6 16, 14, 5 11, 12,10 12, 11, 10 14, 5, 12 11, 6, 3 Inferior 16, 5, 14 Banks, 16, 4 Banks, 11, 4 4, Banks, 14 4, Banks, 7 11, Banks, 4 18, 10, 5
TOL Superior 7, 4, 6 7, 6, 4 16, 14, 6 5, 7, 11 11, 4, Banks 14, Banks, 16 16, 7, 14 Inferior 16, Banks, 14 16, Banks, 14 4, 5,12 Banks, 10, 12 10, 16, 12 10, 4, 6 12, 3, 17
GMP Superior 12, 10, 11 12, 10, 6 16, 14, 5 11, 12, 10 12, 11, 10 14, 5, 12 11, 6, 3 Inferior 16, 5, 14 Banks ,16, 4 Banks, 11, 4 4, Banks, 14 4, Banks, 7 11, Banks, 4 18,10, 5
MP Superior 12, 10, 11 12, 10, 6 16, 14, 5 11, 12, 10 12, 10, 11 14, 5, 12 11, 6, 3 Inferior 5, 16, 14 Banks, 4, 5 Banks, 11, 4 4, 7, 5 4, Banks, 7 11, Banks, 4 18, 10, 5
HARM Superior 12, 10, 11 12, 10, 6 16, 14, 5 11, 12, 10 12, 11, 10 14, 5, 12 11, 6, 3 Inferior 16, Banks, 14 Banks, 16, 5 Banks, 11, 4 Banks, 4, 14 4, Banks, 7 11, Banks, 4 18, 10, 17 YP: Potential yield; YS: Stress yield; SSI: Stress susceptibility index; STI: Stress tolerance index; TOL: Tolerance index; GMP: Geometric mean
productivity; MP: Mean productivity; HARM: Harmonic mean.
of biomass yield. The high biomass genotypes like conventional rice were affected by drought and performed better under flooded field conditions. However, some genotypes had comparable response under stress environ-ment. These genotypes can be identified using STI, GMP, MP and HARM drought tolerance indices as they have a similar ability to separate drought sensitive and tolerant genotypes. These genotypes can be used for cultivation under stress condition to get optimum biomass yields. In conclusion, genotype 11 and genotype 12 are more to-lerant to drought stress. Genetic analysis and detailed characterization of both shoot and root rates of such geno-types will help us understand the inheritance pattern and the number of genes controlling the traits and determine specific leaves and root traits important in developing high biomass rice.
Acknowledgements
Partial support for this study was generously provided by the Texas AgriLife Research and Texas Rice Research Foundation. We would also like to thank Chersty Harper and Patrick Frank for their help.
References
[1] Mae, T. (1997) Physiological Nitrogen Efficiency in Rice: Nitrogen Utilization, Photosynthesis, and Yield Potential. In: Plant Nutrition for Sustainable Food Production and Environment, Springer, Berlin, 51-60.
http://dx.doi.org/10.1007/978-94-009-0047-9_5
[2] GRiSP (Global Rice Science Partnership) (2013) Rice Almanac. 4th Edition, International Rice Research Institute, Los Baños.
[4] NCAR (2005) Drought’s Growing Reach: NCAR Study Points to Global Warming as Key Factor.
http://www.ucar.edu/news/releases/2005/drought_research.shtml
[5] Farooq, M., Wahid, A., Lee, D.-J., Ito, O. and Siddique, K.H. (2009) Advances in Drought Resistance of Rice. Critical Reviews in Plant Sciences,28, 199-217. http://dx.doi.org/10.1080/07352680902952173
[6] Long, S.P. and Ort, D.R. (2010) More than Taking the Heat: Crops and Global Change. Current Opinion in Plant Biol-ogy,13, 240-247. http://dx.doi.org/10.1016/j.pbi.2010.04.008
[7] Chaudhry, M. and McLean, E. (1963) Comparative Effects of Flooded and Unflooded Soil Conditions and Nitrogen Application on Growth and Nutrient Uptake by Rice Plants. Agronomy Journal,55, 565-567.
http://dx.doi.org/10.2134/agronj1963.00021962005500060019x
[8] Xiao, B., Huang, Y., Tang, N. and Xiong, L. (2007) Over-Expression of a LEA Gene in Rice Improves Drought Resis-tance under the Field Conditions. Theoretical and Applied Genetics,115, 35-46.
http://dx.doi.org/10.1007/s00122-007-0538-9
[9] Lim, J.S., Manan, Z.A., Alwi, S.R.W. and Hashim, H. (2012) A Review on Utilisation of Biomass from Rice Industry as a Source of Renewable Energy. Renewable and Sustainable Energy Reviews,16, 3084-3094.
http://dx.doi.org/10.1016/j.rser.2012.02.051
[10] Kirubakaran, V., Sivaramakrishnan, V., Nalini, R., Sekar, T., Premalatha, M. and Subramanian, P. (2009) A Review on Gasification of Biomass. Renewable and Sustainable Energy Reviews,13, 179-186.
http://dx.doi.org/10.1016/j.rser.2007.07.001
[11] Werther, J., Saenger, M., Hartge, E.-U., Ogada, T. and Siagi, Z. (2000) Combustion of Agricultural Residues. Progress in Energy and Combustion Science, 26, 1-27. http://dx.doi.org/10.1016/S0360-1285(99)00005-2
[12] Nazari, L. and Pakniyat, H. (2010) Assessment of Drought Tolerance in Barley Genotypes. Journal of Applied Sciences,
10, 151-156. http://dx.doi.org/10.3923/jas.2010.151.156
[13] Fernandez, G.C. (1992) Effective Selection Criteria for Assessing Plant Stress Tolerance. Proceedings of the Interna-tional Symposium on Adaptation of Vegetables and Other Food Crops in Temperature and Water Stress, Taiwan, 13-18 August 1992, 257-270.
[14] Rosielle, A. and Hamblin, J. (1981) Theoretical Aspects of Selection for Yield in Stress and Non-Stress Environment. Crop Science, 21, 943-946. http://dx.doi.org/10.2135/cropsci1981.0011183X002100060033x
[15] Fischer, R. and Maurer, R. (1978) Drought Resistance in Spring Wheat Cultivars. I. Grain Yield Responses. Australian Journal of Agricultural Research, 29, 897-912. http://dx.doi.org/10.1071/AR9780897
[16] Tabien, R.E., Samonte, S.O.P.B., Harper, C.L., Frank, P.M., Pace, J.V. and Wilson, L.T. (2005) Inheritance of Number of Leaves and Tillers, Rates of Leaf and Tiller Production. Abstracts, 65. http://www.irri.org/rg5/Abstracts.pdf
[17] Mostajeran, A. and Rahimi-Eichi, V. (2009) Effects of Drought Stress on Growth and Yield of Rice (Oryza sativa L.) Cultivars and Accumulation of Proline and Soluble Sugars in Sheath and Blades of Their Different Ages Leaves. American-Eurasian Journal of Agricultural & Environmental Sciences, 5, 264-272.
[18] Guevarra, A. and Chang, T. (1965) Internode Elongation in Rice Varieties of Reduced Plant Stature. The Philippine Agricultural Scientist, 49, 23-42.
[19] Bunnag, S. and Pongthai, P. (2013) Selection of Rice (Oryza sativa L.) Cultivars Tolerant to Drought Stress at the Ve-getative Stage under Field Conditions. American Journal of Plant Sciences, 4, 1701-1708.
http://dx.doi.org/10.4236/ajps.2013.49207
[20] Price, A., Steele, K., Gorham, J., Bridges, J., Moore, B., Evans, J., Richardson, P. and Jones, R. (2002) Upland Rice Grown in Soil-Filled Chambers and Exposed to Contrasting Water-Deficit Regimes: I. Root Distribution, Water Use and Plant Water Status. Field Crops Research, 76, 11-24. http://dx.doi.org/10.1016/S0378-4290(02)00012-6
[21] Suralta, R.R. and Yamauchi, A. (2008) Root Growth, Aerenchyma Development, and Oxygen Transport in Rice Geno-types Subjected to Drought and Waterlogging. Environmental and Experimental Botany, 64, 75-82.
http://dx.doi.org/10.1016/j.envexpbot.2008.01.004
[22] Sinaki, J., Heravan, E.M., Rad, A.S., Noormohammadi, G. and Zarei, G. (2007) The Effects of Water Deficit during Growth Stages of Canola (Brassica napus L.). American-Eurasian Journal of Agricultural and Environmental Science,
2, 417-422.
[23] Zubaer, M., Chowdhury, A., Islam, M., Ahmed, T. and Hasan, M. (2007) Effects of Water Stress on Growth and Yield Attributes of Aman Rice Genotypes. International Journal of Sustainable Crop Production, 2, 25-30.
[25] Zhang, J. and Kirkham, M. (1996) Enzymatic Responses of the Ascorbate-Glutathione Cycle to Drought in Sorghum and Sunflower Plants. Plant Science, 113, 139-147. http://dx.doi.org/10.1016/0168-9452(95)04295-4
[26] Christmann, A., Weiler, E.W., Steudle, E. and Grill, E. (2007) A Hydraulic Signal in Root-to-Shoot Signalling of Water Shortage. The Plant Journal, 52, 167-174. http://dx.doi.org/10.1111/j.1365-313X.2007.03234.x
[27] Matsuo, N., Nhan, D.Q. and Mochizuki, T. (2007) Effect of Deep Tillage on Growth and Yield of Rice Cultivars Grown under Water Deficit. Journal of the Faculty of Agriculture, 52, 331-336.
[28] Kamoshita, A. and Abe, J. (2007) Growth of Rice Plants (Oryza sativa L.) under Non-Flooded Water-Saving Paddy Fields. Agricultural Journal, 2, 375-383.
[29] Patel, D., Das, A., Munda, G., Ghosh, P., Bordoloi, J.S. and Kumar, M. (2010) Evaluation of Yield and Physiological Attributes of High-Yielding Rice Varieties under Aerobic and Flood-Irrigated Management Practices in Mid-Hills Ecosystem. Agricultural Water Management, 97, 1269-1276. http://dx.doi.org/10.1016/j.agwat.2010.02.018
[30] Owusu-Sekyere, J.D. (2005) Water Table Control for Rice Production in Ghana. Master’s Thesis, Cranfield University, Silsoe.
[31] Bouman, B. and Tuong, T.P. (2001) Field Water Management to Save Water and Increase Its Productivity in Irrigated Lowland Rice. Agricultural Water Management, 49, 11-30. http://dx.doi.org/10.1016/S0378-3774(00)00128-1
[32] Lilley, J. and Fukai, S. (1994) Effect of Timing and Severity of Water Deficit on Four Diverse Rice Cultivars I. Rooting Pattern and Soil Water Extraction. Field Crops Research,37, 205-213.
http://dx.doi.org/10.1016/0378-4290(94)90099-X
[33] Yan, J., Yu, J., Tao, G.C., Vos, J., Bouman, B., Xie, G.H. and Meinke, H. (2010) Yield Formation and Tillering Dy-namics of Direct-Seeded Rice in Flooded and Nonflooded Soils in the Huai River Basin of China. Field Crops Re-search, 116, 252-259. http://dx.doi.org/10.1016/j.fcr.2010.01.002
[34] Golbashy, M., Ebrahimi, M., Khorasani, S.K. and Choukan, R. (2010) Evaluation of Drought Tolerance of Some Corn (Zea mays L.) Hybrids in Iran. African Journal of Agricultural Research, 5, 2714-2719.