Munich Personal RePEc Archive
Corporate Governance and Firm
Performance: Results from Greek Firms
Toudas, Kanellos and Karathanassis, George
University of Patras, Athens University of Economics and Business
20 December 2007
Online at
https://mpra.ub.uni-muenchen.de/6414/
Corporate Governance and Firm Performance: Results from Greek Firms
Toudas S. Kanellos 1and Karathanassis George2
Abstract
In this paper, we construct a Governance Index for a sample of Greek companies
quoted on the Athens Stock Exchange. We then classify firms, using each firm
governance index, into three governance portfolios. Furthermore, the Fama and French
model, extended to include a momentum variable, is tested for each of the three
governance portfolios. Our findings suggest that most of the firms in our sample are
semi-democracies followed by democracies and dictatorships respectively. Good
governance appears to be of value in as much as we found higher Tobin’s q ratios for
democracies followed by semi-democracies and dictatorships. We, also, report significant
negative abnormal returns for shareholder-friendly and manager-friendly firms. The
findings of significant negative abnormal returns are consistent with inefficient capital
markets. At a practitioner level, the results imply that firms should practice vigorously
good governance, as it is a policy of value to shareholders and possibly to other
stakeholders.
KEYWORDS: Corporate Governance, Firm Performance, Democratic and
Dictatorship Firms
JEL codes: G30, G14
1
University of Patras
2
INTRODUCTION
The notion that corporate governance affects positively corporate performance is
based on the fact that management in shareholder-friendly firms, in making corporate
decisions, do what shareholders themselves would have done, had they been in charge of
corporate decisions. They would have maximized the market value of the firm.
Corporate government provisions in management-friendly firms, that protect
management from dismissal, may not be beneficial to shareholders. Such arrangements
can increase agency costs and, thus, lead to a reduction in shareholder wealth (Manne
1965) and Easterbrook and Fischel (1981).
It is possible, however, as argued by some, that protecting management from
removal may have beneficial effects upon shareholder wealth. Arrangements to protect
management from appraisal may lead incumbents to invest in long-term projects that
increase the value of the firm (Stein 1988 and Bebchuk and Lars 1993). Furthermore,
such arrangements may increase the bargaining power of shareholders and obtain large
premia in acquisitions.
Thus, firms with some mild governance provisions that protect management from
dismissal, but do not permit them to extract large private benefits may be beneficial to
shareholders. These firms are neither shareholder friendly nor manager friendly, but fall
in between the above two extreme categories.
Much has been written on the subject of corporate governance and agency costs.
There are conflicting views on the issue of the relationship between market value and
parts of the world, perturbed by recent grave corporate financial scandals, have taken
drastic steps in reforming corporate governance rules.
The issue of the relationship between firm market value and governance provisions
is, primarily, an empirical one. Most of the empirical work on the subject has been
undertaken in the United States of America with mixed results. Theoretical constructs are
of value, if they can explain real world behaviour. This necessitates repeated tests with
data from developed and developing countries.
The present paper has several objectives. Firstly, it constructs a corporate
governance index based on the answers to a questionnaire dispatched to the executives of
Greek firms, the shares of which are quoted on the Athens Sock Exchange. Secondly, it
explores the issue whether the set of government provisions used by firms is of value to
shareholders. Thirdly, it investigates the extent to which changes in empirical abnormal
returns can be explained by changes in the factors contained in the four-factor model
(Fama and French 1993 and Carhart 1997). It should be mentioned that the effects of
governance on the market value of firms and equity abnormal returns has not hither to,
been studied for the Greek Capital Market.
The remainder of the paper is organized as follows. Section II reviews some of the
relevant existing work on the subject, section III is concerned with the sources of data
and research methodology while section IV presents the empirical results. Finally, section
Review of Related Research
In this section we will briefly review only a number of relevant papers as the
literature, both theoretical and empirical, is vast and has already been reviewed elsewhere
(Shleifer and Vishny 1997, John and Senbet 1998, Hermalin and Weisbach 2003,
Gompers et.al. 2003 and Karathanassis and Drakos 2004).
We start off with the influential paper presented by Gompers, Ishii and Metrick
(GIM) (2003). GIM constructed a summary index of corporate governance, which
included all provisions reported by the Institutional Investors Research Center (IIRC).
GIM coined the terms democracies and dictatorships. In the first category, they included
firms that are shareholder-friendly, while the second category comprises firms that are
manager-friendly. They found that democracies have higher Tobin’s q ratios and better
operating performance than dictatorships. Furthermore, they reported that democracies
earned higher positive abnormal returns than dictatorships. Bebchuk, Cohen and Ferrell
(2004) used the Fama and French (1993) three-factor model extended, to include a
momentum factor (Carhart 1997). They modified GIM’s index concentrating on only six
government provisions. They then aggregated these six provisions into a single
explanatory index.They also found that there is a negative relationship between the level
of the governance index and the market value of the firm. Finally, they found a negative
relationship between the level of the governance index and abnormal returns. These
results implied that the capital market was inefficient over their sample period.
Brown and Caylor (2004) extended GIM’s work, by creating a corporate
Index ‘Gov-Score’ is a composite measure of 51 governance provisions covering eight
corporate categories. They then related Gov-Score to operating performance, valuation
and dividend payouts for 2327 firms and found that shareholder-friendly firms are
relatively more profitable, more valuable and with liberal dividend policies. Their results
implied that markets were inefficient. This implication was not shared by Johnson,
Moorman and Sorescu (2005), who introduced a calendar-time control firm approach to
rectify possible misspecifications in the three-factor Fama and French (1993)
methodology. Their results showed that neither shareholder-friendly firms nor
manager-friendly firms earned significant abnormal returns. These findings imply that the market
impounds in the prices of stocks quickly and accurately firms’ government choices. Their
main implication was that markets were efficient.
Data and Research Methodology
Our sample consists of 314 firms quoted on the Athens Stock Exchange. The firms
were observed over the years 2004 and 2005. It should be noted that in Greece
compliance to governance provisions has been effective since the fiscal year 2004. In
order to determine the quality of government practices of the firms in our sample we
formulated a number of questions based on a number of provisions promulgated by the
European and U.S.A. authorities. These are similar to those cited in the article by Brown
and Caylor (2004). The questionnaire was dispatched vial electronic mail to 314 firms
completed and returned to us for analysis, which is a very high response for this kind of
research. We then coded the 55 binary questions, assigning one point for every practice
(provision) that restricts shareholder rights and zero points for every provision that
increases shareholder power. As a rule, similar indexes were constructed by earlier
published works (some of which were reviewed earlier), either by using data supplied by
Institutional Research Centers or by studying relevant supplements to published accounts.
In countries where such institutions do not exist, one could have studied firm annual
accounts (Tsipouri and Xanthakis 2004, Tsipouri, Spanos and Xanthakis 2005, Aksu,
Mine and Kosedag 2006, Florou and Galarniotis 2007). Such a study could reveal each
firm’s compliance with relevant governance practices. It should, however, be stressed
that even though compliance with governance rules may be compulsory, it is possible that
management may exercise discrection regarding the extent to which some of the
governance provisions are being practiced. It follows that a study of firm accounts alone
may not reveal fully the qualitative application of mandatory governance rules. Our
approach to constructing a governance index is more analytical and direct in as much as it
involves appraisal of governance provisions at firm level through a number of relevant
questions put to firm executives. It is, thus, better placed to explain the extent to which
firms practice governance rules. Our approach is more direct, as we question those firm
executives who are responsible for the qualitative application of governance rules for
each firm. We may, therefore, expect reliable classification of firms into categories
indicating whether a firm is a) shareholder-friendly (democracies), b) manager-friendly
(dictatorships) or c) semi-democracy. Of the 55 questions only six provisions were taken
Brown and Caylor (2004). These provisions include those factors that may be said more
effectively to measure the degree of qualitative application of corporate governance.
These were: staggered boards, limits to shareholder amendments of the bylaws,
supermajority, requirements for charter amendments, poisson pills and golden parachute
arrangements. Along these lines, we established the total score of the answers to the six
questions and constructed for each firm a score similar to the entrenchment-index created
by Bebchuk et.al. (2004). Thus, the scores range from 0 to 6. Firms with total scores
equal and/or less than 1 are classified as democracies, firms with a score equal and/or
greater than 4 are classified as dictatorships. Firms with a score from 2 to 3 are classified
as semi-democracies. On the basis of the above classifications we have three types of
portfolios comprising shareholder-friendly (democracies), manager-friendly
(dictatorships) and semi-democracy firms.
Our next step is to determine which one of the above three alternative sets of firms
dominates the market. In other words, we would like to determine the relationship
between governance and firm performance. Firm performance will be represented by
Tobin’s q. The relevant formula is given below:
c p
VAL VAL Debt
TQR
TA
+ +
= (1)
Due to the complexities of calculating Tobin’s q, as proposed initially by Tobin and
Brainard (1968), we used an alternative simplified approach proposed by Chung and
Pruitt (1994) and Perfect and Wiles (1994). Specifically, “VALc” is the stock exchange
value of common stock at the end of economic year n and “VALp” is the stock exchange
book value of total Liabilities (Short- and Long-term) at the end of economic year n,
while variable “TA” represents the book value of total Assets at the end of year n.
We now turn to the issue of market efficiency initially through application of the
Fama and French three-factor model. We then extend the Fama and French methodology
to include an additional factor that of momentum.
The three-factor model
In this section, we use the methodology advanced by Fama and French (1993).
The initial CAPM formulation was substituted by the three-factor model, to account for
additional factors, which were supposed to provide additional information in explaining
required and/or abnormal rates of return for single shares and portfolios of shares. In the
third specification a fourth factor was added to account for an additional factor known as
momentum.
We replicate the methodology used in previous studies (Gompers et al., 2003.
Bebchuk et al., 2004. Johnson et al., 2005. Cremers and Nair, 2005) and constructed
Governance portfolios, in order to examine the existence of abnormal returns on the
Athens Stock Exchange for the years 2004, 2005. For each calendar month we calculate
the monthly returns for each of the three weighted Governance portfolios (Democracy,
Semi-democracy, and Dictatorship portfolios). The portfolios’ construction is achieved
using the value-weighted method. We then regress the monthly excess returns using the
three-factor model, as shown below:
where
(
Ri −Rf)
t is the abnormal return of the firms of each Governance portfolio. Inother words, it is the return per month of each Governance portfolio after the substraction
of the riskless interest rate
( )
Rf , which was extracted from Government bonds. Thevariable
(
)
t f
m R
R − represents the excess return on the market portfolio. is the
difference of returns of weighted portfolios of big size minus the returns of
value-weighted portfolios of small size.
(
SMBt)
(
HMLt)
is the difference of returns of value-weightedportfolios of high book-to-market minus the returns of value-weighted portfolios of low
book-to-market. The intercept “a” is interpreted as the mean monthly abnormal return of
each Governance portfolio. If the intercept “a” is statistically significant, then excess
returns do exist (Gompers et al., 2003. Bebchuk et al., 2004. Johnson et al., 2005).
The above model was tested using Ordinary Least Squares.
The Four-Factor Model
Carhart (1997) in an effort to evaluate fund managers, extended the Fama and
French model and added an additional factor that of Momentum. We use the additional
four factor model in order to determine the extent to which this additional variable
improves the explanatory power of the model. The four-factor model may be written as:
(
Ri−Rf)
t =a+β1(
Rm−Rf)
t +β2SMBt+β3HMLt +β4Momentumt +εt (3)where Momentum is the difference of returns of portfolios with high returns in the past
minus the returns of portfolios with small returns in the past. The momentum variable has
duration of twelve months and is based on the methodology advanced by Otten and Bams
Index of the Athens Stock Exchange have been collected from the Hellenic Capital
Market Commission and the “DataStream” database.
Empirical Results and Discussion
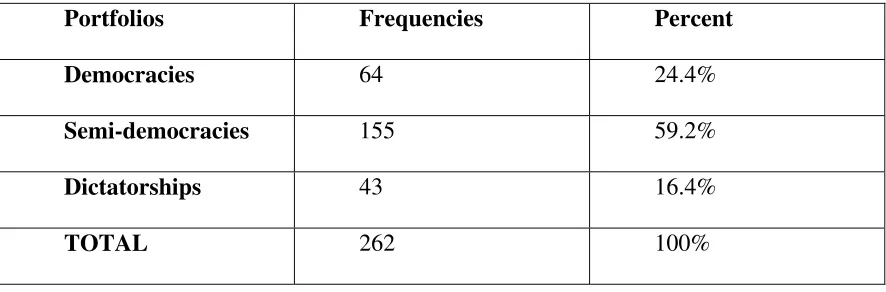
Table 1.A shows the number of firms belonging to each broad category of
governance practices explained earlier.
[Table 1.A. enters here]
As can be seen from this table, semi-democracies dominate the Greek Capital
Market, followed by democracies and dictatorships. An interesting result is that nearly
60% of firms are semi-democracies. This is possibly due to the fact that most firms, in
Greece, are family-owned with benevolent owner-managing directors, who grant outside
shareholders a sense of involvement in the firm’s corporate affairs. Institutional Investors
who hold shares in such firms have aligned themselves with management interests (which
coincide with the interest of the founders-owners of the firm). The average outside
shareholder in such firms passively accept managerial decisions, which are also accepted
by institutional investors given their strategic alignment motives (Pound 1988). Under
this regime, we should expect the management of semi-democracy firms to pay
lip-service to good governance, while the management of democracy firms may be quite
democracy firms to perform better than semi-democracy firms, which in turn may
perform better than dictatorships.
To construct Tobin’s q, which is unique for each company and year, we used
published yearly financial statements, as well as the stock prices on the last day of
negotiation for the years 2004 and 2005.
In order to find what kind of relation exists between Tobin’s q and Corporate
Governance, we use the one-way analysis of variance (ONE WAY ANOVA) for each
year.
Tables 1.B. and 1.C. show the results from the analysis of variance (ONE WAY
ANOVA). We observe that there exists a positive and statistically significant relationship
between firm value, as is calculated by Tobin’s q and the level of Corporate Governance
for both years (2004, 2005). Specifically, and with regard to 2004, it appears that
Democracies have a much higher Tobin’s q (mean = 1.504) compared to
Semi-democracy firms (mean = 0.778) and Dictatorships (mean = 0.575). This difference in the
means of the three Governance portfolios was found to be statistically significant (F =
34.9, df = 2, p-value < 0.01). A similar tendency is also observed for the year 2005. The
higher Tobin’s qs for Democracies, has a mean equal to 1.54, followed by
Semi-democracies (mean = 0.906) and Dictatorships (mean = 0.67). For the year 2005, this
difference in means was found to be statistically significant (F = 14.772, df = 2, p-value <
0.01).
[Table 1.B enters here]
From tables 1.B. and 1.C. we conclude that our a priori expectations regarding the
relationship of governance practices and performance, represented by Tobin’s q, were
realized. It would seem that the market recognizes that good governance practices are
valuable and are incorporated into the share prices of firms with strong shareholder
rights. These results are similar to those reported elsewhere as was mentioned earlier. The
implications of our results are obvious for Government and Capital Market Authorities,
as well as for the managers of firms and shareholders. It would not be appropriate at this
juncture to elaborate and expand on the above implications, as our data cover only two
years. Lack of adequate data did not permit us to conduct elaborate techniques, which
might have led to robust results.
We now turn to the issue of market efficiency through use of the Fama and French
(1993) and Carhart (1997) methodologies. Specifically, the four-factor model will be
tested with two different portfolios of firms. One portfolio, as explained earlier, consists
of shareholder friendly firms and the second comprises manager-friendly firms. The
results are shown in Tables 2 and 3.
The explanatory power of the three-factor model is very good. The value of the
intercept is statistically significant for democracies and dictatorships. For the portfolio
comprising shareholder-friendly firms, the variables HML and SMB do not add any
information in explaining the dependent variable. For semi-democracy the value of ‘a’ is
statistically insignificant, while the independent variables (Rm-Rf) and HML add to the
explanatory power of the model. In the third portfolio, that of manager-friendly firms all
independent variables are statistically significant with lower explanatory power than the
The value of the intercept for the democracy portfolio implies an annual negative
abnormal return equal to 20.18% while for the dictatorship portfolio it is equal to
37.06%. For the portfolio with semi-democracy firms it is also negative but not
statistically significant. There is, thus, some evidence that stock returns of the portfolio
with strong power for managers were affected more adversely than the other two
categories of portfolios.
The addition of the fourth leading factor, that of momentum, does not add to the
explanatory power of the model as shown in Table 3.
Overall, our results appear to imply that investors recognize that governance is of
value, which is incorporated into the market value of firms. This follows from the results
of table 1.B., where it is shown that the mean q value for democracies is larger than the
mean value of the other two portfolios (dictatorships and semi-democracies).
Our findings of significant negative abnormal returns for two of the three
portfolios seem to imply that the market is inefficient. This might, prima facie, appear to
be inconsistent, given the above-mentioned finding of the value of relevance of good
governance.
The market may price good/bad governance provisions, but the full adjustment
could take a long time to be effected. In some other instances, such as earnings
adjustments (Bernard and Thomas 1989) and dividend surprises (Michaely, Thaler and
Womack 1995) there has been a long time before the market fully adjusted the event.
Thus, to the extent that the market at the end of the sample period has adjusted
fully the effects of the event or has overreacted in either direction, the relationship
In our case, one could say that the price adjustment has been incomplete resulting thus, in
negative risk premia.
[Table 2 enters here]
[Table 3 enters here]
Conclusions and Suggestions for further research
Corporate Governance provisions in Greece have been in effect since 2004. The
changes in governance structure effected recently are known to all concerned as
evidenced by several reports in the media. It is probably too early to expect the market
fully to recognize and price the effects of governance provisions on firm performance and
whether it is a factor influencing stock returns. Our results have shown that most of the
firms quoted on the Athens Stock Exchange are Semi-democratic. One could be tempted
to say that in these firms power is evenly shared by shareholders and managers. As
regards the effect of governance and firm performance there appears to be a stronger
association between firm performance and the application of provisions friendly to
shareholders.
Even though the present paper does not constitute a direct approach to the issue of
market efficiency, we along with other extant papers, attempted to shed some light on
whether over the sample period the market has been efficient. Our benchmark in doing so
French nearly fifteen years ago. The explanatory value of the model was very good. The
value of the intercept, representing excess return, was negative for the three portfolios
examined and statistically significant for the democracy and dictatorship portfolios. Our
results imply annual negative abnormal returns of 20.13% and 37.06%, respectively for
the democracy and dictatorship portfolios. For the semi-democracy portfolio no such
abnormal return exists. One could, tentatively, conclude that the average return for the
democracy portfolio was adversely affected, but not as severely as that of the dictatorship
portfolio. Whether or not this is a direct consequence of the value relevance of the
application of good governance rules is a moot issue. This could imply use of an
inefficient proxy for the true market portfolio (Roll and Ross 1994 and Berk 1995). There
is some evidence, from our work and from the work of others, that manager-friendly
firms were accompanied by poor performance both in terms of firm value and stock
returns. If the results were affected by unobservable firm and time characteristics then a
different methodology is called for. One should or instance use panel data analysis, where
those unobservable firm and time unobservable effects could be taken into account
indirectly. To achieve this, one would need more temporal data, which are not as yet
References
Aksu, Mine H. and Arman Kosedag (2006) Transparency and disclosure scores and
their determinants in the Istanbul Stock Exchange, Corporate Governance: An
International Review, Vol.14, No. 4, pp. 277-296.
Bebchuk, Lucian A, and Stole Lars (1993) Do Short-Term Managerial Objectives
Lead to Under- or Over-Investment in Long-Term Projects?, Journal of Finance, 48, pp.
719-729.
Bebchuk, Lucian, Alma Cohen, and Allen Ferrell (2004) What Matters in Corporate
Governance?, Harvard Business School, Discussion Paper, No 491.
Berk Janathan B., (1995) A Critique of Size Related Anomalies, Review of
Financial Studies, 8, No.2, pp. 275-286.
Bernard, V., and Thomas J., (1998) Post-Earnings-Announcement Drift: Delayed
Price Response or Risk Premium?, Journal of Accounting Research, Vol. 27.
Brown, Lawrence. D. and Marcos. L. Caylor, (2004) Corporate Governance and
Carhart, Mark. M. (1997) On Persistence in Mutual Fund Performance, Journal of
Finance, 52 (1), pp. 57-82.
Chung, K. H. and S. W. Pruitt (1994) A Simple Approximation of Tobin’s Q,
Financial Management, 23 (3), pp. 70-74.
Cremers, M. K. J. and V. B. Nair (2005) Governance Mechanisms and Equity
Prices, Journal of Finance, 60, pp. 2859-2894.
Easterbrook, Frank H. and Daniel R. Fischel (1981) The Proper Role of a Target's
Management in Responding to a Tender Offer, Harvard Law Review Vol.94, No.6, pp.
1161-1204.
Fama, E. F. and K. R. French (1993) Common Risk Factors in the Returns on
Bonds and Stocks, Journal of Financial Economics, 33 (1), pp. 3-53.
Florou, Annita and Argiris Galarniotis (2007) Benchmarking Greek Corporate
Governance against Defferent Standards, Corporate Governance: An International
Review, 15 (5), pp. 979-998.
Gompers, P. A., J. L. Ishii and A. Metrick (2003) Corporate Governance and Equity
Hermalin, B. and M. Weisbach (2003) Board of directors as an endogenously
determined institution: A survey of the economic literature, Economic Policy Review 9
(April), pp. 7-26.
John, K., and L. W. Senbet (1998) Corporate governance and board effectiveness,
Journal of Banking & Finance 22 (May), pp. 371-403.
Johnson, S. A., T. Moorman and S. Sorescu (2005) Governance, Stock Return, and
Market Efficiency, Mays Business School at Texas A&M University.
Manne, Henry (1965) Mergers and the Market for Corporate Control, Journal of
Political Economy, 73, 110.
Karathanassis, G. A. and A. A. Drakos (2004) A Note on Equity Ownership and
Corporate Value in Greece, Managerial and Decision Economics, 25, pp. 537-547.
Michaely, Roni, Richard H. Thaler, and Kent Womack, (1995) Price Reactions to
Dividend Initiations and Omissions: Overreaction or Drift?, The Journal of Finance, Vol.
50, No.2, pp. 573-608.
Otten, R. and D. Bams (2002) European Mutual Fund Performance, European
Perfect, S. B. and K. W. Wiles (1994) Alternative Constructions of Tobin’s Q: An
Empirical Comparison, Journal of Empirical Finance, 1 (3), pp. 313-341.
Pound, John (1988) Proxy contests and the efficiency of shareholder oversight,
Journal of Financial Economics, Volume 20, 1988, pp. 237-265.
Roll, R. and S. A. Ross (1994) On the Cross-Sectional Relation between Expected
Returns and Betas, Journal of Finance, 49 (1), pp. 101-121.
Shleifer, A. and R. Vishny (1997) A Survey of Corporate Governance, Journal of
Finance, 52 (2), pp. 737-783.
Stein, Jeremy (1988) Takeover Threats and Managerial Myopia, Journal of
Political Economy, 96, pp. 61-80.
Tobin, J. and W. C. Brainard (1968) Pitfalls in Financial Model Building, American
Economic Review, 58 (2), pp. 99-122.
Tsipouri, L. and M. Xanthakis (2004) Can Corporate be Rated? Ideas based on the
Tsipouri, L., L. Spanos, and M. Xanthakis (2005) The Construction of a Corporate
Governance Rating System for a Small Open Capital Market: Methodology and
Tables
Table 1.A. Descriptive Statistics for the Distribution of Sample Firms into the
Three Governance Portfolios.
Portfolios Frequencies Percent
Democracies 64 24.4%
Semi-democracies 155 59.2%
Dictatorships 43 16.4%
[image:22.612.85.534.383.530.2]TOTAL 262 100%
Table 1.B. Means and Standard Deviation of Tobin’s Q for Each Governance
Portfolio and Sample Year.
Year 2004 Year 2005
Mean Standard deviation Mean Standard deviation
Democracies 1.505 0.132 1.540 1.412
Semi-democracies 0.778 0.035 0.907 0.654
Dictatorships 0.576 0.081 0.671 0.746
Table 1.C. Analysis of Variance of Tobin’s Q ratio
Year 2004 Year 2005
F-Statistic p-value F-Statistic p-value
[image:22.612.87.529.385.529.2]Table 2. Regression Analysis of the Three-Factor Model.
Governance
Portfolios
Intercept
“a”
RMRF HML SMB Adj.R2 F-Prob.
DEMOCRACIES -1.6776** (-3.986) 0.8586** (10.785) 0.0235 (0.376) 0.0246 (0.2383) 85.36% <0.001 SEMI-DEMOCRACIES -0.8905 (-1.692) 0.9201** (9.243) 0.1747* (2.235) -0.0314 (-0.244) 83.72% <0.001 DICTATORSHIPS -3.0880** (-3.460) 0.6744** (3.995) 0.2767* (2.088) 0.4784* (2.188) 56.67% <0.001
[image:23.612.85.567.407.595.2](*) (**) Significant at the 5% and 1% level respectively.
Table 3. Regression Analysis of Four-Factor Model.
Governance
Portfolios
Intercept
“a”
RMRF HML SMB Momentum Adj. R2 F-Prob.
DEMOCRACIES -2.0493* (-2.358) 0.8728** (10.128) 0.0289 (0.447) 0.0218 (0.207) 0.0189 (0.492) 84,78% <0,001 SEMI-DEMOCRACIES 0.2680 (0.255) 0.8757** (8.410) 0.1578 (2.021) -0.0228 (-0.179) -0.0589 (-1.269) 84,21% <0,001 DICTATORSHIPS -4.9090* (-2.741) 0.7442** (4.190) 0.3031* (2.275) 0.4648* (2.142) 0.0926 (1.169) 57,45% <0,001