Munich Personal RePEc Archive
Romania and European Union
Membership
van der Hoek, M. Peter
Erasmus University Rotterdam
2007
Online at
https://mpra.ub.uni-muenchen.de/5877/
Romania and European Union Membership
M. Peter van der Hoek, Erasmus University Rotterdam, Netherlands and Academy of Economic Studies in Bucharest, Romania
Abstract: This paper looks both backward and forward. It starts by comparing the
accession countries with the EU and by comparing the EU’s 2004 eastern
enlarge-ment with previous enlargeenlarge-ments. It appears that the EU became poorer by every
single enlargement. The EU’s GDP per capita decreased each time relative to GDP
per capita of the six founding member states.
There appear to be good economic reasons for the postponement of Roma-nia's accession until 2007. Romania did not achieve macro-economic stability as fast as the other accession countries, its welfare level was lower and its progress in establishing a market economy was slower compared to the countries that joined the EU in 2004. In addition, it has realized little progress in the fight against
corrup-tion. A possible explanation for Romania’s poor economic performance in the 1990s
is the partial reform paradox.
The paper also looks at the EU’s prospect in view of the rejection of the draft constitutional treaty by the French and Dutch voters. It presents four options. The most likely seems that the EU will proceed on the basis of the Nice Treaty and political agreements. Further enlargements will be much more difficult to realize than in the past.
Keywords: European Union, enlargement, Romania
1. Introduction
The collapse of communism was followed by a long and deep recession ra-ther than an economic boom despite the fact that the European Union offered finan-cial support to help the countries of Central Europe in coping with drastic economic restructuring and political change. As early as 1989 the EU set up the Phare program (Poland Hungary: Assistance for Reconstruction of the Economy). In addition, the European Union signed the first Europe Agreements in December 1991 (with Pol-and Pol-and Hungary). These agreements offered trade concessions Pol-and other benefits normally associated with full European Union membership (Schoors and Gobbin, 2005). More Europe Agreements followed suit including the agreement with Roma-nia in 1993. Eventually, this process resulted at the Copenhagen European Council of December 2002 in a proposal of membership for ten applicant countries by May 1, 2004. The applications of Bulgaria and Romania were put on hold, but the Co-penhagen Council clearly communicated the intention to welcome them as members in 2007. However, the accession year could be further postponed to 2008 if these countries had made too little progress.
Table 1 shows the relative importance of the accession countries at the time of their applications in the mid-1990s. Although their combined populations amounted to 28% of that of the EU-15, their combined total GDP amounted to only 4% of that of the EU-15 at current prices or 9% at purchasing power standards. GDP per capita in the applicant countries amounted to 13% at current prices or 32% at purchasing power standards. Thus, the applicant countries were poor relative to the EU-15 and their economic weight is very small despite their sizeable populations.
Table 1. The 10 applicant countries in Central and Eastern Europe as a percen-tage of the EU, 1995
Area Popula-tion Total GDP (current prices) GDP per capita (cur-rent prices) Total GDP (purchasing power)
GDP per capita (purchasing
power)
33 28 4 13 9 32
Source: European Commission, Agenda 2000 - Volume II - Communication: The effects on the Union's policies of enlargement to the applicant countries of Central and Eastern Europe (Impact study), p. 68.
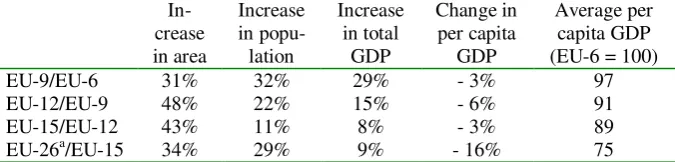
The Eastern enlargement is often labeled unprecedented. Table 2 compares the 2004 enlargement with three previous enlargements:
1. The 1973 Western enlargement, when Denmark, Ireland, and the UK joined the EU-6 of the founding member states (Belgium, Germany, France, Italy, Luxem-bourg and the Netherlands).
2. The Southern enlargement of the 1980s, when Greece (in 1981) and Portugal and Spain (in 1986) joined the EU-9.
3. The Northern enlargement in 1995, when Austria, Finland and Sweden joined the EU-12.
en-largement of the 1980s the increase of GDP was much smaller than that of the popu-lation. In fact, the result of each enlargement has been a decrease of GDP per capita. Thus, the EU became poorer by every enlargement and after the Eastern enlarge-ment GDP per capita in the EU decreased to 75% of that of the original six mem-bers. The 2004 enlargement was unprecedented in terms of the number of accession countries, their diversity and their welfare levels, but not in terms of area and popu-lation.
Table 2. Impact of successive enlargements of the EU (based on 1995 data)
In-crease in area Increase in popu-lation Increase in total GDP Change in per capita GDP Average per capita GDP (EU-6 = 100)
EU-9/EU-6 31% 32% 29% - 3% 97
EU-12/EU-9 48% 22% 15% - 6% 91
EU-15/EU-12 43% 11% 8% - 3% 89
EU-26a/EU-15 34% 29% 9% - 16% 75
a. Cyprus is not included.
Source: European Commission, Agenda 2000 - Volume II - Communication: The effects on the Union's policies of enlargement to the applicant countries of Central and Eastern Europe (Impact study), p. 24.
2. Romania: a comparative perspective
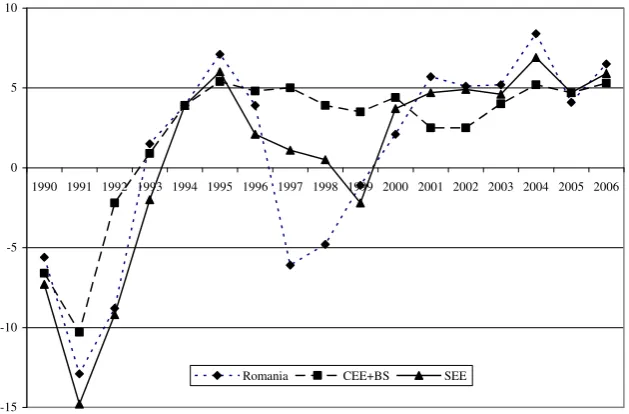
In order to assess whether or not the EU was right in delaying Romania’s accession to 2007 I will compare the economic developments in Romania with the average performance of Romania’s own region - South East Europe1 (SEE) - and that of Central and Eastern Europe plus the Baltic States2 (CEE+BS). To this end I present a number of data providing some insight in the economic performance of SEE, CEE+BS and Romania. Figure 1 shows that CEE+BS already experienced continuous positive growth rates from 1993. The same holds true for SEE although at a lower level, whereas 1999 saw negative growth. Romania experienced positive GDP growth for several years in the mid-1990s followed by negative growth in the late 1990s. In the period 1997-1999, Romania was the only EU accession country with negative growth rates in three consecutive years.3 From the turn of the century,
however, growth rates turned positive in the whole region and tend to converge. Figure 2 displays the results of developments in the period 1990-2005 in terms of real GDP level in 2005 relative to that in 1989. In 2005, real GDP in CEE+BS was one third above its 1989 level due to the region’s relatively high growth rates.4 SEE’s real GDP was almost back at its 1989 level (97%), whereas
Romania’s GDP (105%) has exceeded its 1989 level.
1 Albania, Bulgaria, Bosnia-Herzegovina, Croatia, Serbia, Montenegro, FYR Macedonia and Romania. 2 Czech Republic, Hungary, Poland, Slovakia, Slovenia (CEE) and Estonia, Latvia and Lithuania (BS). 3 The second worst performing country was the Czech Republic with negative growth rates in 1997 and 1998. 4
Not shown in Figure 2 is that the slowest development occurred in Moldova (47%) and that real GDP in the former Yugoslav republics ranges from 60% (Serbia) to 88% (FYR Macedonia) of its 1989 level
Figure 1. Real GDP growth (in %), 1990-2005
-15 -10 -5 0 5 10
1990 1991 1992 1993 1994 1995 1996 1997 1998 1999 2000 2001 2002 2003 2004 2005 2006
Romania CEE+BS SEE
Source: EBRD, Transition report, London, EBRD, various years.
Figure 2. GDP level in 2005(1989=100)
0 20 40 60 80 100 120 140
Bulgaria Hungary Moldova Romania Ukraine SEE CEE+BS
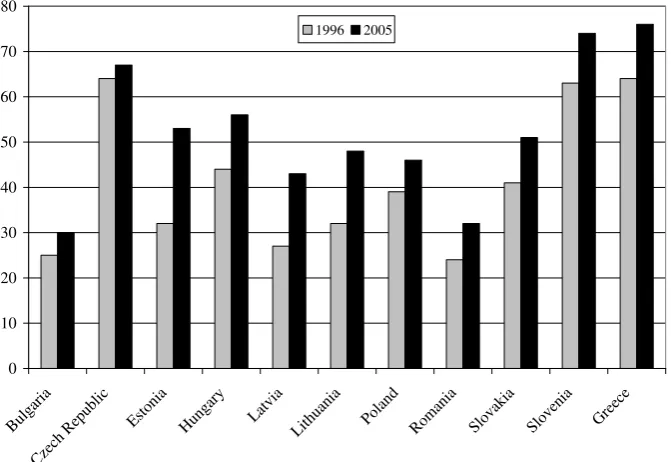
[image:5.595.135.471.475.674.2]Another way of looking at GDP levels is by relating GDP per capita to the average of the EU-15 (see Figure 3). Slovenia is the richest of the new member countries with a GDP per capita of 74% of the EU-15 average, which is almost as high as that of Greece, the poorest EU-15 member state. Romania has the second lowest GDP per capita, only Bulgaria’s is lower. As shown in section 1, the Eastern enlargement of 2004 is considerably smaller in economic terms than the first en-largement of 1973, even though the increase in population is in the same order of magnitude.
Figure 3. GDP per capita in purchasing power standards as a percentage of the EU-15 average, 1996 and 2005
0 10 20 30 40 50 60 70 80
Bulgaria Czech Republic
Estonia Hungary Latvia
Lithuania Poland Romania Slovakia Slovenia Greece
1996 2005
Source: Eurostat, Europe in figures. Eurostat yearbook 2006-07, Luxembourg, Eu-ropean Communities, 2007, p. 152.
A measure for a country’s attractiveness to foreign investors is the inflow of Foreign Direct Investments (FDI). The absolute amount of FDI is not very signif-icant, as this will largely depend on the population size. Figure 4 shows, therefore, the cumulative FDI-inflow per capita in the period 1989-2005. Obviously,
Figure 4. Cumulative FDI-inflow per capita in US$, 1989-2005
0 500 1000 1500 2000 2500 3000 3500 4000 4500
Bulgaria Hungary Moldova Romania Ukraine CEE+BS SEE
Source: EBRD, Transition report 2006, London, EBRD, p. 38.
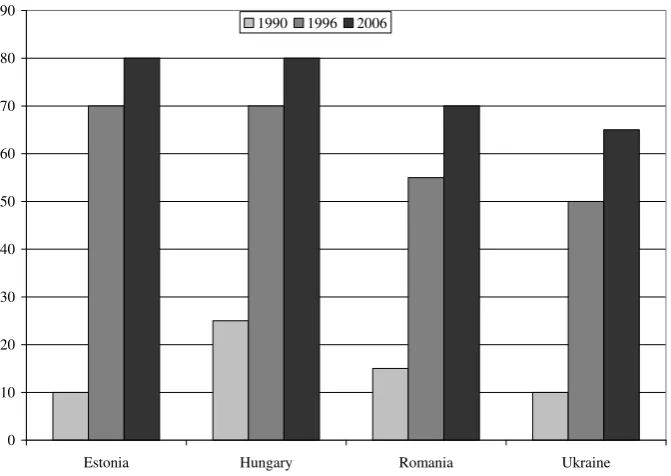
Figure 5. Private sector share in GDP, 1990-2006
0 10 20 30 40 50 60 70 80 90
Estonia Hungary Romania Ukraine 1990 1996 2006
[image:7.595.134.470.423.661.2]The private sector share in GDP is a key indicator for the reforms needed for the transition from a centrally planned to a market economy. Figure 5 displays to which degree selected countries have made progress in their privatization efforts. Insofar the countries selected are representative for their regions the familiar pattern emerges: early reforms in CEE+BS, slower reforms in SEE en the slowest reforms in the former Soviet republics. One may wonder, however, how significant these data are. First, one may doubt how accurate they are. Second, the data do not indi-cate what one may call the quality of the privatization process. The strong increase in Ukraine's private sector share in the early 1990s, for example, may indicate a Russian type of privatization, i.e., a very small group of oligarchs capturing state assets for next to nothing.
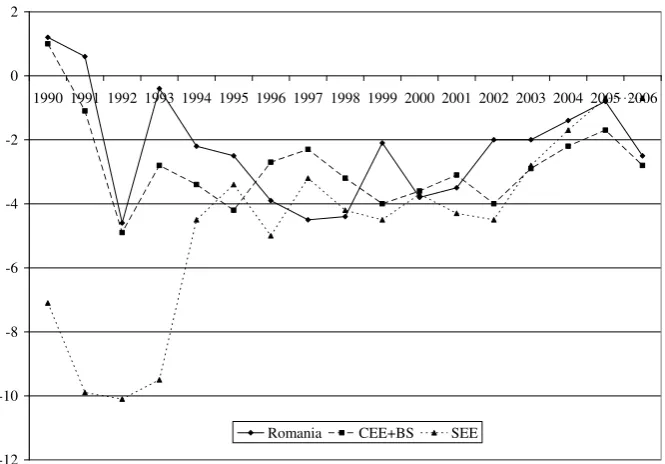
Figure 6. General government balances (as a percentage of GDP)
-12 -10 -8 -6 -4 -2 0 2
1990 1991 1992 1993 1994 1995 1996 1997 1998 1999 2000 2001 2002 2003 2004 2005 2006
Romania CEE+BS SEE
Source: EBRD, Transition report, London, EBRD, various years.
of 8.6% in 2006) and the Czech Republic (3.3% in 2006).5 In SEE it is Albania that exceeds the EMU-criterion (with a projected budget deficit of 4.1% in 2006).
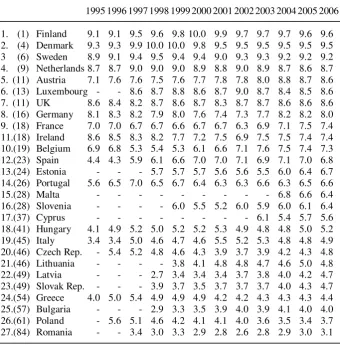
[image:9.595.127.468.286.632.2]Finally, I will pay attention to a non-economic dimension that nonetheless affects the economic performance: the extent of corruption as measured by Transpa-rency International in its Corruption Perception Index (CPI). Table 3 displays the amount of perceived corruption among public officials and politicians over time in the EU member states. Corruption is defined as the misuse of public power for pri-vate benefit. The CPI 2006 includes 12 sources originating from 9 independent insti-tutions. The sources do not distinguish between administrative and political corrup-tion or between petty and grand corrupcorrup-tion.
Table 3. Corruption Perception Index, 1995-2006
1995 1996 1997 1998 1999 2000 2001 2002 2003 2004 2005 2006
1. (1) Finland 9.1 9.1 9.5 9.6 9.8 10.0 9.9 9.7 9.7 9.7 9.6 9.6 2. (4) Denmark 9.3 9.3 9.9 10.0 10.0 9.8 9.5 9.5 9.5 9.5 9.5 9.5 3 (6) Sweden 8.9 9.1 9.4 9.5 9.4 9.4 9.0 9.3 9.3 9.2 9.2 9.2 4. (9) Netherlands 8.7 8.7 9.0 9.0 9.0 8.9 8.8 9.0 8.9 8.7 8.6 8.7 5. (11) Austria 7.1 7.6 7.6 7.5 7.6 7.7 7.8 7.8 8.0 8.8 8.7 8.6 6. (13) Luxembourg - - 8.6 8.7 8.8 8.6 8.7 9.0 8.7 8.4 8.5 8.6 7. (11) UK 8.6 8.4 8.2 8.7 8.6 8.7 8.3 8.7 8.7 8.6 8.6 8.6 8. (16) Germany 8.1 8.3 8.2 7.9 8.0 7.6 7.4 7.3 7.7 8.2 8.2 8.0 9. (18) France 7.0 7.0 6.7 6.7 6.6 6.7 6.7 6.3 6.9 7.1 7.5 7.4 11.(18) Ireland 8.6 8.5 8.3 8.2 7.7 7.2 7.5 6.9 7.5 7.5 7.4 7.4 10.(19) Belgium 6.9 6.8 5.3 5.4 5.3 6.1 6.6 7.1 7.6 7.5 7.4 7.3 12.(23) Spain 4.4 4.3 5.9 6.1 6.6 7.0 7.0 7.1 6.9 7.1 7.0 6.8 13.(24) Estonia - - - 5.7 5.7 5.7 5.6 5.6 5.5 6.0 6.4 6.7 14.(26) Portugal 5.6 6.5 7.0 6.5 6.7 6.4 6.3 6.3 6.6 6.3 6.5 6.6
15.(28) Malta - - - 6.8 6.6 6.4
16.(28) Slovenia - - - - 6.0 5.5 5.2 6.0 5.9 6.0 6.1 6.4
17.(37) Cyprus - - - 6.1 5.4 5.7 5.6
18.(41) Hungary 4.1 4.9 5.2 5.0 5.2 5.2 5.3 4.9 4.8 4.8 5.0 5.2 19.(45) Italy 3.4 3.4 5.0 4.6 4.7 4.6 5.5 5.2 5.3 4.8 4.8 4.9 20.(46) Czech Rep. - 5.4 5.2 4.8 4.6 4.3 3.9 3.7 3.9 4.2 4.3 4.8 21.(46) Lithuania - - - - 3.8 4.1 4.8 4.8 4.7 4.6 5.0 4.8 22.(49) Latvia - - - 2.7 3.4 3.4 3.4 3.7 3.8 4.0 4.2 4.7 23.(49) Slovak Rep. - - - 3.9 3.7 3.5 3.7 3.7 3.7 4.0 4.3 4.7 24.(54) Greece 4.0 5.0 5.4 4.9 4.9 4.9 4.2 4.2 4.3 4.3 4.3 4.4 25.(57) Bulgaria - - - 2.9 3.3 3.5 3.9 4.0 3.9 4.1 4.0 4.0 26.(61) Poland - 5.6 5.1 4.6 4.2 4.1 4.1 4.0 3.6 3.5 3.4 3.7 27.(84) Romania - - 3.4 3.0 3.3 2.9 2.8 2.6 2.8 2.9 3.0 3.1
Source: Transparency International, Corruption Perceptions Index, several years, http://www.transparency.org/surveys/index.html.
5 It should be noted that these figures are still projections, not realizations (source: EBRD, Transition
The scores range from 10 (highly clean) to 0 (highly corrupt) and relate to perceptions of the degree of corruption as seen by businesspeople and country ana-lysts. Respondents expressed their perceptions in surveys assessing a country's per-formance. At least three sources must be available for a country to be included in the CPI. Therefore, in its CPI 2006 Transparency International could include only 163 countries, which is considerably less than the over 200 sovereign nations in the world. The 27 EU member countries listed in Table 3 are ranked on the basis of their score in the CPI 2006, while their CPI 2006 ranking is included in parentheses.
Northwestern Europe is doing relatively well with scores of 8.0 or higher. Italy and Greece were the most corrupt nations in the EU-15 and after the 2004 enlargement they still belong to the most corrupt EU member states. Only three EU-27 member countries (Bulgaria, Poland and Romania) are perceived more corrupt than Greece. Obviously, Romania is at the bottom of the list with a score of 3.1 indicating that doing business in Romania is subject to additional risks resulting from corruption causing additional uncertainties. Particularly worrying is that the corruption is not diminishing over time.
The Copenhagen council decided in December 2002 that Bulgaria and Romania had to wait for EU membership until 2007, while the accession year could be further postponed to 2008 if these countries had made too little progress. Initially,
the European Commission would publish its proposal on Romania’s (and Bu
lga-ria’s) accession year in May 2006. However, in its May 2006 motoring report6 on Romania the Commission announced to postpone its proposal to October 2006. Whether the accession date of January 1, 2007 could be maintained, would primarily
depend on Romania’s ability to demonstrate further results in the fight against cor-ruption by October 2006. After the decision that Bulgaria and Romania could join the EU on January 1, 2007, the Commission communicated to the European
Parlia-ment and the Council that the “accession of Bulgaria and Romania demonstrates to
countries at an earlier stage in their preparations for membership that their ultimate goal is achievable”.7 It seems most likely that the Commission, at the time of writing (November 8, 2006), did not expect that Romania’s main corruption fighter, Monica Macovei, would be dismissed so soon after Romania’s accession.
The data presented here make clear that there were good reasons for the postponement of Romania's accession until 2007. Romania did not achieve macro-economic stability as fast as the other accession countries, neither in terms of prices nor in terms of economic growth. Its welfare level was lower and its progress in establishing a market economy was slower compared to the countries that joined the EU in 2004. In addition, it has made little progress in the fight against corruption.
The fact that Ms. Macovei’s dismissal came so soon after Romania’s accession suggests that it might have been better to postpone the accession date further to 2008. This would have put continued pressure on Romania’s government to advance the reforms and the fight against corruption.
6
European Commission, Monitoring report on the state of preparedness for EU membership of Bulgaria and Romania, COM (2006) 214.
3. Explaining Romania’s poor economic performance in the 1990s8
Enterprises in a typical transition economy can be distinguished by history: they are new, restructured, or old. Generally, history is related to performance. New enterprises are expected to be more productive than restructured enterprises, which in turn are expected to be more productive than old enterprises. As markets develop and resources are allowed to flow to their most valued uses, the role of history pro-gressively weakens, and differences in productivity arising from history (old, re-structured, new) tend to disappear.
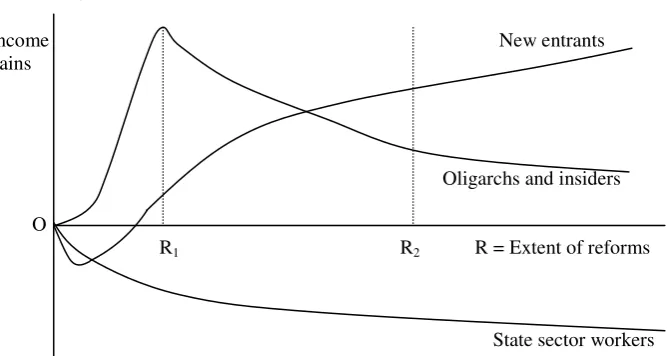
The political economy of reform can be expressed graphically by tracing the paths of winners and losers from the transition. Figure 7 depicts the gains and losses in income accruing to three different constituencies at different stages of reform in a typical transition economy:
1. State sector workers, employed in state enterprises and lacking the skills to become new entrants in the competitive market. They face a sharp drop in in-come as market discipline on inherited enterprises calls for downsizing the sec-tor, with little hope of any substantial recovery with the intensification of reform.
2. Potential new entrants, workers in state enterprises and new entrepreneurs with skills to become new entrants in the competitive market. They have a classic J-curve pattern of income. They face significant adjustment costs at low levels of
8
[image:11.595.133.467.268.446.2]This section heavily draws on The World Bank (2002), Chapter 9.
Figure 7. Winners and Losers from Reform
Income New entrants
gains
Oligarchs and insiders
O
R1 R2 R = Extent of reforms
State sector workers
R1 = point at which income gains of oligarchs and insiders are maximized
R2 = level of reforms that allows the winners of reforms beyond R1 (new entrants)
reform as they exit the state sector. In addition, they realize gains only when enough progress has been made with policy and institutional reforms to promote and support new entry into the competitive market.
3. Oligarchs and insiders. They began the transition with substantial de facto con-trol rights over state assets, while they have close ties with the political elite in-herited from the previous command system. However, because of limited skills to compete in the market economy, they face an inverted U-curve of income gains. They are the immediate beneficiaries of liberalization and privatization, as de facto control rights over state assets can be converted into de jure control and cash flow rights. They reap concentrated gains in the early stages of reform from the opportunities for arbitrage and rent seeking that arise if liberalization and privatization are not combined with market discipline and encouragement of new entrants. But these gains dissipate as further reforms lead to increasing competition and market entry.
Given these patterns of gains and losses, each constituency prefers a differ-ent combination of reforms. For potdiffer-ential new differ-entrants, the reform process offers only sacrifices at the beginning of the reform process, but gains when the reforms are further advanced. State sector workers prefer the status quo (point O), so they reject all reforms. Oligarchs and insiders prefer a partial reform and sustain the reform process through R1, the point where their gains are maximized. Beyond this
point further implementation of policies of market discipline and support of new entrants threaten to undermine gains from rent seeking. It is precisely such partial reforms - liberalization without market discipline and with selective encouragement - that make capture of the state by oligarchs and insiders a self-fulfilling prophecy.
This has led to a so-called partial reform paradox in many transition econ-omies in which governments lack credibility and are highly susceptible to state cap-ture. If potential new entrants believe at the outset of transition that oligarchs and insiders will be able to block anything more than partial reforms, they will discount substantially the potential gains from any proposed radical reforms. Therefore, they will support partial reforms that offer lower costs early in the reform process, even though they are more likely to lead to barriers to entry. Public support for radical reforms thus depends on perceptions of government credibility in its commitment to follow through with such reforms.
This analysis leads to the conclusion that there is a high risk of getting stuck at a low level of reform (R1) characterized by liberalization without market
discipline and limited encouragement of new entry. As both insiders and state sector workers face declining incomes after R1, these groups have a strong incentive to join
forces to oppose further economic reforms. This may explain the situation in Russia and, to a lesser extent. in Romania.9 By recognizing that different combinations of reforms produce different configurations of winners and losers, the framework of market discipline and encouragement of new entrants suggests two political chal-lenges in promoting economic reform:
1. Securing the support of potential new entrants for comprehensive reforms until wider efficiency gains from discipline and encouragement are realized.
9 This political economic analysis of reform may also partly explain the current political situation in
2. Preventing the early winners from liberalization and privatization from under-mining further reforms that would impose discipline and support new entry and competition and thus reduce their rents.
To advance reforms, governments should focus on smoothing the curves of winners and losers (as shown in Figure 7) at the initial stages of reform. This means lowering the adjustment costs for potential new entrants and reducing the high con-centration of gains to oligarchs and insiders. One way to do this is by strengthening the provision of basic public goods, such as secure property rights and a legal and judicial system. In this respect Romania’s Europe Agreement has been instrumental, in that it has helped Romania to meet the Copenhagen criteria (in particular the ad-ministrative criterion, i.e., the ability to take on the acquis communautaire). Another way is by reducing excessively high marginal tax rates and broadening the tax base that promotes entry of enterprises from the unofficial to the official economy. This can break the vicious cycle of informalization, lower tax revenue, and further inten-sification of tax rates on a shrinking base.
4. EU Prospects
The Nice Treaty (February 2001) called for "a deeper and wider debate about the future of the European Union". The Laeken European Council (December 2001) followed up by adopting a "Declaration on the future of the European Union" that explicitly referred to World Wars I and II that weakened Europe’s position in
the world. This brought a growing realization that “only peace and concerted action
could make the dream of a strong, unified Europe come true”. The declaration co m-mitted the EU to greater democracy, transparency and efficiency, and to preparing a constitution for European citizens. The latter was done by the European Convention on the Future of Europe, which presented a draft constitutional treaty to the Euro-pean Council on June 20, 2003.
On June 18, 2004, the European Council adopted unanimously the Treaty establishing a Constitution for Europe beginning with the words “Reflecting the will of the citizens…”. The 25 member states signed it in Rome on October 29, 2004 after which the member states still had to ratify it. Ten countries had already done so before the French voters rejected the constitution on May 29, 2005. The Dutch vot-ers also rejected it on June 1, 2005, but one day later the Latvian parliament ap-proved the constitution (on June 2, 2005). Eighteen member states10 have approved the Constitutional Treaty, two (France and the Netherlands) have rejected it and the remaining seven member countries have not yet decided.
From the legal perspective it is very difficult to proceed with the EU after
the “No” vote by two founding EU member states, but politically it is not possible to stop. Also without a constitution the EU continues to function. Examples are that the European Council reached a compromise on the financial perspectives 2007-2013, that the EU agreed on an open-skies transatlantic aviation deal with the USA, the EU agreed on a climate-change plan, etc. Thus, it would be wrong to say that the EU
10 Austria, Belgium, Bulgaria, Cyprus, Estonia, Finland, Germany, Greece, Hungary, Italy, Latvia,
is unable to make decisions. It still makes decisions, often unanimously, as the above examples show. Undoubtedly, the EU will continue to function and to make decisions even though the French and Dutch voters rejected the draft constitutional treaty in May/June 2005.
When the constitution was signed, it was agreed that if some members would have problems with ratification, the European Council will decide what to do next. Now there are ratification problems in France and the Netherlands it seems that there is a number of options including:
1. A re-run of referendums that resulted in a “No”. The Luxembourg prime-minister Juncker proposed this while he held the (rotating) EU-presidency. How-ever, this seems something of the past, not of the present.
2. The countries that rejected the constitution leave the EU. However, the current treaties do not provide for secession. The constitution does, but is not in force. Moreover, it would be politically inconceivable that two founding member states would leave the EU.
3. Apply the constitution to those countries that accepted it: an EU of two blocks. This would require adjustments of the constitutional treaty. Therefore, it should be subject to a new ratification procedure.
4. Draft an abridged version (as the Finnish MP Kimmo Kiljunen in an early stage proposed). This might be a possibility to avoid the need of new referendums in France and the Netherlands and possibly also to avoid holding referendums in the countries that have not yet decided (the Czech Republic, Denmark, Ireland, Poland, Portugal, Sweden, UK).
5. Proceed on the basis of the Nice Treaty and political agreements: a diverse union rather than an ever-closer union.
In the long run, unity might still emerge. In the short run, however, the EU will most likely evolve as it has been evolving over the past: multi-tiered as the following three examples illustrate:
Not all EU countries participate in Economic and Monetary Union (EMU). For the EU-15 member states it was optional to participate in EMU or not. Den-mark, Sweden and the UK have refused to join EMU and still have their nation-al currencies.11
Some EU countries have opted out from certain policy areas. The UK, for ex-ample, has opted out of the Social Charter, while Denmark, Ireland, and the UK have opted out of provisions related to asylum, immigration, and visas.
The Schengen treaty shows that cooperation between a majority of EU member states with outsiders (Iceland, Norway and Switzerland) is possible. NATO is an example of cooperation between a minority of EU member states and outsid-ers. EMU and the Prüm Treaty show that part of the member states can collabo-rate as a group within the EU without participation of the other member states. This illustrates that a kind of multi-speed EU has already been realized and is functioning.
The most important consequence of the Constitution’s rejection by the French and Dutch voters seems that further enlargement of the EU will be much more difficult to realize than in the past. This applies to Croatia and Turkey with
11 Interestingly, the new member states that joined the EU in 2004 and 2007 do not have a choice. As
whom the EU opened accession negotiations in October 2005. In addition, it applies to the Former Yugoslav Republic of Macedonia that received the status of candidate country in December 2005, but with whom accession negotiations have not started yet. And it also applies to the other countries of the Western Balkans that are poten-tial candidate countries (Albania, Bosnia and Herzegovina, Montenegro and Serbia including Kosovo under the United Nations Security Council Resolution 1244).
References
1. Schoors, K. and N. Gobbin, Enlargement, In M. Peter van der Hoek (ed.), Hand-book of Public Administration and Policy in the European Union, Boca Raton, CRC Press/Taylor & Francis, 2005, pp. 603-646.
2. The World Bank, Transition. The First Ten Years. Analysis and Lessons for
Eastern Europe and the Former Soviet Union, Washington, DC, EBRD/The
World Bank, 2002.
3. van der Hoek, M. Peter and van Miltenburg, Hans, The Baltic republics: An
economic review in retrospect and prospect, In M. Peter van der Hoek and Hans