http://dx.doi.org/10.4236/ojtr.2015.34015
Factors Affecting Minimum Foot Clearance
in the Elderly Walking: A Multiple
Regression Analysis
Keizo SatoDivision of Biomedical Engineering for Health & Welfare, Tohoku University, Sendai, Japan
Received 4 September 2015; accepted 27 October 2015; published 30 October 2015
Copyright © 2015 by author and Scientific Research Publishing Inc.
This work is licensed under the Creative Commons Attribution International License (CC BY). http://creativecommons.org/licenses/by/4.0/
Abstract
Because falls among the elderly can cause serious injury leading to a bedridden state, methods to maintain motor function in the elderly and prevent falls are important. Among falls by the elderly are tripping falls, in which the forefoot gets caught on the floor to cause the fall. Minimum foot clearance (MFC), the smallest distance between the floor and the foot during the swing phase of gait, has been given attention as a cause of tripping falls, as elderly people at risk of falling have been reported to have low MFC. No research has been done, however, to examine what geriatric factors determine MFC. In this study, various measurements were taken on muscle strength, joint angles, and other characteristics as factors possibly influencing the height of MFC, a multiple re-gression analysis was performed with MFC as the dependent variable, and those factors with high degrees of influence were extracted. The results revealed that the height of MFC is highly influ-enced by strength of the hip flexors and angle of ankle dorsiflexion. The results of this study should be taken into consideration when having elderly people do fall prevention training.
Keywords
Eldery, Fall Prevention, Minimum Foot Clearance, Multiple Regression Analysis
1. Introduction
Many factors contribute to the risk of falling as one ages, such as deterioration of the motor apparatus, dizzi-ness or other symptoms due to poor function of sensory receptors, effects of medications, and lack of sleep [4] [5].
Fractures reportedly occur in 17.6% of falls by the elderly, caused by changes in gait due to aging [6]. Trip-ping falls account for 28% of these, due to a decrease in minimum foot clearance (MFC) between the forefoot and the floor during swing phase, so a decrease in MFC has been reported to be related to falls [7]-[11].
To lower the incidence of falls in the elderly, a number of exercises have been reported [3] to have preventive effects, but no studies have yet looked at MFC. We looked at MFC in the present study, carrying out an analysis on factors related to decreased MFC as well as factors related to muscle strength and lower extremity joint an-gles. We hypothesized that MFC would be affected by the factors of decreased hip and knee flexor strength, de-creased ankle dorsiflexion strength, as well as decreases of hip and knee flexion angles and of ankle dorsiflexion angle during swing phase. We investigated which factors among these variables most greatly affect MFC.
Knowing which variables strongly affect MFC would be promising in developing well focused exercise pro-grams to prevent tripping falls by elderly people.
The purpose of this study was to kinesiologically clarify the strength factors and joint angle factors that influ-ence MFC.
2. Methods
2.1. ParticipantsFifty-four community-dwelling elderly people answered our call for participation. Participants were to sign the agreement.
None of them had problems with cognitive function or had undergone surgery in the lower extremities, so they were regarded as healthy (Table 1).
The present study was conducted after receiving the approval of the Tohoku Fukushi University research eth-ics committee (approval no.: RS1307124).
2.2. Experimental Set-Up and Procedure
Movements of the right leg during gait were measured with a three-dimensional movement data capture system at a sampling rate of 100 Hz. The collected data were imported into a movement analysis software system and gait cycles were determined from identifying instances of heel contact and toe off. Gait data and MFC were then extracted from this information.
The walkway for analysis was 11 m long, with the first 4 m used for acceleration, the next 4 m used for actual measurement, and the final 3 m for deceleration. The participants walked with socks on, practicing walking on the walkway a few times before being requested to walk at usual speed, which they did three times for data col-lection.
2.2.1. Marker Position
[image:2.595.89.539.604.710.2]Reflective markers 25 mm in diameter were applied to 27 locations: top of the head, forehead, occiput, both shoulders, both elbows, both wrists, both anterior superior iliac spines, the sacrum, both greater trochanters, both knees, both lateral malleoli, the metatarsophalangeal joints of both second metatarsals, both heels, the back, both
Table 1.Baseline characteristics of trial participants.
Variable Participants (n = 54)
Female (%) 78
Age (years) 69.61 (5.47)
Height (cm) 156.59 (7.80)
Weight (kg) 63.86 (10.98)
Body mass index (BMI) 25.93 (3.20)
Motor fitness scale (MFS) 11.86 (2.32)
femora, and both lower legs.
2.2.2. Gait Cycle
In the gait cycle, based on right leg movement, initial contact was the lowest point of the heel marker at the end of swing phase and pre-swing was the point when the marker over the dorsum of the second metatarsal just be-gan to ascend after reaching its lowest point at the end of stance phase. Data were extracted for the left leg in the same manner. Four strides taken during gait on the platform were used as gait data.
2.2.3. Range of Motion
All measurements of range of motion were performed by one physical therapist, who had over 30 years of clini-cal experience. With the parts to be measured exposed, the participant lay supine on a bed while knee extension and ankle dorsiflexion were measured with a goniometer. Considering the effect of two-joint muscles, two dif-ferent measurements were made for range of ankle dorsiflexion, one with the knee extended and the other with the knee flexed [12].
2.2.4. Minimum Foot Clearance (MFC)
At the beginning, with the participant in a relaxed standing position, the height from the floor of the reflective marker on the dorsum of the right metatarsophalangeal joint was measured. Then, after the gait data were col-lected, the height from the floor of the reflective marker on the dorsum of the right metatarsophalangeal joint during relaxed standing was subtracted from the height of the same marker seen from the sagittal view during right swing phase, and MFC was determined from that.
2.2.5. Muscle Force
With a force sensor, strength was measured for hip flexion, knee flexion and extension, and ankle dorsiflexion. Data from the force sensor were obtained from an analysis apparatus via an amplifier. The sampling rate was 1 KHz.
The force sensor was affixed to a metal folding chair with wire, and then connected via a cuff to the body part to be measured. The cuff and wiring were adjusted so that strength could be measured midway between the ex-tremes of the range of motion of the joint concerned. For each strength measurement, three repetitions were ob-tained of maximal effort over about five seconds. Each strength determination was preceded by a few practice trials. The values obtained were normalized by dividing by the participant’s body weight.
Hip flexion: The participant sat in the folding chair and a cuff was wrapped around the mid-thigh of the side to be measured. A cable attached to the cuff went vertically downward and was routed by a pulley at the bottom of the chair to the force sensor. The participant placed the contralateral foot on the floor and used that foot and the seat of the chair for support while flexing the ipsilateral hip. The participant was instructed not to let the trunk flex laterally or extend at that time.
Knee extension: With the participant sitting on the folding chair, the force sensor was bound to the frame of the chair with wire. With the knee at 90˚, a cuff was placed around the distal part of the lower leg on the side to be measured. A cable of adjusted length was run between the cuff and the force sensor. The contralateral leg was placed on the floor to provide firm support while the ipsilateral foot was slightly raised and ipsilateral knee ex-tension was attempted. The participant was cautioned at that time about compensatory movements such as trunk lateral flexion.
Ankle Dorsiflexion: The participant sat on the floor with the legs out in front in a long sitting position. The chair with the force sensor was placed directly in front of the foot to be measured and fixed firmly there. A cuff connected to the force sensor was placed around the forefoot, contraction of the tibialis anterior was confirmed, and the participant dorsiflexed at the ankle. The participant was cautioned about compensatory movements such as trunk extension, and a cushion was placed beneath the popliteal fossa, putting the knee in slight flexion.
2.3. Statistics
Bilateral differences in strength and range of motion were examined with paired t-tests.
variables as independent variables to find factors that influence MFC.
SPSS software was used for statistical analysis with the level of significance set at p = 0.05. The probabilities for stepwise insertion were set at F ≤ 0.05 and for removal at F ≤ 0.10.
3. Results
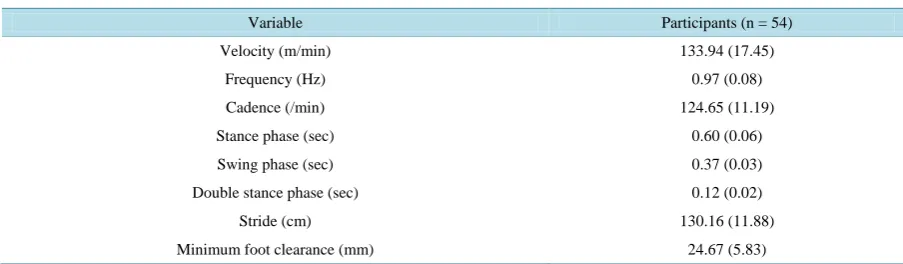
3.1. MFCMFC was found by looking for the valley between two peaks. Mean MFC was 24.67 mm ± 5.83 mm, occurring at 58.81% ± 7.03% of swing phase in the gait cycle (Table 2).
3.2. ROM
No bilateral differences were seen in ROM, although knee extension was −1.48˚ ± 4.08˚ on the right and −1.76˚ ± 4.77˚ on the left (Table 3).
3.3. Muscle Force
[image:4.595.85.537.325.457.2]The only bilateral difference seen in isometric strength was hip flexion being significantly stronger on the right than on the left (p = 0.01) (Table 4).
Table 2.Characteristics of trial walking parameters.
Variable Participants (n = 54)
Velocity (m/min) 133.94 (17.45)
Frequency (Hz) 0.97 (0.08)
Cadence (/min) 124.65 (11.19)
Stance phase (sec) 0.60 (0.06)
Swing phase (sec) 0.37 (0.03)
Double stance phase (sec) 0.12 (0.02)
Stride (cm) 130.16 (11.88)
Minimum foot clearance (mm) 24.67 (5.83)
Values are mean (standard deviation).
Table 3.Characteristics of range of motion.
Variable Right Left p values
*
Right vs Left
Ankle dorsiflexion
Knee bended (deg) 20.28 (7.62) 20.93 (7.60) 0.31
Ankle dorsiflexion
Knee extended (deg) 7.41 (5.81) 7.60 (5.39) 0.64
Knee extension (deg) −1.48 (4.08) −1.76 (4.77) 0.37
[image:4.595.87.538.618.705.2]Values are mean (standard deviation)*paired t-test.
Table 4.Characteristics of muscle force.
Variable Right Left p values
*
Right vs Left
Hip flexion (% KgBW) 18.27 (5.88) 17.06 (5.41) <0.01
Knee extension (% KgBW) 31.33 (11.65) 29.92 (11.60) 0.13
Knee flexion (% KgBW) 17.12 (5.50) 17.13 (5.70) 0.98
Ankle dorsiflexion (% KgBW) 21.71 (6.13) 21.68 (8.71) 0.96
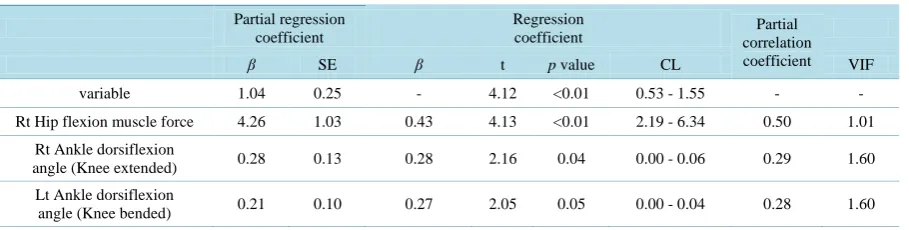
Table 6. Result of multiple regression analysis.
Partial regression coefficient
Regression
coefficient correlation Partial
coefficient
β SE β t p value CL VIF
variable 1.04 0.25 - 4.12 <0.01 0.53 - 1.55 - -
Rt Hip flexion muscle force 4.26 1.03 0.43 4.13 <0.01 2.19 - 6.34 0.50 1.01
Rt Ankle dorsiflexion
angle (Knee extended) 0.28 0.13 0.28 2.16 0.04 0.00 - 0.06 0.29 1.60
Lt Ankle dorsiflexion
angle (Knee bended) 0.21 0.10 0.27 2.05 0.05 0.00 - 0.04 0.28 1.60
ANOVA p < 0.01; R = 0.68, R2 = 0.46, Multiple correlation coefficient adjusted R2 = 0.43; Durbin-Watson = 1.57.
3.4. Multiple Regression Analysis
Pearson’s product-moment correlation coefficients were calculated for correlations between all variables (Table 5). Variables with significant differences were subject to multiple regression with MFC as the dependent varia-ble. The predictors in the resulting model were right hip flexion strength (β = 0.43, p < 0.01), right dorsiflexion angle with the right knee extended (β = 0.28, p = 0.04), and left dorsiflexion angle with the left knee flexed (β = 0.27, p = 0.04) (Table 6).
4. Discussion
Compared to younger people, according to previous studies, the gait of elderly people has decreased velocity, MFC, hip and knee angles, and arm swing, while double support phase is longer [7][8]. These changes are re-garded as important indicators of the onset of frailty in the elderly [13]. MFC is especially important in that, as the lowest position of the foot near the floor during swing phase, it maintains the height of the foot in swing phase.
According to studies on muscle activity during gait, the hip flexors exhibit considerable activity from the be-ginning through the middle of swing phase, a momentary effort to propel the swing leg forward [14]-[16].
In connection with this, the present study shows that strength of the hip flexors influences the height of MFC. Regarding the ankle joint and causes of decreased step length in the elderly, studies have reported that de-creased strength of ankle dorsiflexion, hip extension, and hip flexion contribute to shorter step length and slower gait velocity [17]. Up to now studies have centered on lower extremity muscle strength, but the present study shows that the influence of joint range of motion on muscle strength should also be taken into consideration.
The present study confirms that hip flexion strength and ankle dorsiflexion range are important factors in the decrease of MFC in geriatric gait. Thus, when planning a program to improve motor function in an elderly per-son, a wider perspective should be taken than that of just strengthening muscles, as the excursion of ankle dor-siflexion should also be included.
Limitations of the Study
Since this study was done with active healthy elderly people, it cannot directly address what might be known from investigating inactive elderly people or from looking at gender differences.
5. Conclusion
The associations of hip flexor strength and ankle dorsiflexion range of motion were seen as decisive factors of MFC. This use of MFC as an assessment indicator of likelihood to fall suggests that a program to improve hip flexion strength and ankle dorsiflexion range would be an effective way to set up a program to improve MFC.
Acknowledgements
We gratefully acknowledge all participants in this study. We gratefully acknowledge all participants in this study.
Author Disclosure Statement
No competing financial interests exist.
References
[1] Ministry of Health, L.a.W., Annual Health, Labour and Welfare Report 2011-2012. Gyosei Corp. http://www.mhlw.go.jp/english/wp/wp-hw6/index.html
[2] Julia, L. (2006) Age in the Welfare State: The Origins of Social Spending on Pensioners, Workers, and Children. Cambridge University Press, Cambridge, 246.
[3] Gillespie, L.D., et al. (2012) Interventions for Preventing Falls in Older People Living in the Community. In: Cochrane Database of Systematic Reviews, John Wiley & Sons Ltd., Chichester.
http://dx.doi.org/10.1002/14651858.CD007146.pub3
[4] Joseph, C.M., Lewis, S. and Leslie, W. (1997) Gait Disorders of Aging: Falls and Therapeutic Strategies. Lippincott Williams & Wilkins, Philadelphia.
[5] Graafmans, W.C., et al. (1996) Falls in the Elderly: A Prospective Study of Risk Factors and Risk Profiles. American Journal of Epidemiology, 143, 1129-1136. http://dx.doi.org/10.1093/oxfordjournals.aje.a008690
[6] Haga, H., et al. (1986) Falls in the Institutionalized Elderly in Japan. Archives of Gerontology and Geriatrics, 5, 1-9. http://dx.doi.org/10.1016/0167-4943(86)90002-6
[7] Elble, R.J., et al. (1991) Stride-Dependent Changes in Gait of Older People. Journal of Neurology, 238, 1-5. http://dx.doi.org/10.1007/BF00319700
[8] Maki, B.E. (1997) Gait Changes in Older Adults: Predictors of Falls or Indicators of Fear. J Am GeriatrSoc, 45, 313-320. http://dx.doi.org/10.1111/j.1532-5415.1997.tb00946.x
[9] Elble, R., Hughes, L. and Higgins, C. (1992) The Syndrome of Senile Gait. Journal of Neurology, 239, 71-75. http://dx.doi.org/10.1007/BF00862975
[10] Aoyagi, K., et al. (1998) Falls among Community-Dwelling Elderly in Japan. Journal of Bone and Mineral Research,
13, 1468-1474. http://dx.doi.org/10.1359/jbmr.1998.13.9.1468
[11] Chiba, H., et al. (2005) Differential Gait Kinematics between Fallers and Non-Fallers in Community-Dwelling Elderly People. Geriatrics & Gerontology International, 5, 127-134. http://dx.doi.org/10.1111/j.1447-0594.2005.00281.x [12] Norkin, C.C. and White, D.J. (2009) Measurement of Joint Motion: A Guide to Goniometry. F a Davis.
[13] Hausdorff, J.M., et al. (1997) Increased Gait Unsteadiness in Community-Dwelling Elderly Fallers. Archives of Physi-cal Medicine and Rehabilitation, 78, 278-283. http://dx.doi.org/10.1016/S0003-9993(97)90034-4
[14] Andersson, E.A., Nilsson, J. and Thorstensson, A. (1997) Intramuscular EMG from the Hip Flexor Muscles during Human Locomotion. Acta Physiologica Scandinavica, 161, 361-370.
http://dx.doi.org/10.1046/j.1365-201X.1997.00225.x
[15] Perry, J. and Burnfield, J.M. (2010) GAIT ANALYSIS. Normal and Pathological Function. SLACK Inc., Thorofare, 152-153.
[16] Fox, M.D. and Delp, S.L. (2010) Contributions of Muscles and Passive Dynamics to Swing Initiation over a Range of Walking Speeds. Journal of Biomechanics, 43, 1450-1455. http://dx.doi.org/10.1016/j.jbiomech.2010.02.009