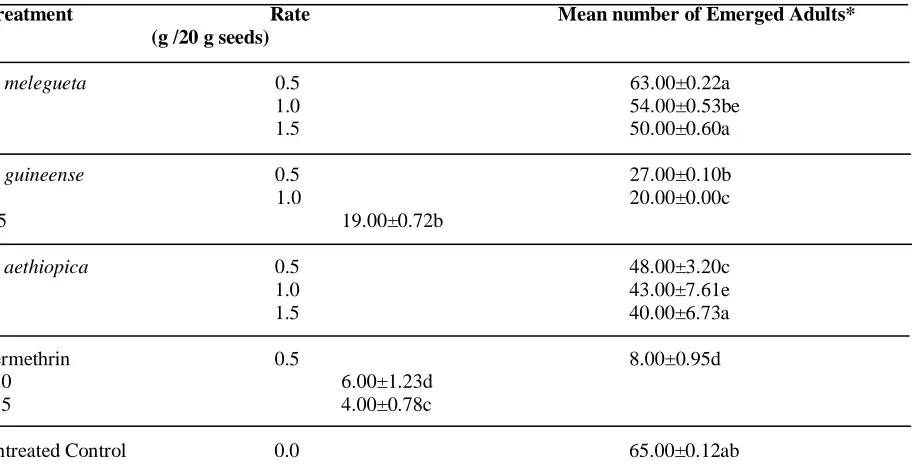
Effect of Seed Powder of Three Pepper Species on the Bionomics of Cowpea Bruchid, Callosobruchus maculatus Fabricius
Full text
Figure


Related documents
Priest : Let us pray; Father, you have made the bond of marriage a Holy mystery, a symbol of Christ’s love for His church.. With faith in you and in each other,
Mexico’s cohabitation boom of the 2000s was driven by cohorts born after 1975, whose cohabiting unions are less likely to transition to marriage than those formed by earlier
The higher the frequency of the ultrasonics the more evenly this energy is distributed throughout the tank, and the smaller the cavitation vacuoles is when they collapse.. This
The path for Y K,t falls below that for hyperbolic preferences for an initial period, and hence the shadow price of capital is higher (Figure 3), the future cost of abatement
To draw this comparison we will construct a saving rule for the transition path which implies ˙q(t) = 0 at the moment of switching to the Hartwick’s curve and which also is “close”
While analyzing studies of SCIT, 24 prospective, randomized, studies involving 962 asthmatic patients was performed and showed a significant improvement in symptoms and drug
Specifically, we aimed to study the effects of four parameters on the GS accuracy: (1) the relationship between training and test sets: we used three methods to define the
Mean false-positive results as a function of proportion of maximum Bayes factor or minimum P value over 100 replicated data sets and a dominant model.. Different curves correspond
