0095-1137/05/$08.00⫹0 doi:10.1128/JCM.43.8.3829–3834.2005
Copyright © 2005, American Society for Microbiology. All Rights Reserved.
Analysis of the Comparative Workflow and Performance
Characteristics of the VITEK 2 and Phoenix Systems
U. Eigner, A. Schmid, U. Wild, D. Bertsch, and A.-M. Fahr*
Department of Microbiology, Laboratory Group Heidelberg, D-69126 Heidelberg, Germany
Received 24 November 2004/Returned for modification 4 January 2005/Accepted 2 May 2005
The VITEK 2 (bioMe´rieux, Marcy LⴕE`toile, France) and the Phoenix systems (BD Diagnostic Systems, Sparks, Md.) are automated instruments for rapid organism identification and susceptibility testing. We evaluated the workflow, the time to result, and the performance of identification and susceptibility testing of both instruments. A total of 307 fresh clinical isolates were tested: 141Enterobacteriaceae, 22 nonfermenters,
93Staphylococcusspp., and 51Enterococcusspp. Manipulation time was measured in batches, each with seven
isolates, for a total of 39 batches. The mean (ⴞstandard deviation [SD]) manipulation time per batch was 20.9 ⴞ1.8 min for Phoenix and 10.6ⴞ1.0 min for VITEK 2 (P< 0.001). Mean (ⴞSD) time to result for all bacterial groups was 727ⴞ162 min for Phoenix and 506ⴞ120 min for VITEK 2 (P< 0.001). Concerning identification, Phoenix and VITEK 2 yielded the same results for nonfermenters (100%), staphylococci (97%), and enterococci (100%). For 140Enterobacteriaceaestrains evaluated, 135 (96%) were correctly identified by Phoenix and 137 (98%) by VITEK 2 (Pⴝ0.72). The overall category agreement for all isolates was 97.0% for both instruments. The minor error rate, major error rate, and very major error rate for all bacterial isolates tested were 3.0, 0.3, and 0.6 and 2.8, 0.2, and 1.7 for Phoenix and VITEK 2, respectively (Pvalues of 0.76, 0.75, and 0.09). The VITEK 2 system required less manual manipulation time and less time than the Phoenix system to yield results.
Automated identification and susceptibility test systems sig-nificantly advanced clinical microbiology. Fast and reliable re-sults which improve clinical outcomes and the reduction of costs have been noted by several authors (2, 3, 5). Various systems have been presented during the last years, such as the
Vitek Classic (bioMe´rieux, Marcy L⬘E` toile, France), the more
automated VITEK 2 (bioMe´rieux) and Microscan Walkaway
(Dade-Behring MicroScan, Sacramento, CA), and the recently developed Phoenix system (BD Diagnostic Systems, Sparks, Md.).
Fast results provided by these instruments are not only due to short incubation times for identification (ID) and antimi-crobial susceptibility testing (AST) of bacterial isolates but also to hands-on time for setting up the different devices. We com-pared the different manipulation steps required by the VITEK 2 and Phoenix systems for setting up bacterial isolates for ID and AST. Additionally, the time to result was recorded for each system. The workflow analysis was the main focus of this evaluation; however, efficient workflow must generate accurate results. Therefore, performance characteristics with regard to ID and AST were also investigated. ID results were compared
to API systems (bioMe´rieux), and AST results were compared
to standard broth microdilution as recommended by the Na-tional Committee for Clinical Laboratory Standards (NCCLS) (14).
(The findings of this study were partly presented at the 103rd Gen. Meet. Am. Soc. Microbiol., abstr. C-250, 2003.)
MATERIALS AND METHODS
Bacterial isolates.A total of 307 fresh clinical isolates comprising 141 strains of the family Enterobacteriaceae, 22 nonfermenting gram-negative bacilli (NFGNB), 93Staphylococcusspp., and 51Enterococcusspp. were tested in this study (Table 1). The clinical strains were collected in the routine lab of the Laboratory Group Heidelberg from various specimens (blood cultures, wound specimens, tracheal aspirates, and urine).
The collection included various phenotypes with special resistance mecha-nisms: 11Enterobacteriaceaeisolates with extended-spectrum beta-lactamases (ESBL), 18 methicillin-resistantStaphylococcus aureus(MRSA) isolates, and 18 methicillin-resistant coagulase-negativeStaphylococcusspp. Prior to testing, each isolate was subcultured twice on Columbia agar with 5% defibrinated sheep blood (Unipath, Wesel, Germany). Manipulation time was measured in batches, each with seven isolates. Thirty-nine (39) batches, comprising a total of 273 isolates, were tested. For all 307 isolates time to results (TTR) and ID and AST performance was evaluated.
Phoenix.For the Phoenix system, the combined ID and AST NMIC/ID 14 panel for gram-negative bacilli and the PMIC/ID 13 panel for gram-positive cocci were used. The setup of the panels was performed according to the manufac-turer’s instructions. The Phoenix ID broth was inoculated with bacterial colonies from Columbia blood agar and adjusted to a 0.5 to 0.6 McFarland standard using the Crystal Spec Nephelometer (BD Diagnostic Systems). After supplementing the AST broth with one drop of indicator dye, 25l of the ID suspension was transferred to the AST broth to achieve a final inoculum density of 1.5⫻108
CFU/ml. The ID and the AST broths were poured into the respective side of the panel placed on the Phoenix inoculation station. The inoculated panels were closed and placed into the transport caddy, and, after entering the accession number, the panels were placed into the Phoenix instrument.
VITEK 2. For ID testing with VITEK 2, the ID-GPC card was used for gram-positive cocci and the ID-GNB card was used for gram-negative rods. For AST, the AST-P 523 panel was used for gram-positive cocci and the AST-N021 card was used for gram-negative bacilli. A sufficient number of colonies was suspended in sterile saline (0.45%) and adjusted to a 0.5 McFarland turbidity standard using the DensiChek Densitometer (bioMe´rieux). The inoculated tube was placed in a cassette on the VITEK 2 Smart Carrier Station. The sample number was entered and associated with an ID and AST card. The sample accession numbers and card identification bar code numbers were scanned, and the information was stored on the cassette memory chip. The SCS cassette with the cards and the test tubes was placed on the VITEK 2 instrument where the inoculation of the AST cards was automatically performed by the instrument.
* Corresponding author. Mailing address: Im Breitspiel 15, D-69126 Heidelberg, Germany. Phone: 3432-192. Fax: 0049-6221-3432-263. E-mail: [email protected]
3829
on May 15, 2020 by guest
http://jcm.asm.org/
Antibiotics.The following antimicrobial agents were tested: for Enterobacte-riaceaeand NFGNB, ampicillin, piperacillin, piperacillin-tazobactam, mero-penem, cephazolin, cefuroxime, ceftazidime, cefepime, and levofloxacin; for staphylococci, penicillin, oxacillin, erythromycin, clindamycin, teicoplanin, van-comycin, rifampin, ofloxacin, gentamicin, tetracycline, and cotrimoxazol; for en-terococci, teicoplanin, vancomycin, and tetracycline.
Reference system.For ID, the API 20 E, ID 32 GN, API 32 Staph, and API 32 Strep systems (bioMe´rieux) were used as comparator systems. Frozen microdi-lution panels (Biotest AG, Dreieich, Germany) were used as the reference method for AST. These panels were set up according to NCCLS guidelines (14).
Detection of special resistance mechanisms.MRSA were detected by Oxa-screen Agar (BD Diagnostic Systems). Additionally, the presence of themecA
gene was determined by an in-house PCR test using the following primers: 5⬘-ACA TCT ATT AGG TTA TGT TGG-3⬘and 5⬘TAT ATT CTT CGT TAC TCA TGC-3⬘. Gel electrophoresis was performed for the detection of the 492-bp amplification products. The ESBL resistance mechanism was detected using the combined disk methods recommended by NCCLS (14).
Quality control.The following reference strains were used for AST according to NCCLS guidelines (13):Escherichia coliATCC 25922,E. coliATCC 35218,
Pseudomonas aeruginosaATCC 27853,S. aureusATCC 29213,Enterococcus faecalisATCC 29212,S. aureusATCC 43300, andKlebsiella pneumoniaeATCC 700603.
Workflow.The average manipulation time required to set up each system was determined for 39 batches of seven organisms each. Two skilled technicians were involved in the practical procedure. Using a stopwatch, all steps were timed by an observer not involved in the testing process. The following steps associated with the workflow were included: preparation of bench and devices, adjustment of McFarland standard of 0.5 to 0.6 with bacterial inoculum, setup of VITEK 2 cards and Phoenix panels, loading of the system, entry of accession numbers, and the follow-up work. The details associated with the manipulation steps are provided in Table 2. Considering that the procedures of both systems are not exactly identical, similar workflow steps were directly compared, whereas differ-ing steps are mentioned separately. Additionally, the time for maintenance of both instruments was measured twice during the study of approximately two month.
[image:2.585.45.284.67.217.2]Data analysis.For workflow analysis the average time to perform each step was calculated over the 39 batches. After completing analysis to determine an appropriate statistical approach a one-way analysis of variance test was applied to compare the workflow times of the two systems. AST data indicated a similar
TABLE 1. Isolates tested
Isolatea n
Escherichia coli(ESBL pos.)... 4
Escherichia coli(ESBL neg.) ... 26
Klebsiellaspp. (ESBL pos.) ... 7
Klebsiellaspp. (ESBL neg.)... 29
Proteusspp. ... 16
Providenicaspp. ... 5
Serratiaspp. ... 15
Citrobacterspp. ... 9
Enterobacterspp... 17
Morganella morganii... 8
OtherEnterobacteriaceae... 5
Pseudomonasspp... 14
Acinetobacterspp. ... 8
Total...163
MRSA... 31
MSSAb... 18
S. epidermidis... 22
S. haemolyticus... 8
S. lugdunensis... 2
S. simulans... 3
S. sciuri... 1
S. saprophyticus... 1
S. capitis... 1
Other CoNSc... 6
E. faecalis... 50
E. faecium... 1
Total...144
[image:2.585.48.540.455.709.2]apos., positive; neg., negative. bMSSA, methcillin-sensitiveS. aureus. cCoNS, coagulase-negative staphylococci.
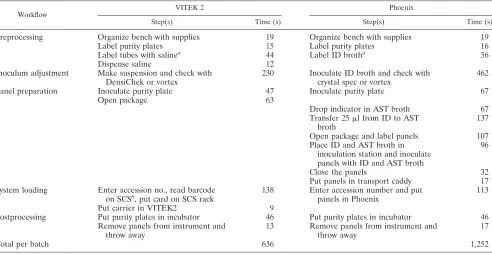
TABLE 2. Average manipulation time of VITEK 2 and Phoenix (calculated for 39 batches, each with seven isolates)
Workflow VITEK 2 Phoenix
Step(s) Time (s) Step(s) Time (s)
Preprocessing Organize bench with supplies 19 Organize bench with supplies 19
Label purity plates 15 Label purity plates 16
Label tubes with salinea 44 Label ID brotha 56
Dispense saline 12
Inoculum adjustment Make suspension and check with DensiChek or vortex
230 Inoculate ID broth and check with crystal spec or vortex
462
Panel preparation Inoculate purity plate 47 Inoculate purity plate 67
Open package 63
Drop indicator in AST broth 67 Transfer 25l from ID to AST
broth
137
Open package and label panels 107 Place ID and AST broth in
inoculation station and inoculate panels with ID and AST broth
96
Close the panels 32
Put panels in transport caddy 17 System loading Enter accession no., read barcode
on SCSb, put card on SCS rack
138 Enter accession number and put panels in Phoenix
113
Put carrier in VITEK2 9
Postprocessing Put purity plates in incubator 46 Put purity plates in incubator 46 Remove panels from instrument and
throw away
13 Remove panels from instrument and throw away
17
Total per batch 636 1,252
aLabeling was done for the study but is optional for routine procedures. bSCS, smart carrier station.
on May 15, 2020 by guest
http://jcm.asm.org/
approach was reasonable to assess differences between the average TTR for the VITEK 2 and Phoenix systems. Thus, a one-way analysis of variance test with multiple comparisons was used. To examine the accuracy of clinical interpreta-tions, the rates of correct ID were compared for each organism group. For AST, category agreement (CA), minor errors (mE), major errors (ME), and very major errors (VME) were calculated as defined by the U.S. Food and Drug Administration guidance document for each organism group (4). Differences between correct ID, CA, and error rates were evaluated for significance using Fisher’s exact test.
RESULTS
Workflow.The results of the different steps of the manipu-lation time are shown in Table 2. The steps associated with the workflow of each system were timed for 39 batches of seven
organisms. The mean time⫾standard deviation (SD) of 20.9
⫾1.8 min per batch for Phoenix was significantly longer than
10.6 min⫾1.0 min per batch for VITEK 2 (P⬍0.001). The
mean time to prepare one isolate using the Phoenix system was 3.0 min and for VITEK 2 was 1.5 min, resulting in a time savings of 1.5 min per organism. The mean values of the two measurements of the instrument maintenance are included in Table 3. Over a 30-day period the Phoenix instrument required 21.2 min for maintenance and the VITEK 2 required 63.2 min.
TTR.TTR data of the completed ID and AST results are
included in Table 4. Mean (⫾SD) AST results for
Enterobac-teriaceae, NFGNB, staphylococci, and enterococci were
avail-able in 701⫾154 min, 851⫾134 min, 775⫾161 min, and 660
⫾145 min with the Phoenix instrument; with VITEK 2 results
were obtained in 451⫾76 min, 679⫾178 min, 514⫾123 min,
and 566⫾71 min, respectively. For each bacterial group the
mean TTR was significantly greater for Phoenix when
com-pared to VITEK 2 (all P values were ⬍0.001). The overall
mean (⫾SD) TTR for the Phoenix system was 727⫾162 min,
significantly higher than the result of 506⫾120 min for the
VITEK 2 system. Analysis of the TTR differences from pairing by organisms for all strains indicated that the overall mean
difference between results was 221 min longer for Phoenix (P
⬍0.001).
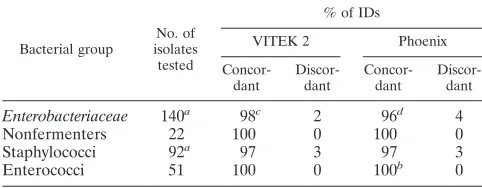
ID.Of the 141Enterobacteriaceaestrains tested, 135 (96%)
were correctly identified by the Phoenix system and 137 (98%) were correctly identified by the VITEK 2 system; both systems identified 100% of the 22 NFGNB tested (Table 4). For staph-ylococci, both systems achieved an accuracy of 97% for 93
isolates tested. Two strains (oneEnterobacteriaceaeisolate, one
Staphylococcusspp.) could not be resolved by the API refer-ence method and were therefore not used for evaluation. For 51 enterococci, both systems correctly identified 100% of the isolates to the species level. Two of the species required mo-tility tests to resolve correct ID of the isolates.
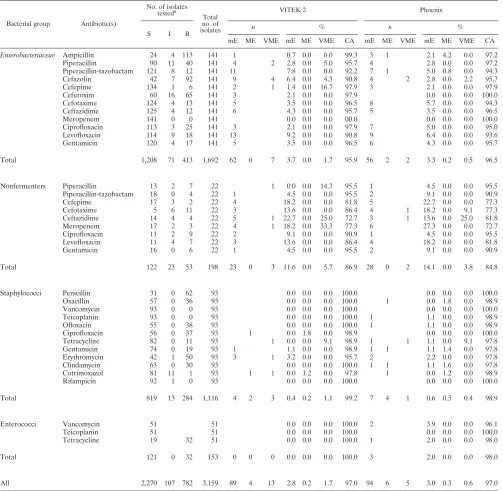
AST. The overall category agreement for all isolates was
97.0% for both instruments. The minor error rates, major error rates, and very major error rates for all bacterial isolates tested were 3.0, 0.3, and 0.6 and 2.8, 0.2, and 1.7 for Phoenix and
VITEK 2, respectively (Pvalues of 0.76, 0.75, and 0.09). The
AST results of all single antimicrobials and organisms included in this study are shown in Table 5. The 11 ESBL-producing
Enterobacteriaceaeisolates were correctly detected by Phoenix;
VITEK 2 missed oneK. oxytoca isolate. The oxacillin
resis-tance mechanism was correctly detected by both systems.
DISCUSSION
The main purpose of this study was to compare the setup workflow for the Phoenix and the VITEK 2 systems. However, in addition to efficient workflow, the TTR and reliability of the AST and ID results are also of importance. Therefore, the accuracy of ID and the AST performance parameters were calculated and are discussed.
Workflow. An important issue when conducting workflow comparative studies is the experience of the technicians with each system. Our technicians were well trained and experi-enced in the operation of both systems, as several previous studies have been performed with both of these systems (7 and U. Eigner, A. Caganic, D. Schuhmacher, R. Englert, and A. M. Fahr, Abstr. 99th Gen. Meet. Am. Soc. Microbiol. 1999, abstr. C-85, 1999, and A. M. Fahr, U. Wild, and U. Eigner, Abstr. 13th Eur. Cong. Clin. Microbiol. Infect. Dis. 2003, abstr. P-755, 2003). In this study, the mean time to set up one bacterial isolate was 3.0 min for the Phoenix system and 1.5 min for the
[image:3.585.57.542.82.185.2]VITEK 2 system (P⬍0.001). The longer hands-on time for the
TABLE 3. Maintenance of instruments
Interval
Automated instrument
VITEK 2 Phoenix
Step Time (min:s) Step Time (min:s)
Daily Temperature 00:15
Calibration of CrystalSpec 00:25 Every 3 days Filling of tips and changing of NaCl bags 02:00
Weekly Cleaning of optic system 07:00
[image:3.585.42.283.598.692.2]Monthly Calibration of DensiCheck 00:11 Signal lamps, acoustic and visual alarms 01:13 Cleaning carousel, boats, optical devices 15:00
TABLE 4. Identification results for VITEK 2 and Phoenix
Bacterial group
No. of isolates tested
% of IDs
VITEK 2 Phoenix
Concor-dant
Discor-dant
Concor-dant
Discor-dant
Enterobacteriaceae 140a 98c 2 96d 4
Nonfermenters 22 100 0 100 0
Staphylococci 92a 97 3 97 3
Enterococci 51 100 0 100b 0
aOne isolate was not solved by the reference method. bMotility test solved two discrepancies.
cThree isolates incorrect for genus.
dThree isolates incorrect for genus, two isolates incorrect only for species.
on May 15, 2020 by guest
http://jcm.asm.org/
Phoenix instrument was mainly due to the additional manual
steps of transferring 25l of ID broth to AST broth, dropping
of the indicator dye into the AST broth, inoculating the panels with the respective broth, closing the panels, placing the panels in the transport caddy, and entering the panels into the instru-ment. Additionally, setting up the McFarland standard with CrystalSpec was more time-consuming compared to Den-siChek. According to BD Diagnostic Systems this will be im-proved with a new version in the near future.
Meyer et al. performed a timed workflow study comparing the Phoenix instrument with the Microscan Walkaway-96
[image:4.585.43.546.81.572.2](W. A. Meyer III, D. Lockwood, W. Brasso, and J. Reuben, Abstr 100th Gen. Meet. Am. Soc. Microbiol. 2000, abstr. C-309, 2000). The following workflow steps were measured to process 50 isolates: logging of isolates into ID and AST system (3.3 min), manual labeling of the panels (7.7 min), inoculation of panels (14.6 min), and the loading of the panels into the instrument (3.8 min). These selected values were similar to our respective manipulation steps. Unfortunately the inoculum preparation time was not evaluated in this study due to the significant differences between the processes normally associ-ated with overnight ID and AST analysis (Microscan) and
TABLE 5. Susceptibility test results for VITEK 2 and Phoenix
Bacterial group Antibiotic(s)
No. of isolates testeda
Total no. of isolates
VITEK 2 Phoenix
S I R
n % n %
mE ME VME mE ME VME CA mE ME VME mE ME VME CA
Enterobacteriaceae Ampicillin 24 4 113 141 1 0.7 0.0 0.0 99.3 3 1 2.1 4.2 0.0 97.2 Piperacillin 90 11 40 141 4 2 2.8 0.0 5.0 95.7 4 2.8 0.0 0.0 97.2 Piperacillin-tazobactam 121 8 12 141 11 7.8 0.0 0.0 92.2 7 1 5.0 0.8 0.0 94.3 Cefazolin 42 7 92 141 9 4 6.4 0.0 4.3 90.8 4 2 2.8 0.0 2.2 95.7 Cefepime 134 1 6 141 2 1 1.4 0.0 16.7 97.9 3 2.1 0.0 0.0 97.9 Cefuroxim 60 16 65 141 3 2.1 0.0 0.0 97.9 0.0 0.0 0.0 100.0 Cefotaxime 124 4 13 141 5 3.5 0.0 0.0 96.5 8 5.7 0.0 0.0 94.3 Ceftazidime 125 4 12 141 6 4.3 0.0 0.0 95.7 5 3.5 0.0 0.0 96.5 Meropenem 141 0 0 141 0.0 0.0 0.0 00.0 0.0 0.0 0.0 100.0 Ciprofloxacin 113 3 25 141 3 2.1 0.0 0.0 97.9 7 5.0 0.0 0.0 95.0 Levofloxacin 114 9 18 141 13 9.2 0.0 0.0 90.8 9 6.4 0.0 0.0 93.6 Gentamicin 120 4 17 141 5 3.5 0.0 0.0 96.5 6 4.3 0.0 0.0 95.7
Total 1,208 71 413 1,692 62 0 7 3.7 0.0 1.7 95.9 56 2 2 3.3 0.2 0.5 96.5
Nonfermenters Piperacillin 13 2 7 22 1 0.0 0.0 14.3 95.5 1 4.5 0.0 0.0 95.5 Piperacillin-tazobactam 18 0 4 22 1 4.5 0.0 0.0 95.5 2 9.1 0.0 0.0 90.9 Cefepime 17 3 2 22 4 18.2 0.0 0.0 81.8 5 22.7 0.0 0.0 77.3 Cefotaxime 5 6 11 22 3 13.6 0.0 0.0 86.4 4 1 18.2 0.0 9.1 77.3 Ceftazidime 14 4 4 22 5 1 22.7 0.0 25.0 72.7 3 1 13.6 0.0 25.0 81.8 Meropenem 17 2 3 22 4 1 18.2 0.0 33.3 77.3 6 27.3 0.0 0.0 72.7 Ciprofloxacin 11 2 9 22 2 9.1 0.0 0.0 90.9 1 4.5 0.0 0.0 95.5 Levofloxacin 11 4 7 22 3 13.6 0.0 0.0 86.4 4 18.2 0.0 0.0 81.8 Gentamicin 16 0 6 22 1 4.5 0.0 0.0 95.5 2 9.1 0.0 0.0 90.9
Total 122 23 53 198 23 0 3 11.6 0.0 5.7 86.9 28 0 2 14.1 0.0 3.8 84.8
Staphylococci Penicillin 31 0 62 93 0.0 0.0 0.0 100.0 0.0 0.0 0.0 100.0 Oxacillin 57 0 36 93 0.0 0.0 0.0 100.0 1 0.0 1.8 0.0 98.9 Vancomycin 93 0 0 93 0.0 0.0 0.0 100.0 0.0 0.0 0.0 100.0 Teicoplanin 93 0 0 93 0.0 0.0 0.0 100.0 1 1.1 0.0 0.0 98.9 Ofloxacin 55 0 38 93 0.0 0.0 0.0 100.0 1 1.1 0.0 0.0 98.9 Ciprofloxacin 56 0 37 93 1 0.0 1.8 0.0 98.9 0.0 0.0 0.0 100.0 Tetracycline 82 0 11 93 1 0.0 0.0 9.1 98.9 1 1 1.1 0.0 9.1 97.8 Gentamicin 74 0 19 93 1 1.1 0.0 0.0 98.9 1 1 1.1 1.4 0.0 97.8 Erythromycin 42 1 50 93 3 1 3.2 0.0 0.0 95.7 2 2.2 0.0 0.0 97.8 Clindamycin 63 0 30 93 0.0 0.0 0.0 100.0 1 1 1.1 1.6 0.0 97.8 Cotrimoxazol 81 11 1 93 1 1 0.0 1.2 0.0 97.8 1 0.0 1.2 0.0 98.9 Rifampicin 92 1 0 93 0.0 0.0 0.0 100.0 0.0 0.0 0.0 100.0
Total 819 13 284 1,116 4 2 3 0.4 0.2 1.1 99.2 7 4 1 0.6 0.5 0.4 98.9
Enterococci Vancomycin 51 51 0.0 0.0 0.0 100.0 2 3.9 0.0 0.0 96.1
Teicoplanin 51 51 0.0 0.0 0.0 100.0 0.0 0.0 0.0 100.0
Tetracycline 19 32 51 0.0 0.0 0.0 100.0 1 2.0 0.0 0.0 98.0
Total 121 0 32 153 0 0 0 0.0 0.0 0.0 100.0 3 2.0 0.0 0.0 98.0
All 2,270 107 782 3,159 89 4 13 2.8 0.2 1.7 97.0 94 6 5 3.0 0.3 0.6 97.0
aAbbreviations: S, susceptible; I, intermediate; R, resistant.
on May 15, 2020 by guest
http://jcm.asm.org/
“rapid” ID and AST analysis (Phoenix). Therefore, the final results are not comparable to our evaluation, where the dif-ferences between both instruments were mainly due to speci-men inoculum preparation procedures.
Our result of 1.5 min for setting up one isolate for the VITEK 2 instrument is in accordance with other investigators, considering the fact that each study design is slightly different. Larone et al. reported 1.3 min technical hands-on time to set up one isolate with VITEK 2 compared to 1.7 min for VITEK classic and 1.9 min for Microscan (D. H. Larone, L. J. Tucci, and D. O. Samide, Abstr. 100th Gen. Meet. Am. Soc. Micro-biol. 2000, abstr. C-279, 2000). Goessens et al. calculated a mean operating time of 0.9 min per specimen for VITEK 2 and 2.3 min for Microscan Walkaway (W. H. F. Goessens, A. H. J. A. Van Vliet, and H. A. Verbrugh, Abstr. 9th Eur. Cong. Clin. Microbiol. Infect. Dis. 1999, abstr. P-0822, 1999). Abele-Horn et al. reported a time frame of 15.0 to 20.0 min for inoculum preparation and setting up 20 species with the VITEK 2 instrument (0.8 to 1.0 min per isolate), in comparison to 30.0 to 40.0 min with API systems and agar diffusion tests (1.5 to 2.0 min per isolate) (1).
Comparing both instruments, W. S. Seto reported 2.4 min and 2.0 min from initiation of inoculum preparation to loading into the machine with Phoenix and VITEK 2, respectively (personal communication). Silver et al. compared the Phoenix with the VITEK 2 instrument for 325 isolates of staphylococci and also stated that Phoenix required more preparation time than VITEK 2 without showing any detailed data (D. M. Silver, L. Louie, and A. E. Simor, Abstr. 102nd Gen. Meet. Am. Soc. Microbiol. 2002, abstr. C-132, 2002).
TTR.In this study, TTR was determined when the results of
all antibiotics on one card or panel were final. The mean TTR evaluated for the different bacterial groups were significantly longer for Phoenix in comparison to VITEK 2. To our knowl-edge no other direct studies had been published on compara-tive TTR results between both instruments. The results avail-able are from separate studies for each instrument, therefore a comparison with this study is not valid.
For complete ID and AST results with the Phoenix system, Donay et al. required 7.5 h, 16.0 h, 13.0 h, 10.5 h, and 11.0 h for
E. coli, all NFGNB isolates,P. aeruginosa(exclusively),S.
au-reus, andE. faecalis, respectively (6). Endimiani et al. reported
an average TTR of 14.8 h⫾1.6 h for NFGNB and a lower
TTR of 13.0 h⫾1.8 h forAcinetobacter baumannii(7).
With regard to VITEK 2, the results reported in this study were almost in accordance with other evaluations. In a previ-ous study we collected AST TTR for 3,143 fresh clinical iso-lates reported by VITEK 2 in our routine laboratory (A. M. Fahr, U. Eigner, D. Bertsch, M. Kirstahler, M. Holfelder, and A. Turnwald-Maschler, Abstr. 13th Eur. Cong. Clin. Microbiol. Infect. Dis. 2003, abstr. P-760, 2003). The mean TTR for all
bacteria tested was 8.1 h, with 7.2 h for Enterobacteriaceae,
12.1 h for P. aeruginosa, 6.9 h forS. aureus, and 9.0 h for
enterococci. Similar TTR results for VITEK 2 were reported by other working groups (12, 15).
For ID and AST, several studies have compared either the Phoenix or VITEK 2 system with reference methods (1, 6, 7, 8, 9, 10, 11, 12, 13, 15, 16, 17).
ID.Both systems were equally good at identifying all four
bacterial groups examined (96% to 100%). Similar results for
the Phoenix instrument were reported by Stefaniuk et al. and Fahr et al., whereas Donay et al. found results of 89.4% and 86.2% for NFGNB and enterococci (6, 8, 16). For VITEK 2, correct ID results of 95% and 97.8% were reported for routine strains and 88.5% for a challenge set of gram-negative organ-isms (9, 13, 15). Comparing both systems Gross et al. found a concordance of 96% for gram-negative and gram-positive
iso-lates (R. Gross, U. Ho¨rling, and G. Peters et al, Abstr. 12th
Eur. Cong. Clin. Microbiol. Infect. Dis. 2002, abstr. P-703, 2002).
AST. For all bacterial groups the CA was⬎95% for both
instruments, only for NFGNB we observed a CA of 84.8% for Phoenix and 86.9% for VITEK 2. For both instruments similar results were obtained for mE and ME, whereas VITEK 2 had a larger but not significant VME rate compared to Phoenix for
Enterobacteriaceae, NFGNB, and staphylococci. For the
Phoe-nix system similar CA of⬎95% are reported for
Enterobacte-riaceae, staphylococci, and enterococci with a low VME rate of
⬍1.5% (6, 8, 16). ForP. aeruginosa, Donay et al. reported a CA
of 75.8% with a VME rate of 0.3% for Phoenix (6). For VITEK 2 comparable results with our study were reported for
gram-negative isolates (12, 13). For 138 Enterobacteriaceae
tested Pe´rez-Va´zquez et al. observed an essential agreement of
97.8% with a VME rate of 6.1%, mainly due to piperacillin
(15). Good performance in detectingvanA,vanB, andvanC1
resistance mechanisms in enterococci was stated by van den Braak et al. for VITEK 2 (17). Comparing both instruments, Gross et al. showed comparability between Phoenix and VITEK 2 of 94% for all bacterial groups tested (R. Gross et al., 12th Eur. Cong. Clin. Microbiol. Infect. Dis. Abstr. 2002, abstr. P-704, 2002).
In conclusion, the mean setup time for one bacterial isolate was significantly longer with Phoenix when compared to VITEK 2, whereas VITEK 2 required more maintenance time than Phoenix. TTR for all bacterial groups was shorter with VITEK 2 when compared to the Phoenix system, so more results will be available with the VITEK 2 instrument on the same day. VITEK 2 had a larger VME rate than the Phoenix system, the difference being not significant. CA, mE, ME, and correct ID rates were equally good for both systems.
ACKNOWLEDGMENTS
For statistical assistance we acknowledge Michael Ullery. For coor-dination of the study we acknowledge Katharina Ka¨hler and Ce´cile Casado.
This work was partly sponsored by bioMe´rieux, Marcy L⬘E` toile, France.
REFERENCES
1.Abele-Horn, M., S. Suerbaum, and M. Frosch. 2002. Evaluierung des VITEK 2 in der Routinediagnostik. Mikrobiologe12:203–215.
2.Barenfanger, J., C. Drake, and G. Kacich.1999. Clinical and financial benefit of rapid bacterial identification and antimicrobial susceptibility testing. J. Clin. Microbiol.37:1415–1418.
3.Barenfanger, J., M. A. Short, and A. A. Groesch.2001. Improved antimicro-bial interventions have benefits. J. Clin. Microbiol.39:2823–2828. 4.Center for Devices and Radiological Health 2000. Guidelines on review
criteria for assessment of antimicrobial susceptibility devices. U.S. Depart-ment of Health and Human Services, Food and Drug Administration, Wash-ington, D.C.
5.Doern, G., R. Vautour, M. Gaudet, and B. Levy.1994. Clinical impact of rapid in vitro susceptibility testing and bacterial identification. J. Clin. Mi-crobiol.32:1757–1762.
6.Donay, J. L., D. Mathieu, P. Fernandes, C. Pre´germain, P. Bruel, A. Warg-nier, I. Casin, F. X. Weill, P. H. Lagrange, and J. L. Herrmann.2004.
on May 15, 2020 by guest
http://jcm.asm.org/
Evaluation of the automated Phoenix system for potential routine use in the clinical microbiology laboratory. J. Clin. Microbiol.42:1542–1546. 7.Endimiani, A., F. Luzzaro, A. Tamborini, G. Lombardi, V. Elia, R. Belloni,
and A. Toniolo.2002. Identification and antimicrobial susceptibility testing of clinical isolates of nonfermenting gram-negative bacteria by the Phoenix Automated Microbiology System. New Microbiol.25:323–329.
8.Fahr, A. M., U. Eigner, M. Armbrust, A. Caganic, G. Dettori, C. Chezzi, L. Bertoncini, M. Benecchi, and M. G. Menozzi.2003. Two-center collaborative evaluation of the performance of the BD Phoenix automated microbiology system for identification and antimicrobial susceptibility testing of Entero-coccusspp. andStaphylococcusspp. J. Clin. Microbiol.41:1135–1142. 9.Funke, G., D. Monnet, C. deBernadis, A. von Graevenitz, and J. Freney.
1998. Evaluation of the VITEK 2 System for rapid ID of medically relevant gram-negative rods. J. Clin. Microbiol.35:1948–1952.
10.Garcia-Garrotte, F., E. Cercenado, and E. Bouza.2000. Evaluation of a new system, VITEK 2, for ID and AST of enterococci. J. Clin. Microbiol.38:
2108–2111.
11.Jossart, M.-F., and R. J. Courcol.1999. Evaluation of an automated system for identification of Enterobacteriaceae and nonfermenting bacilli. Eur. J. Clin. Microbiol. Infect. Dis.18:902–907.
12.Joyanes, P., M. del Carmen Conejo, L. Martinez-Martinez, and E. J. Perea.
2001. Evaluation of the VITEK 2 system for the identification and suscep-tibility testing of three species of nonfermenting gram-negative rods fre-quently isolated from clinical samples. J. Clin. Microbiol.39:3247–3253. 13.Ling, T. K. W., P. C. Tam, Z. K. Liu, and A. F. B. Cheng.2001. Evaluation
of VITEK 2 rapid identification and susceptibility testing system against gram-negative clinical isolates. J. Clin. Microbiol.39:2964–2966.
14.National Committee for Clinical Laboratory Standards.2002. Performance standards for antimicrobial susceptibility testing, 12th informational supple-ment, vol. 22, no. 1. NCCLS document M100–S12. Approved standard M2– A5. National Committee for Clinical Laboratory Standards, Wayne, Pa. 15.Pe´rez-Va´zquez, M., A. Oliver, B. Sanchez del Saz, E. Loza, F. Baquero, and
R. Canton.2001. Performance of the VITEK 2 system for identification and susceptibility testing of routineEnterobacteriaceaeclinical isolates. Int. J. Antimicrob. Agents17:371–376.
16.Stefaniuk, E., A. Baraniak, M. Gniadkowski, and W. Hryniewicz.2003. Evaluation of the BD Phoenix automated identification and susceptibility testing system in clinical microbiology laboratory practice. Eur. J. Clin. Microbiol. Infect. Dis.22:479–485.
17.van den Braak, N., W. Goessens, A. van Belkum, H. A. Verbrugh, and H. P. Endtz.2001. Accuracy of the VITEK 2 system to detect glycopeptide resis-tance in enterococci. J. Clin. Microbiol.39:351–353.