http://dx.doi.org/10.4236/nr.2014.512063
Groundwater Management in the Esna City,
Upper Egypt: An Application of Remote
Sensing and Numerical Modeling
Manal Abdel Monem1, Abdalla Faid2, Esam Ismail3, Matthias Schöniger4 1Research Institute for Groundwater, Cairo, Egypt2National Authority for Remote Sensing and Space Sciences (NARSS), Cairo, Egypt 3Department of Geology, Faculty of Science, Minia University, El-Minia, Egypt
4Hydrologie, Wasserwirtschaft und Gewaesserschutz, Leichtweiß-Institut für Wasserbau,
Technische Universität, Braunschweig, Germany Email: [email protected]
Received 2 June 2014; revised 10 July 2014; accepted 29 July 2014
Copyright © 2014 by authors and Scientific Research Publishing Inc.
This work is licensed under the Creative Commons Attribution International License (CC BY). http://creativecommons.org/licenses/by/4.0/
Abstract
The major issues concerning water development and management include water conservation and the efficiency of water use, cost recovery, social and environmental factors. So continuous monitoring is essential to evaluate the reclamation impacts on the groundwater potentiality such as Esna Area. The main objective of this work is to determine the new development areas in Esna during the period from 1984 to 2011 using remote sensing technique. The impacts of the present and future development have been evaluated by using the two-dimensional numerical groundwa-ter flow Simulation Package (visual modflow 4.2). The package is used to construct and calibrate a numerical model that can be used to simulate the response of the aquifer in the study area under implementing different management alternatives in the form of changes in piezometric levels and salinity. From land use maps of the study area in the year 2011, a lot of changes in development areas especially out the border of the old land were observed. The change in land reclaimed area was estimated with 44% in the period from year 1984 to 2011. This development accompanied with draw down about 2.5 meters through this period of time. The authors recommend applying different kinds of change detection technique on the study area. Comparing between results, con-tinuous monitoring of the development area is highly recommended.
Keywords
M. A. Monem et al.
1. Introduction
Remote Sensing, with its advantages of spatial, spectral and temporal availability of data covering large and in-accessible areas within short time, has become a very effective tool in assessing, monitoring and conserving groundwater resources [1]. Satellite data provides quick and useful baseline information on the parameters con-trolling the occurrence and movement of groundwater, such as geology/lithology, land use/land cover and hy-drological parameters. These parameters have to be integrated to assess groundwater. However, the conventional techniques have the limitation to study these parameters together because of the non-availability of data, integra-tion tools and modelling techniques.
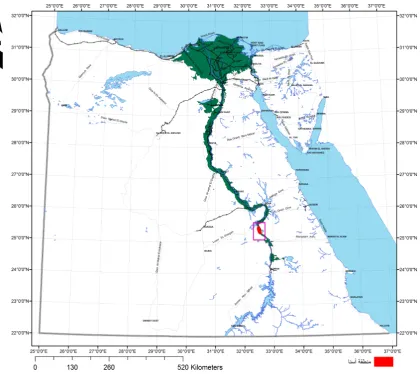
Esna is an important area in Egypt, which has limited water resources although it lies on the upper part of Nile aquifer as shown in Figure 1. The government has established canals network to divert surface water to this area but farmers are still suffering from shortage of surface water, therefore groundwater wells are used to cover de-mands. Due to extensive abstraction from public and private wells (about 68 BCM), the water level in the well fields declines significantly. To avoid the deterioration of the aquifer system and control side effects of the de-velopment in this area, an efficient integrated and sustainable planning and monitoring are needed, also predict the effects of these developments on the groundwater conditions through numerical modeling.
The main objectives of the present study are as follows:
Producing two land use maps for the study area covering the time interval from 2000 and 2011.
[image:2.595.96.517.333.707.2] Producing change detection map that reflects the changes due to land reclamation during the mentioned pe-riod.
Predicting the implementation impacts of the continuous agricultural developing in Esna on the groundwater potentiality and its quality by employing the Numerical Groundwater Simulation Package (modflow).
2. Methodology
Water resources management is a complex process that requires a multi-disciplinary team in order to take all its facets into consideration. The integrated water resources management approach combines different aspects un-der one system that balances between water supplies and water demands taking into account the preserve of wa-ter quality. To study the impacts of implementing the developing policy on the groundwawa-ter potentiality, a groundwater simulation package used to simulate the behavior of groundwater aquifer and its interaction with surface water within the study area. The package is fed with the hydrogeological information about the ground-water aquifer system and the surface ground-water bodies, constructing a numerical model for the Esna aquifer. The model is calibrated against the historical observation records of the groundwater piezometric heads under the steady state condition. Then it is invoked to test many management scenarios of water resources policy and pre-dict the aquifer response in forms of piezometric levels and water quality.
To fulfill the study objectives, the following activities will be carried out:
Collection of all available data for the study area including the physical settings (location, topography, me-teorological data, land use and irrigation and drainage systems) and hydrogeological settings (geology, aqui-fer system, aquiaqui-fer boundary and extent, aquiaqui-fer hydraulic parameters, groundwater flow pattern and ground- water recharge).
Two lands at TM images for the Esna city obtained in 1984 and 2011 are analyzed to produce land use maps (1984, 2011) then change detection map which illustrates the new the reclaimed areas using Erdas Imagine Software.
The final results of the new reclaimed areas that obtained from the change detection map are used to feed the numerical groundwater flow model to simulate the response of the aquifer under the implementation of the present and future water resources policy. The simulation process will be executed by using the Numerical Groundwater Simulation Package Visual Modflow 4.2) was used.
3. Land Cover Maps and Change Detection Maps
Esna is an important area in Egypt, which has limited water resources although it lies on the upper part of Nile aquifer and farmers are suffering from shortage of surface water, therefore groundwater wells are used to cover demands. Accordingly, remote sensing technique plays an important role in producing land cover map and change map of different stages of development (change detection map)
These changes in reclamation lands were illustrated through two satellite images, at two different years 1984 and 2011. The image of 1984 represents the beginning stage of development and the image in 2011 represents the current stage of development. The procedure used for producing the land cover maps and change detection map will discussed as follow.
3.1. Application of Remote Sensing for Producing Land Cover Maps
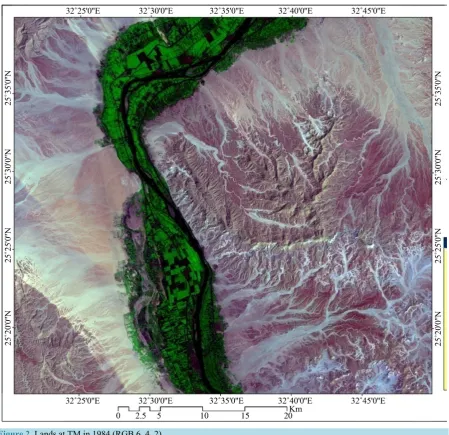
Two Lands at TM images cover Esna Region at two different dates (July 1984 and July 2011) were used (Figure 2 and Figure 3) for producing land cover maps where land cover simply refers to the actual biophysical materials found on that same area [2]. Erdas Imagine is software was used in this study to analyze the Lands at TM images and produce classified images for the study area through the following steps:
1) Rectification for the images by the neatest neighbourhood method.
M. A. Monem et al.
Figure 2. Lands at TM in 1984 (RGB 6, 4, 2).
3.2. Change Detection Application
Change detection application represents one of the important applications of Remote sensing technique. Change detection procedures should involve data acquired by the same (or similar) sensor and should be recorded using the same spatial resolution, viewing geometry, spectral bands, and time of the day. There are different methods which are used in change detection application such as: Image difference, Image ratio and post classification comparison [3].
In this area change detection application using post classification comparison was applied for detecting the changes in cultivated area in Esna during the period from 1984 to 2011. Post classification comparison method was applied through Erdas Imagine according to the following steps:
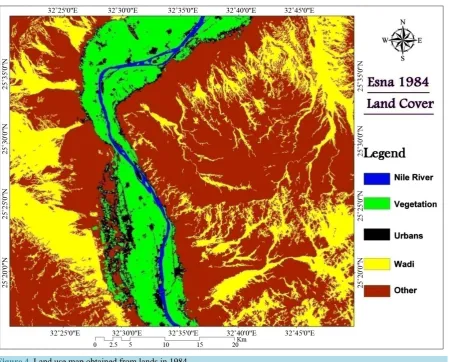
A classified image was prepared in the years of 1984 and 2011 (land use map).
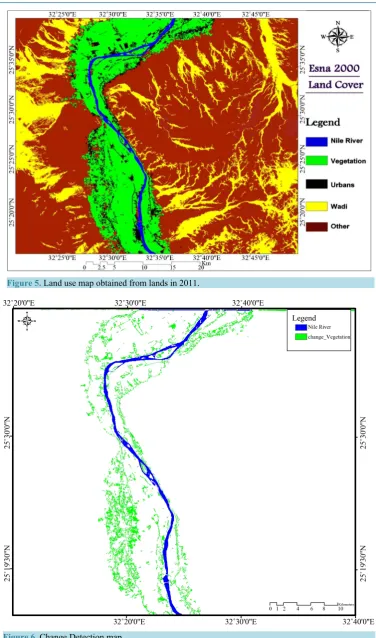
The Produced land use map in 1984 was subtracted from the produced land use map in 2011 as shown in (Figure 6).
The resulting change detection map illustrates different changes in the vegetation class during this period of time.
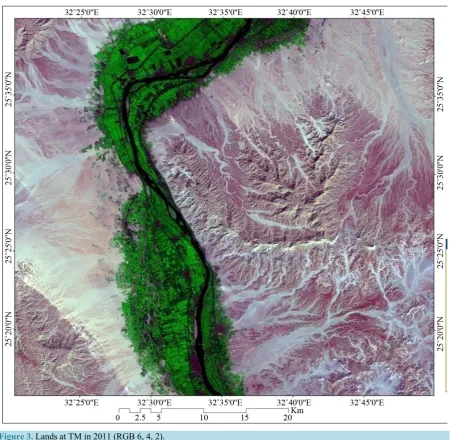
Figure 3. Lands at TM in 2011 (RGB 6, 4, 2).
lot of changes in development areas especially on the border of the old land. The change in land reclaimed area was estimated with 44%.The total cultivated area based on groundwater reach to about 1000 fed., and located in the north and south of the western fringes as shown in the change detection map.
The numerical groundwater flow simulation package modflow was used to predict the expected drawdown and water balance in the future as a result of groundwater development in the area. The study concluded that the most critical areas which have been affected by remarkable lowering in the groundwater level especially in the new cultivate land
4. Hydrogeology
M. A. Monem et al.
Figure 4.Land use map obtained from lands in 1984.
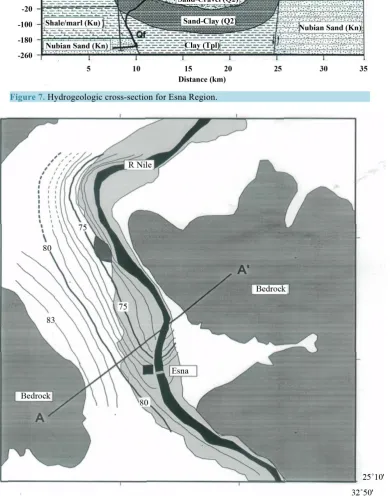
The distribution of hydrostratigraphic units in the study area has been investigated through geophysical sur-veys and borehole studies [5]. The graben fill is of greatest importance to this study, and the RIGW studies in-dicate a deeper sand-clay zone (“Plio-Pleistocene aquifer” or Qi in Figure 7) overlain by gravel-sand (“Quater-nary aquifer” or Q2). These are the principal aquifers within the Nile graben, and are overlain by siltyoverbank deposits (silt-clay, Q3) acting as a semi-confining layer above the aquifers. Thick late-Tertiary marine clay. (Tpl) underlies the Quaternary aquifers, forming an essentially impermeable base.
Bedrock in the vicinity of the graben consists of marine sediments of Cretaceous to Eocene age, including carbonates, marls and shales. These units act as aquitards, except for the deeper Cretaceous Nubian Sandstone (Kn), which forms a regional aquifer beneath much of Egypt. The Nubian Sand lies several hundred meters be-low the Nile valley floor in the study area (Figure 7). Research wells penetrating the Nubian Sand show artesian pressure along most of the Nile valley [5] and salinity above 1000 ppm. Some leakage is postulated from the Nubian Sand aquifer upward along graben-bounding faults.
Groundwater flow is primarily toward the river from the valley walls, with a slight northward (downriver) gradient present (Figure 8). A barrage or low-head-dam built across the Nile at Esna in 1960 causes the steeper gradients just downstream. The profile line used for modeling below is essentially perpendicular to isopach lines, and therefore two-dimensional cross-sectional modeling along this line is a valid approximation of the system.
5. Ground Water Flow Model
Figure 5. Land use map obtained from lands in 2011.
M. A. Monem et al.
Figure 7. Hydrogeologic cross-section for Esna Region.
[image:8.595.122.513.207.704.2]years. To satisfy this objective the latest version of numerical modeling software (Visual Modflow 4.2) was used.
5.1. The Simulation Code
Visual Modflow 4.2 is a multi-dimensional, finite difference, block-centered, saturated groundwater flow code. It is a fully integrated package combine Modflow, Modpath and MT3D, where MT3D is used to forecast future concentrations of TDS.
5.2. Geometry of Modeling Area and Input Data
The regional groundwater model covers west Esna map sheet with longitudinal length 75 km. The modeled area was divided into 82 cells in north south direction and 50 cells in east west direction, each cell cover area 900 km. The model includes two layers (one semi-confined aquifer). The first layer is consisting of clay its thickness va-ries from 0 to 8 m, and the second layer is the quaternary aquifer which consists of sand and gravel with some intercalation of clay, its thickness varies from 100 m to 150 m.
5.2.1. Input Data
The input data of the model based on: 1) Geometry of the aquifer system including the top layer; 2) Hydraulic Parameters of the Aquifer System (Transmisivity, Storativity, Vertical and Horizontal hydraulic conductivity); 3) The average rate of hydraulic conductivity of the clay layer reach to 0.05 m/day, while it varies between 60 - 100 m/day for quifer layer area [6]. The average rate of recharge was ranging between 0.0001 - 0.0005 m/day in flood plain, whereas the main discharge in the model area, was groundwater extraction for various uses which reached to about 2.14 × 10⁹ m3/day in 1990 [7], while it increased to about 2.719 × 10⁹ m3/year at 2011 due to
new development. The total amount of discharge distributed all over the area through grouped sinks; 4) Topo-graphy; 5) the hydraulic parameters of the River and main canals and drains (water level, wetted perimeters, and resistance).
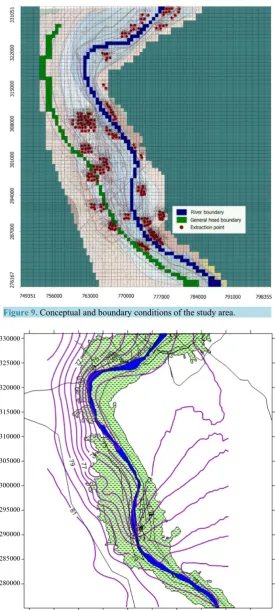
5.2.2. Boundary Conditions and Conceptual Model
The boundaries of the regional model are selected to coincide with natural hydrogeological conditions. The boundary conditions are defined as follows: 1) River Nile is considered as river boundary; 2) The western boundary coincides with a general head boundary for the pizometric level −81 m (with respect to m.s.l) (Figure 9).
5.2.3. Calibration
The calibration process is executed through 2 phases, first phase: steady state conditions at 1990 using the exist-ing pizometric head contour map [5]. The second phase: unsteady state condition for regional model during the period from 1990 to 2011accoding to continuous development and new development areas obtained from change detection map.
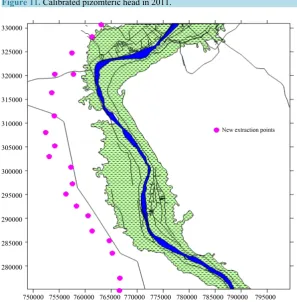
The calibration process has been done through several trials by adjusting the recharge parameters and hydrau-lic resistance to generate piezometric head, which are in agree with measured values. Figure 10 and Figure 11 show the calibrated pizomteric head at 1990 and 2011 respectively.
5.2.4. Calibration Results
A result of the model is considered satisfactory where the difference between the computed and measured heads from hydrogeological map of west Esna [5] was limited. Figure 10 and Figure 11 illustrate the calibrated pie-zometric levels contours map in year 1990 (first stage of development) and 2011 (due to continuous develop-ment and new reclaimed areas through change detection map). The groundwater extraction points due to the new reclaimed are as concentrated in the south and north part of the western fringes of the study area as shown in Figure 12. The total increasing in Groundwater extraction in 2011 reached to 2.719 × 10⁹ m3/year.
M. A. Monem et al.
Figure 9. Conceptual and boundary conditions of the study area.
Figure 11.Calibrated pizomteric head in 2011.
[image:11.595.164.462.403.706.2]M. A. Monem et al.
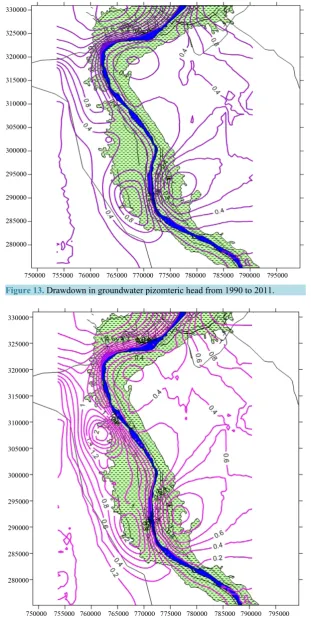
Figure 13.Drawdown in groundwater pizomteric head from 1990 to 2011.
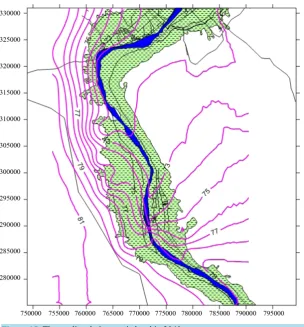
[image:12.595.158.470.84.707.2]Figure 15.The predicted pizometric head in 2040.
6. Conclusions
Lands at TM images represented important tools to illustrate the land use and land cover maps. Change de-tection map was produced to reflect the changes in different human activities in the study area.
New development areas were calculated from the produced land use map in 2011. Groundwater numerical model was used to evaluate the impact of these developments on groundwater aquifer in the study area. Two land use maps for the study area were produced with high accuracy using remote sensing technique
through Erdas imagine software.
Land use maps for the study area showed a lot of changes in development areas especially on the border of the old land. The change in land reclaimed through change detection map was estimated with 44%.
The numerical groundwater flow simulation package modflow was used to predict the expected drawdown and water balance in the future as a result of new development on groundwater in the study area.
The average drawdown of groundwater due to the continuous development and new reclaimed areas ranged from 0.5 m to 2.5 m through the period from 1990 to 2011.
The study concluded that the most critical areas which had been affected by remarkable lowering in the groundwater level were in new cultivate land.
7. Recommendations
There is still much to be done in the future studies through the following recommendations:
1) Applying different kind of change detection technique (post classification comparison, image deference and image ratio) to the new development areas to compare between the results.
2) Continuous monitoring for western Esna development areas by using different kind of satellite images to protect groundwater resources from depletion and deterioration.
M. A. Monem et al.
and also follow the regional plan of aquifer development.
References
[1] Khater, A.R., Darwish, M.M. and Arien (1999) Application of Remote Sensing and Geographic Information Systems for Groundwater Resources Development in Egypt. International Conference on Integrated Management of Water Re-sources in the 21st Century, Cairo, 21-25 November 1999.
[2] Green, K., Kempka, D. and Lackey L. (1994) Using Remote Sensing to Detect and Monitor Land-Cover and Land-Use Change. Photogrammetric Engineering & Remote Sensing, 60, 331-337.
[3] Monem, M.A. (2002) Study of Groundwater Development in the Western Delta Using the Remote Sensing and GIS. M.Sc. Thesis, University of Ain Shams, Cairo.
[4] Morgan, P. (1990) Egypt in the Framework of Global Tectonics. In: Said, R., Ed., The Geology of Egypt, Chap. 7, A.A. Balkema Publishers, Rotterdam, 91-112.
[5] RIGW (1994) Hydrogeological Map for West ESNA Scale 1:100000.
[6] Soliman, S. (1996) Environmental Hydrologyic Impacts of the New Esna Barrage and the Land Reclamation Activi-ties. M.Sc. Thesis, University of Ain Shams, Cairo.