Munich Personal RePEc Archive
The Bank of Japan’s Monetary Policy
and Bank Risk Premiums in the Money
Market
Baba, Naohiko and Nakashima, Motoharu and Shigemi,
Yosuke and Ueda, Kazuo
17 October 2005
Online at
https://mpra.ub.uni-muenchen.de/816/
The Bank of Japan’s Monetary Policy and
Bank Risk Premiums in the Money Market
∗Naohiko Baba, Motoharu Nakashima, Yosuke Shigemi
Bank of Japan
Kazuo Ueda
University of Tokyo
Using the interest rates on negotiable certificates of deposit issued by individual banks, we first show that under the Bank of Japan’s zero interest rate policy and quantitative monetary easing policy, not just the levels of money market rates but also the dispersion of rates across banks have fallen to near zero. We next show that the fall in the dispersion of the rates is not fully explained by a fall in the dispersion of credit ratings of the banks. We also present some evidence on the role of the Bank of Japan’s monetary policy in reducing risk premiums.
JEL Codes: E43, E52.
This paper analyzes the effects of the Bank of Japan’s (BOJ) monetary policy since the latter half of the 1990s, namely, the so-called zero interest rate policy (ZIRP) and quantitative
∗The authors are grateful to Ben Bernanke for his detailed comments and
suggestions on an earlier draft of the paper. We also greatly benefited from dis-cussions with Nobu Kiyotaki and Ken Singleton, among others. Any remaining errors are solely our responsibility. Ueda thanks the Center for Advanced Research in Finance of the University of Tokyo for financial assistance. The views expressed in this paper are those of the authors and do not necessarily reflect the views of the Bank of Japan. Author contact: Baba: Senior Economist and Director, Fi-nancial Markets Department and Institute for Monetary and Economic Studies, Bank of Japan; e-mail: naohiko.baba@boj.or.jp. Nakashima: Economist, Finan-cial Markets Department, Bank of Japan; e-mail: motoharu.nakashima@boj.or.jp. Shigemi: Director, Secretariat of the Policy Board, Bank of Japan; e-mail: yousuke.shigemi@boj.or.jp. Ueda: Professor, University of Tokyo (formerly, Mem-ber of the Policy Board, Bank of Japan); e-mail: ueda@e.u-tokyo.ac.jp.
106 International Journal of Central Banking March 2006
monetary easing policy (QMEP), on credit risk premiums demanded of Japanese banks in the money market.
The ZIRP, the combination of a zero short-term interest rate and a commitment to maintain it until deflationary concerns are dispelled, was adopted by the BOJ between February 1999 and August 2000.1 In March 2001, the BOJ introduced the QMEP framework whereby the operational target of policy was changed to the current account balances (CABs) held by the financial in-stitutions at the BOJ from the overnight call market rate. At the same time, the BOJ promised to maintain the level of the bal-ances well above required reserves until core CPI inflation becomes above zero on a sustainable basis. The QMEP can be thought of as a version of the ZIRP plus the provision of reserves well in ex-cess of the levels neex-cessary to achieve a zero short-term interest rate.2
There is growing literature on the effectiveness of monetary policy near the zero lower bound on interest rates.3 The literature mostly
focuses on the effects of monetary policy on interest rates on safe assets such as government bills and bonds. An often neglected, yet significant aspect of the ZIRP and/or QMEP has been their effects on the credit risk premiums financial institutions pay in the market. That is, the BOJ’s policy has lowered such risk premiums to ex-tremely low levels, especially in the money market. As a result, not just the levels but also the dispersion of money market interest rates among banks have been reduced to near zero. Such reductions in risk premiums have been significant in view of a sharp rise in risk pre-miums during the 1997–98 credit/liquidity crunch, which seriously affected the overall economy.
This paper attempts to document such reductions in the disper-sion of risk premiums across banks. In doing so, we look at the market for negotiable certificates of deposit (NCDs) where issuance rates of
1
More precisely, on February 12, 1999, the BOJ Policy Board determined to encourage the uncollateralized overnight call rate to move as low as possible. In April 1999, the BOJ promised to maintain a zero interest rate “until deflationary concerns are dispelled.” The ZIRP was abandoned on August 11, 2000.
2
The QMEP framework is still in place at the time of the writing of this paper.
3
Vol. 2 No. 1 The Bank of Japan’s Monetary Policy 107
individual banks’ NCDs are available on a weekly basis.4 Using the
data, we first show that the standard deviation of the NCD rates among the banks rose sharply toward the financial crisis of 1997–98, but has declined since then. In particular, it declined with the intro-duction of the ZIRP and declined further as the BOJ intensified its easy policy stance with the QMEP. We then show that the declines in risk premiums cannot be fully explained by recent improvements in the creditworthiness of the banks.
In order to further investigate the background behind the de-clines in risk premiums on NCD rates, we look at spreads and the dispersion of rates on a wider range of credit instruments. We find that spreads and the dispersion of rates have declined in many ar-eas of financial markets since around 1999, including bonds issued by both banks and nonfinancial corporations. We also find, however, that the decline in spreads on NCD issuance rates has been more significant than spreads on longer-term liabilities. We then carry out a regression analysis to show that the BOJ’s monetary policy, espe-cially the commitment to maintain a zero interest rate until deflation ends under the ZIRP and QMEP, has significantly contributed to the decline in the dispersion of rates in the money market. While we do not find evidence in favor of the direct effect of the higher current account balances (CABs) under the QMEP on risk premiums, we find the possibility that longer-dated money market fund-supplying operations have affected risk premiums.
The rest of the paper is organized as follows. In section 1, we present a brief description of the NCD market in Japan. In section 2, we analyze the movements of the standard deviation of the NCD rates over time. In section 3, we look at the relationship between the risk premiums for individual banks and the banks’ credit ratings. We find that the relationship has become looser, that is, risk premiums have declined further since the introduction of the ZIRP in 1999. In section 4, we analyze the relationship between the declines in risk premiums and the BOJ’s monetary policy. Section 5 concludes the paper.
4
108 International Journal of Central Banking March 2006
1. The Market for Negotiable Certificates of Deposit
(NCDs)
1.1 The Size of the NCD Market
NCDs are debt instruments issued by banks including city, regional, trust, and foreign banks in Japan.5 NCDs were the first-ever product with deregulated interest rates in Japan and have been issued since May 1979. The amount outstanding of NCDs issued by Japanese domestically licensed banks has been moving around 30 trillion yen in 2004. Of this total, about 80 percent is issued by major banks, namely city and trust banks. Major banks have recently raised around 30 percent of their total funding needs from markets by issu-ing NCDs. Thus, NCDs can be thought of as one of their principal instruments for raising operating funds.6
1.2 NCD Issuance by Maturity
Next, take a look at major banks’ issuance of NCDs by maturity. The maturity of NCDs varies from a few weeks to several years. Issuances with maturities of less than 30 days account for about 60 percent of the total based on fiscal 2004 averages.7 Therefore, market liquidity for NCDs with maturities of less than 30 days is likely to be the highest of all the maturity zones.
2. The Dispersion of Interest Rates on Newly Issued
NCDs among Major Banks
Interest rates on major banks’ newly issued NCDs had served as a main indicator for deregulated interest rates, although they had moved broadly in tandem across banks for some time since the first NCDs were issued in May 1979. That is, the interest rates had not re-flected the differences in bank credit risks. Since the 1990s, however, the interest rates had started to reflect the credit risk of individual issuing banks, mostly due to the rising concern over the stability
5
For a more detailed description of the Japanese NCD market, see chapter 7 of Totan Research (2002).
6
For the size of the Japanese NCD market, see appendix figure 1 posted on www.ijcb.org.
7
Vol. 2 No. 1 The Bank of Japan’s Monetary Policy 109
of the Japanese financial system.8 Such concern heightened during
the period from late 1997 to 1998. This is shown in figure 1 by substantial jumps in the degree of dispersion as measured by the standard deviation of the NCD interest rates in November 1997.9 The standard deviations declined significantly, however, after the adoption of the ZIRP in February 1999 and have fallen further fol-lowing the adoption of the QMEP in March 2001.10 It is also worth noting that under the QMEP, the standard deviations of the inter-est rates on newly issued NCDs declined to or even below the levels observed before the period of financial instability.
Table 1 reports the result of statistical tests on the difference in the averages of the standard deviations between four subperiods of the sample: (i) the period before financial instability (up to Octo-ber 1997), (ii) the period of financial instability between NovemOcto-ber 1997 and December 1998, (iii) the ZIRP period, and (iv) the QMEP period.11
First, the null hypothesis that the averages of the standard de-viations were equal was rejected at the 1 percent significance level between the period of financial instability and the ZIRP period. Sec-ond, the same null hypothesis was rejected between the ZIRP and QMEP periods. Third, it was also rejected between the prefinancial instability years and the ZIRP period except for the maturity of less than 90 days. Finally, the average is significantly lower during the QMEP period than in prefinancial instability years at all matu-rities. Thus, we can statistically confirm the following observation:
8
See chapter 7 of Totan Research (2002).
9
In November 1997, concern over the financial stability heightened following a series of failures of four financial institutions: Sanyo Securities (November 3), Hokkaido Takushoku Bank (November 17), Yamaichi Securities (November 24), and Tokuyo City Bank (November 26). The concern over the financial instability subsided after the nationalization of Long-Term Credit Bank of Japan (October 23, 1998) and Nippon Credit Bank (December 13, 1998).
10
As shown by appendix figure 3 at www.ijcb.org, a similar tendency is observed in fund-raising costs via deposits, defined as payment of deposit interest rates divided by the amount outstanding of deposits. The standard deviation of the deposit cost lags behind the standard deviation of NCD interest rates by about two years. This is mainly due to longer average maturity of deposits.
11
110 In te rn at ion al J ou rn al of C en tr al B an k in g M ar ch 2006 F igu re 1. S tan d ar d D e v iat ion of In te re st R at e s on Ne w ly Is su e d NC D s am on g B an k s
A. Maturity of Less than 30 Days
0.00 0.10 0.20 0.30 0.40 0.50 0.60 0.70 0.80
1993/04/05 1993/07/19 1993/11/01 1994/02/14 1994/05/30 1994/09/12 1994/12/26 1995/04/10 1995/07/24 1995/11/06 1996/02/19 1996/06/03 1996/09/16 1996/12/30 1997/04/14 1997/07/28 1997/11/10 1998/02/23 1998/06/08 1998/09/21 1999/01/04 1999/04/19 1999/08/02 1999/11/15 2000/02/28 2000/06/12 2000/09/25 2001/01/08 2001/04/23 2001/08/06 2001/11/19 2002/03/04 2002/06/17 2002/09/30 2003/01/13 2003/04/28 2003/08/11 2003/11/24 2004/03/08 2004/06/21 2004/10/04 2005/01/17 2005/05/02 ZI RP QME P Period of fina nci a l inst a b il ity St a n d ar d d evi at io n Average of st an dard devi ati on
B. Maturity of Less than 60 Days
0.00 0.10 0.20 0.30 0.40 0.50 0.60 0.70 0.80
[image:7.612.170.652.121.457.2]Vol. 2 No. 1 The Bank of Japan’s Monetary Policy 111
Figure 1 (continued). Standard Deviation of Interest Rates on Newly Issued NCDs among Banks
C. Maturity of Less than 90 Days
0.00 0.10 0.20 0.30 0.40 0.50 0.60 0.70 1993/ 04/ 05 1993/ 07/ 19 1993/ 11/ 01 1994/ 02/ 14 1994/ 05/ 30 1994/ 09/ 12 1994/ 12/ 26 1995/ 04/ 10 1995/ 07/ 24 1995/ 11/ 06 1996/ 02/ 19 1996/ 06/ 03 1996/ 09/ 16 1996/ 12/ 30 1997/ 04/ 14 1997/ 07/ 28 1997/ 11/ 10 1998/ 02/ 23 1998/ 06/ 08 1998/ 09/ 21 1999/ 01/ 04 1999/ 04/ 19 1999/ 08/ 02 1999/ 11/ 15 2000/ 02/ 28 2000/ 06/ 12 2000/ 09/ 25 2001/ 01/ 08 2001/ 04/ 23 2001/ 08/ 06 2001/ 11/ 19 2002/ 03/ 04 2002/ 06/ 17 2002/ 09/ 30 2003/ 01/ 13 2003/ 04/ 28 2003/ 08/ 11 2003/ 11/ 24 2004/ 03/ 08 2004/ 06/ 21 2004/ 10/ 04 2005/ 01/ 17 2005/ 05/ 02 ZIRP QMEP in Average of standard deviation Standard deviation Period of financial stability Period of financial instability
Notes: Sample banks are the following banks for which weekly data are available throughout the above period (April 5, 1993–May 9, 2005): Sum-itomo Mitsui Banking Corporation, the Bank of Tokyo-Mitsubishi, UFJ Bank, Resona Bank, Shinsei Bank, Aozora Bank, the Mitsubishi Trust and Banking Corporation, the Sumitomo Trust & Banking, Mizuho Trust & Banking, UFJ Trust Bank, and the Chuo Mitsui Trust and Banking Com-pany. Fuji Bank and Mizuho Bank are excluded, as a large portion of their NCDs were issued to local governments. For Sumitomo Mitsui Banking Corporation prior to its merger in April 2001, data for the former Sumit-omo Bank are used.
We regarded the following dates as “event dates” and those were excluded in calculating the average of standard deviation: (i) the end of 1999 (Y2K problem); (ii) the end of 2000 (preparation for the introduction of RTGS [real-time gross settlement]; (iii) the end of fiscal 2001 (the partial removal of blanket deposit insurance).
Source:Bank of Japan.
[image:8.612.127.448.189.362.2]112
In
te
rn
at
ion
al
J
ou
rn
al
of
C
en
tr
al
B
an
k
in
g
M
ar
ch
[image:9.612.194.596.156.430.2]2006
Table 1. Test of the Difference in Dispersion of NCD Interest Rates A. Between the Period of Financial Instability and the ZIRP Period
Mean of the Standard Deviation
t-value
Financial Difference Null Hypothesis:
Maturity Instability (A) ZIRP (B) C = B−A C = 0
Less than 30 days 0.089 0.030 −0.060 −8.795∗∗∗
Less than 60 days 0.152 0.045 −0.107 −8.312∗∗∗
Less than 90 days 0.124 0.049 −0.075 −5.663∗∗∗
B. Between the ZIRP and the QMEP Periods
Mean of the Standard Deviation t-value
Difference Null Hypothesis:
Maturity ZIRP (B) QMEP (D) E = D−B E = 0
Less than 30 days 0.030 0.013 −0.016 −5.046∗∗∗
Less than 60 days 0.045 0.020 −0.025 −6.049∗∗∗
Less than 90 days 0.049 0.026 −0.023 −4.601∗∗∗
C. Between the Period Before Financial Instability and the ZIRP Period
Mean of the Standard Deviation
t-value
Before Financial Difference Null Hypothesis:
Maturity Instability (F) ZIRP (B) G = B−F G = 0
Less than 30 days 0.097 0.030 −0.067 −11.444∗∗∗
Less than 60 days 0.079 0.045 −0.034 −4.927∗∗∗
Less than 90 days 0.038 0.049 −0.011 1.966∗∗
V
ol
.
2
No.
1
T
h
e
B
an
k
of
J
ap
an
’s
M
on
et
ar
y
P
ol
ic
y
113
Table 1 (continued). Test of the Difference in Dispersion of NCD Interest Rates D. Between the Period Before Financial Instability and the QMEP Period
Mean of the Standard Deviation t-value
Before Financial Difference Null Hypothesis:
Maturity Instability (F) QMEP (D) H = D−F H = 0
Less than 30 days 0.097 0.013 −0.083 −20.1165∗∗∗
Less than 60 days 0.079 0.020 −0.060 −16.542∗∗∗
Less than 90 days 0.038 0.026 −0.012 −3.950∗∗∗
Notes:Each period is defined as follows. The period before financial instability is April 5, 1993–October 27, 1997. The period of financial instability is November 3, 1997–December 28, 1998. The ZIRP period is February 15, 1999–August 14, 2000. The QMEP period is March 26, 2001–May 9, 2005.
The following dates are excluded as event dates: (i) the end of 1999 (Y2K problem); (ii) the end of 2000 (preparation for the introduction of RTGS [real-time gross settlement]; (iii) the end of fiscal 2001 (the partial removal of blanket deposit insurance)).
114 International Journal of Central Banking March 2006
3. Estimating Credit Curves from Interest Rates on Newly
Issued NCDs
The interpretation of the preceding section’s finding, declines in the standard deviation of NCD issuance rates among banks, is not straightforward. One possible interpretation is that financial strains have gradually eased since 1999 and the resultant improvements of the credit ratings for many banks have lowered the standard de-viation as well as the levels of credit risk premiums. In order to statistically address this issue, we estimate credit curves at various points in time.
3.1 Estimation Method
First, we define the credit spread for a bank as the interest rate on NCDs issued by the bank with each maturity (less than 30 days, 60 days, and 90 days) minus the weighted average of uncollateral-ized overnight call rate over all banks.12Then, we run cross-sectional
time-series regressions of the credit spreads on dummy variables cor-responding to sample banks’ credit ratings for each of the following four representative years under study: (i) 1997, the year of the finan-cial instability, (ii) 1999, a year when the ZIRP was in full swing, (iii) 2002, one year after the adoption of the QMEP, and (iv) 2004, the last year of our sample period. We also estimate the credit curve in 2005 with a view to following the most recent development. Note, however, that it only covers the period up to May 9, 2005. Our sam-ple consists of city and trust banks. The data on NCD rates are available weekly, resulting in more than 500 observations for almost all cases.13We also include end of March, September, and December dummies to control for seasonal market tightness in year-end and annual/semi-annual book-closing months. The credit spreads for each credit rating category, derived from the coefficients on credit
12
Precisely, the maturity of less than 60 days denotes the maturity of 60 days to 89 days, and the maturity of less than 90 days denotes the maturity of 60 days to 179 days, respectively.
13
Vol. 2 No. 1 The Bank of Japan’s Monetary Policy 115
rating dummies along with the constant term, map out the “credit curve” for each year.
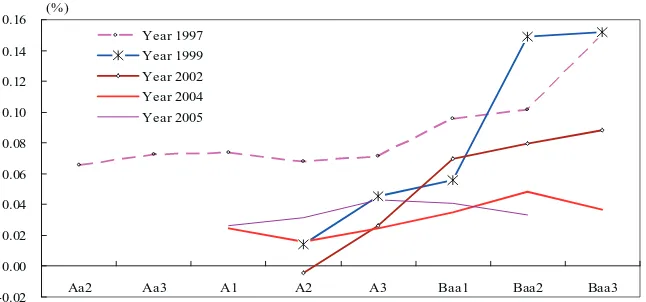
3.2 Estimated Credit Curves
The estimation result is shown in table 2.14 Dummy variables for credit ratings are statistically significant in many cases, particularly for the maturity of less than 30 days. Figure 2 draws the credit curves derived by the estimation result. As a general tendency, the credit curves are sloped upward for ratings of A2 or lower for each maturity. The credit curve is sloped downward between A1 and A2 for 1999 in the case of less than 30-day maturity. The number of banks with a rating of A1 or higher, however, is very small for 1999. In fact, the coefficient on A1 dummy is insignificant for 1999. Thus, it seems that we do not have to take this part of the result too seriously.
Figure 2 also demonstrates how the slope of the credit curve became flatter over time. A notable exception is the movement of the spread of Baa2 rating between 1997 and 1999 for each maturity. This coefficient, however, is insignificant even at the 5 percent level in 1999. Except this, it seems fair to say that the credit curves flattened after the introduction of the ZIRP in 1999, flattened further following the introduction of the QMEP in 2002, and almost flattened out in 2004 for all maturities.15
The estimation result indicates that the credit risk premiums among major banks are currently close to zero, and that the differ-ences in credit ratings among them are now hardly reflected in their fund-raising costs in the money market. Therefore, the narrowed dispersion of fund-raising costs among banks, shown in figure 1, is
14
For estimation results for maturities other than less than 30 days, see ap-pendix table 1 at www.ijcb.org.
15
116
In
te
rn
at
ion
al
J
ou
rn
al
of
C
en
tr
al
B
an
k
in
g
M
ar
ch
[image:13.612.195.593.186.405.2]2006
Table 2. Estimation Results of Credit Curves of NCD Spreads
Dependent Variable: NCD Issuance Interest Rate (Less than 30 Days) —Uncollateralized Overnight Call Rate
1997 1999 2002 2004 2005
Constant −0.075∗∗∗ 0.156∗∗∗ 0.034∗∗∗
Aa2 0.105∗∗∗
Aa3 0.082∗∗∗
A1 0.116∗∗∗
−0.047 −0.023∗∗∗ 0.011∗∗∗
A2 0.113∗∗∗
−0.122∗∗∗ 0.006 −0.023∗∗∗ 0.009∗∗∗
A3 0.139∗∗∗
−0.126∗∗∗ 0.015∗∗∗
−0.022∗∗∗ 0.020∗∗∗
Baa1 0.126∗∗∗
−0.117∗∗∗ 0.030∗∗∗
−0.021∗∗∗ 0.012∗∗∗
Baa2 0.119∗∗∗
−0.081∗ 0.034∗∗∗ −0.011∗∗∗ 0.023∗∗∗
Baa3 0.194∗∗∗
−0.088∗∗ 0.043∗∗∗ −0.008∗∗∗
Year-end dummy 0.493∗∗∗ 0.191∗∗∗
−0.002 −0.000
Fiscal year-half dummy 0.025∗∗
−0.031∗∗ −0.006 0.004∗∗∗
Fiscal year-end dummy 0.030∗∗ 0.038∗∗∗ 0.087∗∗∗ 0.003∗∗∗ 0.004∗∗∗
Adjusted R-squared 0.658 0.253 0.296 0.449 0.197
Number of observations 865 826 667 668 243
Aa2 52 0 0 0 0
Aa3 52 0 0 0 0
A1 80 8 0 47 132
A2 128 78 52 71 19
A3 52 72 202 198 29
Baa1 227 252 109 204 55
Baa2 104 262 155 58 8
Baa3 155 149 149 50 0
No rating 15 5 0 40 0
Notes:Estimation is by OLS.∗∗∗,∗∗, and∗denote the 1, 5, and 10 percent significance level, respectively.
Vol. 2 No. 1 The Bank of Japan’s Monetary Policy 117
Figure 2. Credit Curves of NCD Spreads
A. Maturity of Less than 30 Days
0.00 0.02 0.04 0.06 0.08 0.10 0.12 0.14
Aa2 Aa3 A1 A2 A3 Baa1 Baa2 Baa3 Year 1997
Year 1999
Year 2002
Year 2004
Year 2005 (%)
B. Maturity of Less than 60 Days
0.00 0.02 0.04 0.06 0.08 0.10 0.12 0.14 0.16
Aa2 Aa3 A1 A2 A3 Baa1 Baa2 Baa3 Year 1997
Year 1999
Year 2002
Year 2004 Year 2005 (%)
(continued)
118 International Journal of Central Banking March 2006
Figure 2 (continued). Credit Curves of NCD Spreads
C. Maturity of Less than 90 Days
-0.02 0.00 0.02 0.04 0.06 0.08 0.10 0.12 0.14 0.16
Aa2 Aa3 A1 A2 A3 Baa1 Baa2 Baa3 Year 1997
Year 1999 Year 2002 Year 2004 Year 2005 (%)
Notes:Each curve is drawn from parameter estimates shown in table 2. Credit ratings are the long-term ratings of Moody’s.
4. The Flattening of Credit Curves and the BOJ’s
Monetary Policy
4.1 Three Hypotheses
In this section, we attempt to investigate further the reasons behind the recent flattening of the credit curves for NCD issuance rates, as well as the declines in the dispersion of those rates. We came up with at least the following three possible explanations for this phenomenon.
First, although the analysis in the last section showed that im-provements in banks’ credit ratings are not the whole explanation, credit ratings may not be the best indicator of credit risks. Some-times, they are known to lag behind evolving market perceptions of credit risks. With a more proper measure of credit, credit curves may not have flattened.
[image:15.612.128.451.177.328.2]Vol. 2 No. 1 The Bank of Japan’s Monetary Policy 119
increasingly strong commitment to maintain a zero interest rate un-til deflation ends may have played a role. Under the ZIRP (February 1999–August 2000), the BOJ committed itself to maintain a zero short-term interest rate until “deflationary concerns were dispelled.” Under the QMEP (March 2001–present), the BOJ promised to main-tain the level of the CABs well in excess of required reserves, thus a zero short-term interest rate until the actual and expected core CPI inflation turns positive. In October 2003, the exit condition was further clarified to read “until at least actual core CPI inflation and its forecast by monetary policy board members exceed zero.” These commitments may have lowered risk premiums in the money market by substantially reducing the risk that banks fail to meet payment obligations, which makes the near-term chance of a default smaller. Furthermore, the BOJ’s attempt to supply huge amounts of excess reserves well above the levels necessary to keep short-term interest rates around zero percent may have played a role. In order to abide by the target on the CABs of 30–35 trillion yen, the BOJ has had to increasingly offer long-dated fund-supplying operations in the money market.16The average maturity of bill-purchasing
op-erations was two to three months at the start of the QMEP, but it rose to close to nine months recently. Any banks eligible for the BOJ’s money market operations can take such long-term funds from the BOJ with almost zero interest rates. Arbitrage activities across the money markets may have lowered the level and the dispersion of rates even on instruments that are not directly used in the BOJ’s money market operations—NCD rates, for example.
The third possible explanation for the decline in the dispersion of NCD issuance rates is that it is partially irrational. In the environ-ment of easy monetary policy and low returns, investors may have carried out “reach for yield” activities aggressively, buying assets with returns too low to be justified by rational economic calculation. While rigorously distinguishing between these hypotheses is beyond the scope of the present paper, in what follows we offer several pieces of evidence that we think are helpful in speculating on the impor-tance of each.
16
120 International Journal of Central Banking March 2006
4.2 Some Evidence
We first take a look at the evolution of credit curves and the disper-sion of rates for a wide range of financial instruments. This exercise will reveal that, while factors common to many instruments have been at work, there is something distinct about the decline in risk premiums in the money market. We then proceed to carry out a more formal analysis concerning whether or not this distinct movement of money market credit spreads is related to monetary policy, and, if so, in what ways.
4.2.1 Credit Curves for Other Financial Instruments
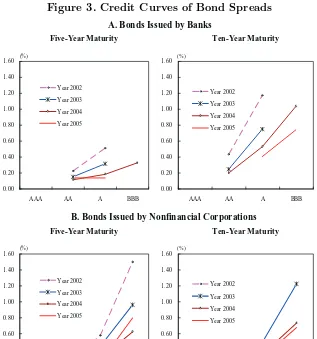
Figure 3 shows credit curves of bond spreads with maturities of five and ten years for banks and nonfinancial corporations, respectively, which we estimated using the same methodology as in the case of NCD credit curves.17 We can see that credit curves have become flatter over time as in the case of NCD issuance rates, but that risk premiums seem to remain other than a few cases for 2004 and 2005: (i) the five-year spread for banks between the ratings of A and AA and (ii) five- and ten-year spreads for nonfinancial corporations be-tween AA and AAA.18In general, the curves are flatter for five-year maturity than ten-year maturity and for banks than for nonfinancial corporations. Thus, the tendency for spreads to decline does exist even in the long-term bond market for both banks and nonfinancial corporations, but it is stronger for relatively shorter-dated bonds and for banks.
Regarding Japanese corporate bond pricing, Nishioka and Baba (2004) showed that narrowed credit spreads on Japanese corporate bonds under the ZIRP and QMEP cannot be explained unless they assume a risk-loving representative investor. This leads to an un-derpricing of negative-skewness risk that is inherent in defaultable bonds. Thus, together with our observation that the curves are flatter
17
The bond spread is defined as the bond issuance rate minus the Japanese government bond (JGB) yield with the same maturity. Credit curves are derived by estimating credit rating dummies after controlling for year-end, semi-annual, and fiscal year-end dummies. The bond yield data is available only from 2002.
18
Vol. 2 No. 1 The Bank of Japan’s Monetary Policy 121
Figure 3. Credit Curves of Bond Spreads
A. Bonds Issued by Banks
Five-Year Maturity Ten-Year Maturity
0.00 0.20 0.40 0.60 0.80 1.00 1.20 1.40 1.60
AAA AA A BBB Year 2002 Year 2003 Year 2004 Year 2005 (%) 0.00 0.20 0.40 0.60 0.80 1.00 1.20 1.40 1.60
AAA AA A BBB Year 2002
Year 2003 Year 2004 Year 2005 (%)
B. Bonds Issued by Nonfinancial Corporations
Five-Year Maturity Ten-Year Maturity
0.00 0.20 0.40 0.60 0.80 1.00 1.20 1.40 1.60
AAA AA A BBB Year 2002 Year 2003 Year 2004 Year 2005 (%) 0.00 0.20 0.40 0.60 0.80 1.00 1.20 1.40 1.60
AAA AA A BBB Year 2002
Year 2003 Year 2004 Year 2005 (%)
Notes: The bond spread is defined as the spread of bond issuance rate over the JGB yields with the same maturity.
Credit curves are derived by estimating credit rating dummies after con-trolling for year-end, semi-annual, and fiscal year-end dummies.
Credit ratings are the long-term ratings of Moody’s.
Number of observations is as follows: (i) bank bonds: 12/4 (five-year/ten-year) for 2002, 13/7 for 2003, 12/12 for 2004, and 6/6 for 2005; (ii) non-financial corporate bonds: 66/51 for 2002, 85/67 for 2003, 82/52 for 2004, and 21/26 for 2005, respectively.
122 International Journal of Central Banking March 2006
for banks than for nonfinancial corporations, the third hypothesis above, excessive risk taking in the money and bond markets, partic-ularly for banks, is likely to hold at least to some extent.
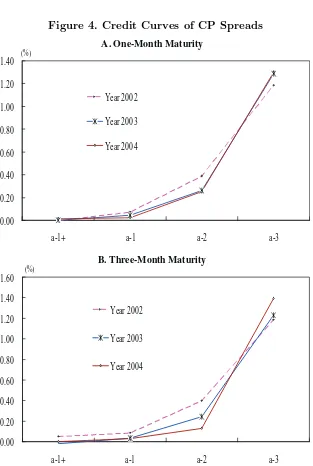
Next, figure 4 presents credit curves of commercial paper (CP) issuance spreads with one- and three-month maturities.19 As in the
case with bond spreads, the curves have become flatter over time. There are, however, significant spreads remaining at ratings of below a-1. In particular, note that the difference in CP spreads between a-2 and a-1 in 2004 amounts to ten times as large as the largest one-notch difference in spreads for NCD issuance rates. This difference in the slope of credit curves is interesting. It should partially be explained by differences in credit risks perceived by investors: banks versus nonfinancial corporations. It is also interesting to look at the tight credit spread between a-1 and a-1+. The BOJ has carried out fund-supplying operations using CP, albeit in a repurchasing form, and market participants seem to recognize that most of the CP eligible for the money market operations has the rating of a-1 or higher.20
Consequently, the very flat CP credit curve over the zone of a-1 or higher is suggestive of the direct effect of the BOJ’s operations on CP rates.
4.2.2 Dispersion of Interest Rates for Other Financial Instruments
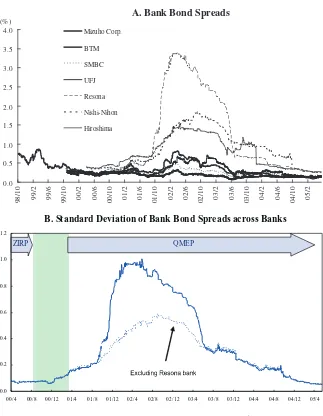
It is also of interest to compare the dispersion of NCD issuance rates with that of other financial instruments. Figure 5 shows the spreads on bank-issued bond yields over the JGB yields and the standard deviation of those spreads across the banks. It is similar to the case of NCD issuance rates in that the standard deviation has declined sharply since the beginning of 2003. The dispersion of bank bond spreads, however, rose significantly in late 2001 and stayed high
19
The CP spread is defined as the CP issuance rate minus the uncollateralized overnight call rate. The CP issuance rates are available only from 2002. Credit curves are derived by estimating credit rating dummies after controlling for year-end, semi-annual, and fiscal year-end dummies.
20
Vol. 2 No. 1 The Bank of Japan’s Monetary Policy 123
Figure 4. Credit Curves of CP Spreads
B. Three-Month Maturity
0.00 0.20 0.40 0.60 0.80 1.00 1.20 1.40 1.60
a-1+ a-1 a-2 a-3
Year 2002
Year 2003
Year 2004
(%)
A. One-Month Maturity
0.00 0.20 0.40 0.60 0.80 1.00 1.20 1.40
a-1+ a-1 a-2 a-3
Year 2002
Year 2003
Year 2004
(%)
Notes:The CP spread is defined as the spread of CP issuance rate over the uncollater-alized overnight call rate.
Credit curves are derived by estimating credit rating dummies after controlling for year-end, semi-annual, and fiscal year-end dummies.
Credit ratings are the short-term ratings of Moody’s.
124 International Journal of Central Banking March 2006
Figure 5. Dispersion of Bank Bond Spreads
0.0 0.5 1.0 1.5 2.0 2.5 3.0 3.5 4.0 98/ 10 99/ 2 99/ 6 99/ 10 00/ 2 00/ 6 00/ 10 01/ 2 01/ 6 01/ 10 02/ 2 02/ 6 02/ 10 03/ 2 03/ 6 03/ 10 04/ 2 04/ 6 04/ 10 05/ 2 Mizuho Corp. BTM SMBC UFJ Resona Nishi-Nihon Hiroshima (%)
A. Bank Bond Spreads
B. Standard Deviation of Bank Bond Spreads across Banks
0.0 0.2 0.4 0.6 0.8 1.0 1.2
00/4 00/8 00/12 01/4 01/8 01/12 02/4 02/8 02/12 03/4 03/8 03/12 04/4 04/8 04/12 05/4 QMEP
ZIRP
Notes:The bank bond spread is defined as the spread of bank bond yield over the JGB yield with the same maturity. The maturity of most bonds is five years.
We computed the standard deviation of bank bond yields from the date from which more than four banks’ yield data are available.
Vol. 2 No. 1 The Bank of Japan’s Monetary Policy 125
until early 2003. There are some corresponding movements in the dispersion of NCD issuance rates, but these are limited to spikes of short duration in March 2002 and March 2003.21 The period
be-tween late 2001 and early 2003 corresponds to a recession following the collapse of the so-called IT bubble and saw many bankruptcies of both financial and nonfinancial corporations. The bankruptcy of En-ron Corporation and the resultant worldwide concerns over mutual funds added to the stresses. The minutes of the BOJ’s monetary pol-icy meetings in late 2001 and early 2002 reveal that the polpol-icy board was very concerned about the rise in risk premiums in the money and bond markets. In response, the policy board decided to raise the target on CABs in December 2001 and also allowed the CABs to go above the target range temporarily in the spring of 2002. The minutes after the adoption of these measures indicate that the board thought that the measures were successful in containing the risk pre-miums in the money market, but not those on bonds for banks and nonfinancial corporations. This episode is again indicative of differ-ent impacts of monetary policy on money market instrumdiffer-ents from those on others.
Figure 6 presents the movement of the standard deviation of an-other measure of bank risk, that is, the bank default probabilities implied by bank stock prices.22Again, we can see the general
down-ward trend in the dispersion. The dispersion in default probabilities, however, rose between late 2001 and the middle of 2002, declined somewhat after that, but still remained at fairly high levels until the middle of 2004. This pattern is roughly the same as for bank bond yields and is not quite similar to that for NCD issuance rates.
The foregoing discussion suggests that both the levels and disper-sion of interest rates on credit instruments, particularly those issued
21
The other spikes in the dispersion of NCD issuance rates in late 1999 and late 2000 reflect the stress associated with the Y2K problem and the introduction of the real-time gross settlement (RTGS) scheme into the settlement of funds and government bonds in early 2001.
22
126 International Journal of Central Banking March 2006
Figure 6. Default Probability Implied by Stock Price
0.00 2.00 4.00 6.00 8.00 10.00 12.00 14.00 16.00
96 97 98 99 00 01 02 03 04
Average
Standard deviation
ZIRP QMEP
(%)
Notes:We used the model of Merton (1974) to compute the default proba-bility for each bank. Time horizon is assumed to be one year. We calculated each bank’s default probability on a monthly basis from daily stock returns, together with the balance sheet data.
The number of sample banks is 102, which include city, trust, regional, and regional II banks.
Sources:Bloomberg, Bank of Japan.
Vol. 2 No. 1 The Bank of Japan’s Monetary Policy 127
section 4.1 above, are not the whole explanation of our finding of flat credit curves for NCD rates.23
It would be best if we can determine the exact contribution of monetary policy developments, irrational investor behavior, and other factors behind the declines in spreads and the dispersion of rates for a wide range of instruments such as bonds for banks and nonfinancial corporations. This, however, would go well beyond the scope of the present paper. Instead, we focus on the analysis of money market rates, to which we now turn.
4.2.3 Regression Analysis on the Role of the BOJ’s Monetary Policy
In what follows, we attempt to investigate the role the BOJ’s mon-etary policy has played in the behavior of credit spreads for NCD issuance rates. To that end, we extend the year-by-year regression analysis on the credit curves of individual NCD issuance spreads by pooling the entire cross-sectional time-series data and allowing the slope of the credit curves to depend on the variables, including those related to the BOJ’s monetary policy.
Specifically, we estimate the following model:
NCDit = (a0+a1ZIRP+a2QMEP+a3TRANS
+ a4CABt+a5BONDit)∗(A1)
+ (b0+b1ZIRP+b2QMEP+b3TRANS
+ b4CABt+b5BONDit)∗(A2),
+ . . .
where NCDit denotes the spread for NCD issuance rate for bank i
at timetover the weighted average of uncollateralized overnight call rate, and BONDit denotes the spread of the bond yield for bank i
at timetover the JGB yield with the same maturity. A1 (A2 ..) de-notes the dummy variable that takes 1 if the credit rating for bank iat timet is A1 (A2 ..) and takes 0 otherwise.24 More importantly,
23
We also analyzed the relationship between the NCD spreads and other mea-sures of credit risk such as interest coverage ratio, defined as the ratio of interest payment to earnings, and ROA (return on assets), but could not get any robust results.
24
128 International Journal of Central Banking March 2006
we include monetary policy-related variables to investigate the rela-tionship between the flattening of NCD credit curves and the BOJ’s monetary policy. They are dummy variables corresponding to the BOJ’s commitments during the ZIRP and QMEP periods and the level of aggregate CABs. That is,
ZIRP: takes on 1 when the ZIRP is in force (February 12, 1999–August 11, 2000) and 0 otherwise.
QMEP: takes on 1 when the QMEP is in force (March 19, 2001–present) and 0 otherwise.
TRANS: takes on 1 after October 10, 2003, when the BOJ en-hanced the transparency of monetary policy and 0 otherwise.
CABt: aggregate current account balances at time t.
Those interactive terms with credit rating dummies are an at-tempt to estimate whether or not, and to what extent, monetary policy variables have contributed to the flattening of the credit curves that we saw in figure 2.25
The inclusion of bank bond spreads in the credit rating dummy coefficients is an attempt to allow for the possibility that credit rat-ings are inadequate measures of bank credit. Thus, it is an attempt to address the first hypothesis for the decline in rate dispersion as put forward at the beginning of this section. To the extent that bank bond spreads reflect underlying bank risks more appropriately, de-clines in spreads at each rating due to such mismeasurement should be captured by the bond spread terms.26 The equation is estimated
for seven banks for which the bond yield data are available.27 The data frequency is weekly and the sample period is from October 5, 1998, to May 9, 2005.
25
To the extent that bank bond yields have responded to monetary policy, we are underestimating the effects of monetary policy on NCD issuance spreads.
26
We also estimated the equation including the bank bond spreads as one independent variable, not as an interactive term with credit rating dummies. The results were essentially the same.
27
Vol. 2 No. 1 The Bank of Japan’s Monetary Policy 129
Table 3 reports estimation results.28The results show that, even
after controlling for bank bond spreads, monetary policy has sig-nificantly contributed to the declines in risk premiums in the NCD market. Specifically, the ZIRP and QMEP dummies are significant with the right (negative) sign in most cases. That is, the commit-ments to maintain a zero interest rate have contributed to the decline in the NCD credit spreads. Also, the coefficients on bond spreads are significantly positive at credit ratings lower than Baa1 for each maturity. This result suggests that the slope of credit curves is likely to be significantly flatter at those ratings when bond spreads con-tinue to decline like the period under the QMEP.
Figure 7 graphically shows the effects of each commitment on the credit curve. The effects of the first two commitments are larger at lower ratings. For higher ratings, the effects of the QMEP commit-ment are slightly larger than those of the ZIRP commitcommit-ment. Thus, the ZIRP and QMEP commitments have flattened the credit curves for, and lowered the dispersion of, NCD issuance rates by mainly reducing risk premiums for banks with relatively low ratings.29
In contrast, the variable CAB is either insignificant or signifi-cant with a wrong (positive) sign. We tried several variations of the equation reported above, finding essentially the same result. That is, there is no evidence that higher levels of CABs have reduced risk pre-miums in the money market over and above the effect of the QMEP dummy.30
Regarding the above result, one may think that what is impor-tant is not quite the level of the CABs per se, but the level relative to ex ante demand for liquidity. In fact, during the period under study, we experienced significant fluctuations in the banks’ demand for liquidity mainly due to a changing perception about the health of the banking system. In order to take account of this possibility,
28
For estimation results for maturities other than less than 30 days, see ap-pendix table 2 at www.ijcb.org.
29
The near absence of the significant effects of the third commitment is not easy to interpret. A casual observation suggests that it stabilized JGB yields after a spike in the summer of 2003. One possibility is that it may have influenced longer-term yields more than money market rates by its clarification of the exit conditions.
30
130 International Journal of Central Banking March 2006
Table 3. Regression Results on the Role of the BOJ’s Monetary Policy: Part I
Dependent Variable: NCD Issuance Interest Rate (Less than 30 Days) —Uncollateralized Overnight Call Rate
Number of Observations: 1,929 (October 5, 1998–May 9, 2005)
Variable Coefficient Standard Error
A1 0.056 0.204
A1∗CAB
−0.001 0.006
A1∗BOND −0.051 0.261
A2 0.030 0.028
A2∗ZIRP 0.032∗∗ 0.014
A2∗QMEP −0.047∗∗∗ 0.013
A2∗TRANS
−0.014 0.012
A2∗CAB 0.001∗ 0.000
A2∗BOND 0.021 0.100
A3 0.047∗∗∗ 0.009
A3∗ZIRP −0.016∗ 0.009
A3∗QMEP
−0.051∗∗∗ 0.009
A3∗TRANS −0.021∗∗ 0.008
A3∗CAB 0.001∗∗∗ 0.000
A3∗BOND 0.002 0.018
Baa1 −0.127 0.159
Baa1∗CAB 0.004 0.005
Baa1∗BOND 0.047 0.106
Baa2 0.060∗∗∗ 0.008
Baa2∗ZIRP −0.057∗∗∗ 0.009
Baa2∗QMEP −0.068∗∗∗ 0.009
Baa2∗TRANS
−0.025∗∗ 0.010
Baa2∗CAB 0.001∗∗∗ 0.000
Baa2∗BOND 0.014∗∗∗ 0.002
Baa3 0.107∗∗∗ 0.003
Baa3∗QMEP −0.166∗∗∗ 0.012
Baa3∗TRANS 0.003 0.017
Baa3∗CAB 0.002∗∗ 0.001
Baa3∗BOND 0.039∗∗∗ 0.003
Year-end dummy 0.045∗∗∗ 0.004
Fiscal year-half dummy −0.004 0.005
Fiscal year-end dummy 0.020∗∗∗ 0.004
Adjusted R-squared 0.388
Notes:Estimation is by OLS.∗∗∗,∗∗, and∗denote the 1, 5, and 10 percent significance level, respectively.
Vol. 2 No. 1 The Bank of Japan’s Monetary Policy 131
Figure 7. Effects of the BOJ’s Monetary Policy on NCD Credit Curves
A. Effect of the ZIRP
-0.30 -0.25 -0.20 -0.15 -0.10 -0.05 0.00 0.05 0.10
A1 A2 A3 Baa1 Baa2 Baa3
Less than 30 days Less than 60 days Less than 90 days
(% point)
B. Effect of the QMEP
-0.30 -0.25 -0.20 -0.15 -0.10 -0.05 0.00 0.05 0.10
A1 A2 A3 Baa1 Baa2 Baa3
Less than 30 days Less than 60 days Less than 90 days
(% point)
(continued)
132 International Journal of Central Banking March 2006
Figure 7 (continued). Effects of the BOJ’s Monetary Policy on NCD Credit Curves
C. Effect of the Enhancement of Transparency
(% point)
-0.30 -0.25 -0.20 -0.15 -0.10 -0.05 0.00 0.05
A1 A2 A3 Baa1 Baa2 Baa3
Less than 30 days Less than 60 days Less than 90 days
Notes: Each curve is drawn using parameter estimates reported in table 3.
Credit ratings are the long-term ratings of Moody’s.
shown in table 4, TERM in fact comes in negatively and is sig-nificant at many credit ratings below A1 for each maturity.31 The
rest of the estimation results,BOND coefficients, are similar to the results reported in table 3.32 Thus, we cannot deny the possibility that increasingly longer-dated operations in the money market have lowered risk premiums.
To summarize, monetary policy, particularly the commitments to maintain a zero interest rate until deflation ends under the ZIRP and QMEP, has contributed to the decline in the dispersion of NCD issuance rates. The effect of the quantitative easing aspect of the QMEP on credit spreads, CABs well in excess of the levels
31
For estimation results of maturities other than less than 30 days, see appendix table 3 at www.ijcb.org.
32
[image:29.612.124.448.170.353.2]Vol. 2 No. 1 The Bank of Japan’s Monetary Policy 133
Table 4. Regression Results on the Role of the BOJ’s Monetary Policy: Part II
Dependent Variable: NCD Issuance Interest Rate (Less than 30 Days) —Uncollateralized Overnight Call Rate
Number of Observations: 1,515 (January 4, 2001–May 9, 2005)
Variable Coefficient Standard Error
A1 −0.059 0.042
A1∗TERM 0.010 0.007
A1∗BOND 0.062 0.143
A2 0.018 0.014
A2∗TERM −0.003 0.002
A2∗BOND 0.019 0.047
A3 0.028∗∗∗ 0.006
A3∗TERM
−0.005∗∗∗ 0.001
A3∗BOND 0.015∗ 0.009
Baa1 0.038 0.024
Baa1∗TERM −0.006∗ 0.003
Baa1∗BOND −0.020 0.061
Baa2 0.040∗∗∗ 0.007
Baa2∗TERM −0.007∗∗∗ 0.002
Baa2∗BOND 0.013∗∗∗ 0.003
Baa3 0.048∗∗∗ 0.009
Baa3∗TERM
−0.060∗∗ 0.002
Baa3∗BOND 0.008∗∗∗ 0.002
Year-end dummy 0.002 0.002
Fiscal year-half dummy −0.000 0.002
Fiscal year-end dummy 0.015∗∗∗ 0.002
Adjusted R-squared 0.167
Notes: Estimation is by OLS.∗∗∗,∗∗, and ∗ denote the 1, 5, and 10 percent significance level, respectively.
Credit ratings are the long-term ratings of Moody’s.
134 International Journal of Central Banking March 2006
It is important to note that we have not attempted to estimate the effects of the BOJ’s monetary policy on a wider range of in-struments. The commitments of the maintenance of a zero interest rate may have had significant effects on longer-term interest rates.33 Quantitative easing and/or targeted asset purchases may have also affected asset prices other than money market rates.34
5. Concluding Remarks
We have shown that not just the levels of money market rates but also their dispersion have declined since 1999. We have documented this in detail for NCD issuance rates. In particular, the decline in rate dispersion cannot be fully accounted for by improvements in bank credit. That is, risk premiums have declined sharply across the board in the money market. We have found a similar tendency for a decline in spreads for longer-dated bank liabilities and for bonds issued by nonfinancial corporations. Many factors, including monetary policy, probably played a role behind the declines in risk premiums for such a wide range of instruments.
We have provided evidence, however, for a stronger tendency for risk premiums on NCD issuance rates to decline than for other longer-maturity instruments, as well as for instruments issued by nonfinancial corporations. We have found that the BOJ’s monetary policy has played a role here. In particular, the commitments to maintain a zero interest rate until deflationary pressure ends both under the ZIRP and QMEP have significantly contributed to the declines in the spreads. We have not found a similar effect from increases in the CABs, but have identified the possibility that some particular operations that the BOJ carried out to increase the supply of liquidity—for example, longer-dated money market operations— have lowered the spreads.
33
Bernanke, Reinhart, and Sack (2004) and Oda and Ueda (2005) present evi-dence consistent with such a view.
34
Vol. 2 No. 1 The Bank of Japan’s Monetary Policy 135
References
Baba, Naohiko, Shinichi Nishioka, Nobuyuki Oda, Masaaki Shi-rakawa, Kazuo Ueda, and Hiroshi Ugai. 2005. “Japan’s Defla-tion, Problems in the Financial System and Monetary Policy.” Monetary and Economic Studies 23:47–111.
Bernanke, Ben S., Vincent R. Reinhart, and Brian P. Sack. 2004. “Monetary Policy Alternatives at the Zero Bound: An Empirical Assessment.” Brookings Papers on Economic Activity 2:1–100. Merton, Robert C. 1974. “On the Pricing of Corporate Debt: The
Risk Structure of Interest Rates.” Journal of Finance 29 (2): 449–70.
Nishioka, Shinichi, and Naohiko Baba. 2004. “Credit Risk Taking by Japanese Investors: Is Skewness Risk Priced in Japanese Corpo-rate Bond Market?” Working Paper No. 04-E-7, Bank of Japan. Oda, Nobuyuki, and Kazuo Ueda. 2005. “The Effects of the Bank of Japan’s Zero Interest Rate Commitment and Quantitative Mon-etary Easing on the Yield Curve: A Macro-Finance Approach.” Working Paper No. 05-E-6, Bank of Japan.
Appendix Table 1. Estimation Results of Credit Curves for NCD Issuance Rates
A. Maturity of Less than 60 Days
Dependent Variable: NCD Issuance Interest Rate —Uncollateralized Overnight Call Rate
1997 1999 2002 2004 2005
Constant −0.043 0.237∗∗∗ 0.044∗∗∗
Aa2 0.083
Aa3 0.071
A1 0.089 −0.023∗∗∗ 0.018∗∗∗
A2 0.095 −0.195∗∗∗ 0.005 −0.033∗∗∗ 0.013∗∗∗
A3 0.100 −0.173∗∗∗ 0.023∗∗∗ −0.023∗∗∗ 0.033∗∗∗
Baa1 0.109 −0.166∗∗∗ 0.045∗∗∗ −0.022∗∗∗ 0.028∗∗∗
Baa2 0.085 −0.089∗ 0.071∗∗∗ −0.008∗∗ 0.030∗∗∗
Baa3 0.179 −0.102∗∗ 0.072∗∗∗ 0.006
Year-end dummy 0.298∗∗∗ 0.278∗∗∗
−0.002 −0.000
Fiscal year-half dummy 0.026∗
−0.064∗∗∗ −0.005 0.004∗∗∗
Fiscal year-end dummy 0.012 0.147∗∗∗ 0.088∗∗∗ 0.010∗∗∗ 0.006∗∗∗
Adjusted R-squared 0.371 0.453 0.401 0.554 0.213
Number of observations 723 710 665 640 236
Aa2 52 0 0 0 0
Aa3 48 0 0 0 0
A1 79 8 0 47 133
A2 128 73 52 69 19
A3 52 71 207 193 28
Baa1 205 243 106 202 48
Baa2 56 216 155 56 8
Baa3 102 99 145 44 0
No rating 1 0 0 29 0
Notes:Estimation is by OLS. ***, **, and * denote the 1, 5, and 10 percent significance
level, respectively.
Appendix Table 1 (continued). Estimation Results of Credit Curves for NCD Issuance Rates
B. Maturity of Less than 90 Days
Dependent Variable: NCD Issuance Interest Rate —Uncollateralized Overnight Call Rate
1997 1999 2002 2004 2005
Constant −0.060 0.093∗∗ 0.045∗∗∗
Aa2 0.125
Aa3 0.132
A1 0.134 −0.021∗∗∗ 0.026∗∗∗
A2 0.128 −0.079∗ −0.004 −0.030∗∗∗ 0.031∗∗∗
A3 0.131 −0.048 0.027∗∗∗ −0.021∗∗∗ 0.043∗∗∗
Baa1 0.155 −0.038 0.069∗∗∗ −0.011∗∗ 0.041∗∗∗
Baa2 0.161 0.056 0.079∗∗∗ 0.003 0.034∗∗∗
Baa3 0.210∗ 0.059 0.088∗∗∗
−0.009∗
Year-end dummy 0.129∗∗∗ 0.202∗∗∗
−0.002 0.004∗
Fiscal year-half dummy 0.021 −0.028∗ −0.001 0.006∗∗∗
Fiscal year-end dummy −0.030∗∗ 0.246∗∗∗ 0.070∗∗∗ 0.009∗∗∗ 0.002
Adjusted R-squared 0.194 0.554 0.332 0.321 0.164
Number of observations 588 511 523 497 193
Aa2 52 0 0 0 0
Aa3 50 0 0 0 0
A1 74 8 0 44 126
A2 119 64 40 54 18
A3 50 70 202 177 19
Baa1 160 198 81 151 24
Baa2 31 125 122 40 6
Baa3 51 46 78 20 0
No rating 1 0 0 11 0
Notes:Estimation is by OLS. ***, **, and * denote the 1, 5, and 10 percent significance
level, respectively.
Appendix Table 2. Regression Results on the Role of the BOJ’s Monetary Policy: Part I
A. Maturity of Less than 60 Days
Dependent Variable: NCD Issuance Interest Rate —Uncollateralized Overnight Call Rate
Number of Observations: 1,890 (October 5, 1998–May 9, 2005)
Variable Coefficient Standard Error
A1 −0.022 0.295
A1*CAB 0.001 0.009
A1*BOND −0.134 0.378
A2 0.077∗ 0.042
A2*ZIRP 0.055∗∗ 0.021
A2*QMEP −0.092∗∗∗ 0.020
A2*TRANS −0.014 0.018
A2*CAB 0.001 0.001
A2*BOND 0.020 0.149
A3 0.116∗∗∗ 0.013
A3*ZIRP −0.026∗ 0.013
A3*QMEP −0.117∗∗∗ 0.013
A3*TRANS −0.018 0.011
A3*CAB 0.001 0.001
A3*BOND 0.015 0.027
Baa1 −0.226 0.230
Baa1*CAB 0.006 0.007
Baa1*BOND 0.142 0.156
Baa2 0.125∗∗∗ 0.011
Baa2*ZIRP −0.126∗∗∗ 0.014
Baa2*QMEP −0.146∗∗∗ 0.013
Baa2*TRANS −0.039∗∗ 0.014
Baa2*CAB 0.002∗∗∗ 0.001
Baa2*BOND 0.042∗∗∗ 0.003
Baa3 0.173∗∗∗ 0.015
Baa3*QMEP −0.242∗∗∗ 0.017
Baa3*TRANS 0.001 0.024
Baa3*CAB 0.002∗ 0.001
Baa3*BOND 0.051∗∗∗ 0.004
Year-end dummy 0.064∗∗∗ 0.005
Fiscal year-half dummy −0.004 0.005
Fiscal year-end dummy 0.028∗∗∗ 0.005
Adjusted R-squared 0.506
Notes: Estimation is by OLS. ***, **, and * denote the 1, 5, and 10 percent
significance level, respectively.
Appendix Table 2 (continued). Regression Results on the Role of the BOJ’s Monetary Policy: Part I
B. Maturity of Less than 90 Days
Dependent Variable: NCD Issuance Interest Rate —Uncollateralized Overnight Call Rate
Number of Observations: 1,540 (October 5, 1998–May 9, 2005)
Variable Coefficient Standard Error
A1 0.034 0.247
A1*CAB −0.001 0.007
A1*BOND −0.081 0.314
A2 0.146∗∗∗ 0.041
A2*ZIRP −0.021 0.017
A2*QMEP −0.124∗∗∗ 0.018
A2*TRANS 0.005 0.018
A2*CAB −0.001 0.001
A2*BOND −0.071 0.146
A3 0.142∗∗∗ 0.011
A3*ZIRP −0.047∗∗∗ 0.011
A3*QMEP −0.146∗∗∗ 0.011
A3*TRANS −0.010 0.009
A3*CAB 0.001 0.000
A3*BOND 0.041∗ 0.023
Baa1 −0.271 0.236
Baa1*CAB 0.007 0.007
Baa1*BOND 0.269 0.165
Baa2 0.199∗∗∗ 0.013
Baa2*ZIRP −0.226∗∗∗ 0.014
Baa2*QMEP −0.218∗∗∗ 0.013
Baa2*TRANS −0.023∗ 0.014
Baa2*CAB 0.001∗∗ 0.001
Baa2*BOND 0.059∗∗∗ 0.004
Baa3 0.216∗∗∗ 0.015
Baa3*QMEP −0.255∗∗∗ 0.017
Baa3*TRANS 0.004 0.023
Baa3*CAB 0.001 0.001
Baa3*BOND 0.050∗∗∗ 0.004
Year-end dummy 0.040∗∗∗ 0.005
Fiscal year-half dummy 0.003 0.005
Fiscal year-end dummy 0.019∗∗∗ 0.005
Adjusted R-squared 0.615
Notes: Estimation is by OLS. ***, **, and * denote the 1, 5, and 10 percent
significance level, respectively.
Appendix Table 3. Regression Results on the Role of the BOJ’s Monetary Policy: Part II
A. Less than 60 Days
Dependent Variable: NCD Issuance Interest Rate —Uncollateralized Overnight Call Rate
Number of Observations: 1,490 (January 4, 2001–May 9, 2005)
Variable Coefficient Standard Error
A1 −0.154∗∗∗ 0.049
A1*TERM 0.025∗∗∗ 0.008
A1*BOND 0.126 0.165
A2 0.022 0.016
A2*TERM −0.007∗∗∗ 0.003
A2*BOND 0.054 0.055
A3 0.048∗∗∗ 0.007
A3*TERM −0.010∗∗∗ 0.002
A3*BOND 0.026∗∗ 0.011
Baa1 0.048∗ 0.028
Baa1*TERM −0.008∗∗ 0.004
Baa1*BOND −0.015 0.071
Baa2 0.041∗∗∗ 0.008
Baa2*TERM −0.008∗∗∗ 0.002
Baa2*BOND 0.044∗∗∗ 0.004
Baa3 0.082∗∗∗ 0.010
Baa3*TERM −0.010∗∗∗ 0.003
Baa3*BOND 0.007∗∗∗ 0.003
Year-end dummy 0.006∗∗ 0.003
Fiscal year-half dummy 0.004 0.003
Fiscal year-end dummy 0.035∗∗∗ 0.003
Adjusted R-squared 0.390
Notes:Estimation is by OLS. ***, **, and * denote the 1, 5, and 10 percent
significance level, respectively.
Appendix Table 3 (continued). Regression Results on the Role of the BOJ’s Monetary Policy: Part II
B. Less than 90 Days
Dependent Variable: NCD Issuance Interest Rate —Uncollateralized Overnight Call Rate
Number of Observations: 1,248 (January 4, 2001–May 9, 2005)
Variable Coefficient Standard Error
A1 −0.193∗∗∗ 0.053
A1*TERM 0.033∗∗∗ 0.009
A1*BOND 0.095 0.179
A2 0.055∗∗∗ 0.021
A2*TERM −0.013∗∗∗ 0.003
A2*BOND −0.028 0.066
A3 0.056∗∗∗ 0.007
A3*TERM −0.011∗∗∗ 0.002
A3*BOND 0.025∗∗ 0.011
Baa1 0.055 0.038
Baa1*TERM −0.011∗ 0.006
Baa1*BOND 0.029 0.095
Baa2 0.032∗∗∗ 0.010
Baa2*TERM −0.006∗∗∗ 0.002
Baa2*BOND 0.059∗∗∗ 0.005
Baa3 0.082∗∗∗ 0.011
Baa3*TERM −0.011∗∗∗ 0.003
Baa3*BOND 0.014∗∗∗ 0.003
Year-end dummy 0.012∗∗∗ 0.003
Fiscal year-half dummy 0.008∗∗ 0.003
Fiscal year-end dummy 0.048∗∗∗ 0.003
Adjusted R-squared 0.448
Notes:Estimation is by OLS. ***, **, and * denote the 1, 5, and 10 percent
significance level, respectively.
Appendix Figure 1. Size of the NCD Market
0 5 10 15 20 25 30 35 40 45 50
94 95 96 97 98 99 00 01 02 03 04
0 10 20 30 40 50 60 70 80 90 100
Amount outstanding of NCDs issued by domestic banks (left scale)
Ratio of NCDs to total funding needs from markets (right scale)
Year
(Trillion yen) (%)
Notes: The amount outstanding is based on the banking account of domestically licensed banks and the ratio of NCDs to total funding needs from markets is based on city and trust banks.
Total funding needs from markets is defined as the sum of NCDs, CP, call money, bank bonds (including bank debentures), and repurchase agreements.
Appendix Figure 2. NCD Issuance by Maturity
0 10 20 30 40 50 60 70 80 90 100
94 95 96 97 98 99 00 01 02 03 04
Year
less than 30 days less than 60 days less than 90 days
less than 120 days
Notes:Calculation is based on city and trust banks.
The maturity of less than 60 days denotes the maturity of 60 days to 89 days, and the maturity of less than 90 days denotes the maturity of 60 days to 179 days, respectively.
Appendix Figure 3. Standard Deviation of Fund-Raising Costs via Deposits Among Banks
0.00 0.05 0.10 0.15 0.20 0.25 0.30
95.01 96.01 97.01 98.01 99.01 00.01 01.01 02.01 03.01 04.01 0.0 0.1 0.2 0.3 0.4 0.5 0.6 0.7 0.8 0.9 1.0
Standard Deviation <left scale>
Average <right scale>
(% point) (%)
ZIRP QMEP
Note: Sample banks include city banks, regional banks, and regional banks II.