42
Simulation and Performance Analysis of 2-D
Codes at 1 Gbps and 1.25 Gbps Data Rate for
OCDMA LAN Applications
Ravindra Nagar
School of ICT,
Gautam Buddha University,
Greater Noida, U.P. - 201308, INDIA
Gurjit Kaur
Phd, Assistant Professor, School of ICT,
Gautam Buddha University,
Greater Noida, U.P. - 201308, INDIA
ABSTRACT
Two main forces behind a lot of interest in the OCDMA techniques are the ability to support asynchronous, bursty data transmission and data access security. To achieve high speed connectivity with a large bandwidth, OCDMA is a highly flexible technique. This paper describes a simulated system for an incoherent OCDMA system using high performance 2-D codes. In this paper we have designed an OCDMA system for 1 Gbps and 1.25 Gbps using (8×4) wavelength hopped-time spreaded 2-D optical codes. The analysis takes into account the effect of data rate for increasing number of users at different length of fibers. The system performance is evaluated by Q-Factor analysis and timing diagram at different data rates i.e. 1 Gbps and 1.25 Gbps Results show that the designed system provides adequate BER (10-9) for 1 Gbps up to 10 users.
Keywords
Optical Orthogonal Codes (OOC’s), Multiple Access Interference (MAI), Optical Code Division Multiple Access (O-CDMA), Q-Factor.
1. INTRODUCTION
Optical communication is a communication technique to transport information from one place to another by using light as a carrier and optical fiber as a transmission media. Optical fiber has
[image:1.612.118.499.499.661.2]enormous communication capacity and the capacity of the communication depends on the carrier frequency [1]. The larger the carrier frequency, larger the available transmission bandwidth and therefore greater information capacity of the communication system [2]. Optical fiber has transmission loss as low as 0.2 dB/km. Fig 1 shows the block diagram of Optical CDMA system. In OCDMA system, the signal is broadcast to each subscriber in the network and a receiver in each node can detect the information sent to it from the assigned codeword. If the output of the decoder is in autocorrelation then the receiver can detect the signal sent to it from the pseudorandom signals. On the other hand, if the output of the decoder is in cross-correlation function, then receiver can not receive the information. So, in order to implement OCDMA system, codes with high autocorrelation & low cross correlation with sufficient performance are required. When a set of code is chosen, a code should be constructed such that it has a large dictionary of codeword as necessary and good auto and cross correlation so that the interference from other nodes can be covered up effectively by decoding the signals. The incoherent OCDMA system correspond to binary “1” and “0” using the presence of light signal and absence of light signal and implement unipolar encoding. But, the larger the number of subscribers in the network, the more serious is the Multiple Access Interference (MAI) and the bit error rate of the system increases [3].
43 codes are of increasing interest as compared to Optical
Orthogonal Codes and prime codes because of their high cardinality [4].
In this research we have designed the optical encoder & decoder structure by using frequency hopped-time spreaded 2-D codes. Further the OCDMA system is designed to check the performance of these 2-D codes. The performance of the OCDMA system is evaluated for various data rates i.e. 1 Gbps & 1.25 Gbps. Next section will describe the system design of OCDMA for LAN application.
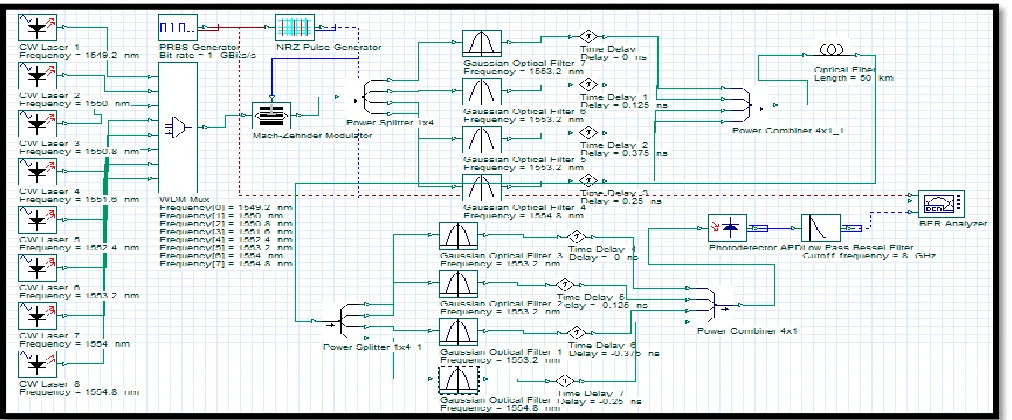
2. SYSTEM DESIGN
CW Laser is used as an optical source in the OCDMA system. It generates a continuous wave (CW) optical signal. Pseudo Random Bit Sequence (PRBS) generator is used to generate random data of 26 pattern length. An electrical Non Return-to-Zero (NRZ) pulse generator is used to convert digital data into electrical signal. A Mach-Zehnder modulator, modulates the
(ns) rate rate
T1 0 0
T2 0.1250 0.1000
T3 0.2500 0.2000
T4 0.3750 0.3000
T5 0.5000 0.4000
T6 0.6250 0.5000
T7 0.7500 0.6000
[image:2.612.321.554.215.426.2]T8 0.8750 0.7000
[image:2.612.54.560.462.672.2]44 Fig 3: CW Laser output at 1549.2 nm
Fig 4: Spectrum at Multiplexer Output
[image:3.612.321.549.72.255.2]Fig 5: NRZ signal data bits
Fig 6: Photodetector output
[image:3.612.326.548.338.557.2]Thus the eight encoders of the system generate 8 encoded signals for 8 users, using code 1 through 8 of the code set specified in [5]. The design parameters of the transmitter module for OCDMA system represented in the Table II.
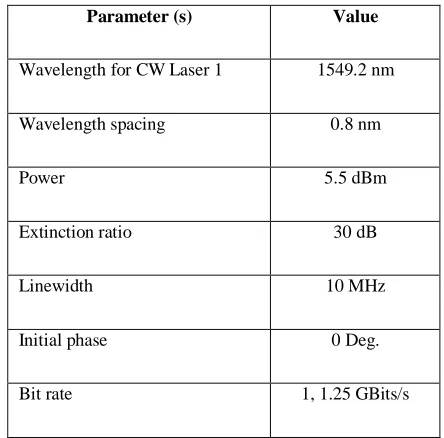
TABLE II: TRANSMITTER DESIGN PARAMETERS
Parameter (s) Value
Wavelength for CW Laser 1 1549.2 nm
Wavelength spacing 0.8 nm
Power 5.5 dBm
Extinction ratio 30 dB
Linewidth 10 MHz
Initial phase 0 Deg.
Bit rate 1, 1.25 GBits/s
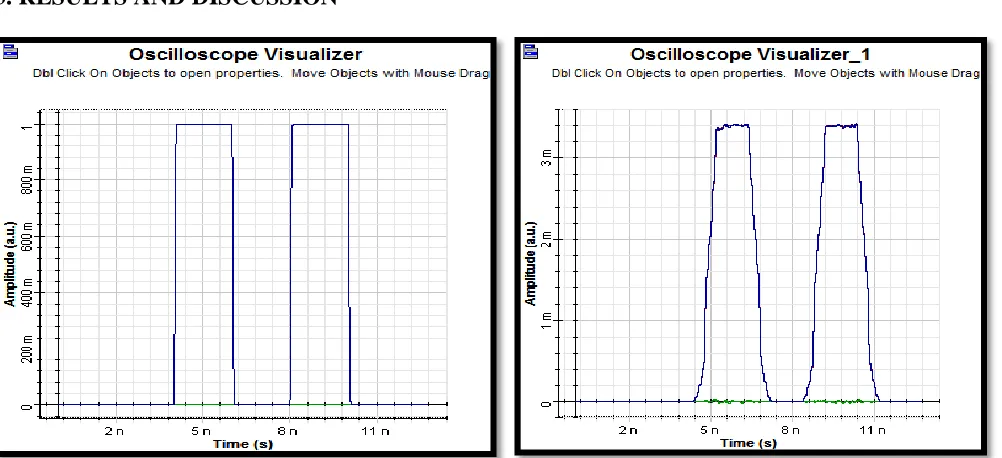
45 Fig 7: Timing diagrams at 1 Gbps for single user at transmitter and receiver
[image:4.612.55.556.460.678.2]
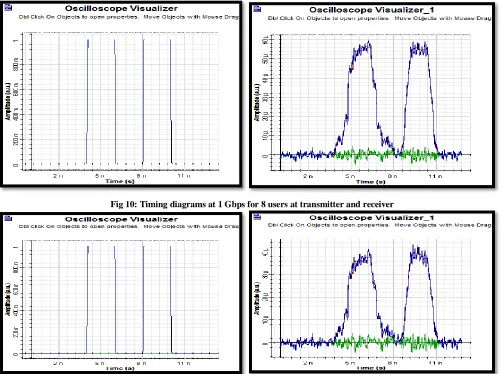
46 Fig 9: Timing diagrams at 1 Gbps for 4 users at transmitter and receiver
Fig 10: Timing diagrams at 1 Gbps for 8 users at transmitter and receiver
47 Figure 12: Q- Factor versus Fiber length for 1 user
From Fig 12 it is clear that as the distance increases the Quality factor decreases. For a distance increment from 2 km to 50 Km, the Quality factor of single user system decreases from a value of 329.06 to 86.83 at 1 Gbps data rate. For a distance increment from 2 km to 50 Km, the Quality factor of single user system decreases from a value of 18.91 to 7.55 at 1.25 Gbps bit rate. It can be seen that Q- Factor is decreasing when the fiber length is increasing.
[image:6.612.65.548.120.306.2]This means that Q-Factor is the major factor influencing the OCDMA system performance. Fig 13 shows the graph of comparative analysis between Q-Factor and fiber length at various length of fibers for 2 user system at 1 and 1.25 Gbps data rate. The horizontal axis of the graph indicates the fiber length while vertical axis shows the Q-Factor decreases.
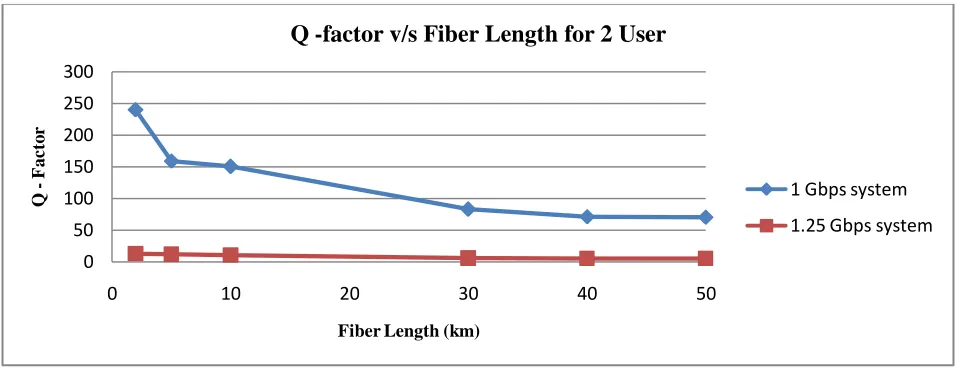
Figure 13: Q- Factor versus Fiber length for 2 users
From Fig 13 it is clear that as the distance increases the Quality factor decreases. For a distance increment from 2 km to 50 Km for 2 user system the Quality factor decreases from a value of 240.05 to 70.05 at 1Gbps data rate. For a distance increment from 2 km to 50 Km for 2 user system the Quality factor decreases from a value of 12.62 to 5.30 at 1.25 Gbps data rate. It can be seen
that Q- Factor is decreasing when the fiber length is increasing. Fig 14 shows the graph of comparative analysis between Q-Factor and fiber length at various length of fibers for 4 user system at 1 and 1.25 Gbps data rate. The horizontal axis of the graph indicates the fiber length while vertical axis shows the Q-Factor decreases [7].
0
50
0
10
20
30
40
50
Fiber Length (km)
0
50
100
150
200
250
300
0
10
20
30
40
50
Q
-F
ac
to
r
Fiber Length (km)
Q -factor v/s Fiber Length for 2 User
1 Gbps system
[image:6.612.67.547.413.598.2]48 Figure 14: Q- Factor versus Fiber length for 4 users
From Fig 14 it is clear that as the distance increases the Quality factor decreases. For a distance increment from 2 km to 50 Km, the Quality factor of 4 user system decreases from a value of 118.28 to 48.10 at 1Gbps data rate. For a distance increment from 2 km to 50 Km, the Quality factor of 4 user system decreases from a value of 8.17 to 4.33 at 1.25 Gbps bit rate. It can be seen that Q- Factor is decreasing when the fiber length is increasing. It can also be seen that Q- Factor is decreasing when the number of users are increasing. This means that Q-Factor is the major factor influencing the OCDMA system performance [8].
4. CONCLUSION
A comparative analysis of 2-D OCDMA system for different data rates has been performed in this paper. In this work the performance of an OCDMA system has been evaluated with the increasing number of users in the form of Quality factor. Quality factor and timing diagram analysis for asynchronous concurrent users at different data rates at different length of fibers has been done.
It is shown that timing diagram height decreases and Quality factor also decreases with increase in number of active users. Hence it is concluded that MAI is the dominant source of Quality factor and there is graceful degradation in system performance when number of simultaneously active user increases.
5. REFERENCES
[1]. Jawad A. Salehi,“Code Division Multiple Access Techniques in Optical Fiber Networks-Part 1: Fundamental Principles”, IEEE Transaction on Communication, Vol.37, No.7, pp.824-833, Aug 1989.
[2]. Hyuck M.Kwon, “Optical Orthogonal Code Division Multiple Access System-Part-1:APD Noise and Thermal
Noise”, IEEE Transaction on Communication, vol.42, No.7, pp.2470-2479, July 1994.
[3]. Fan R.K.Chung and Jawad A. Salehi,“Optical Orthogonal Codes: Design, Analysis and Applications”, IEEE Transactions on Information Theory, Vol.35, No.3, May 1989.
[4]. Mendez A.J. , Gagliardi R.M. ,Hernandez V.J. , Bennett C.V., Lennon W.J., “High-Performance optical CDMA system based on 2-D optical orthogonal codes”, Journal Of Lightwave Technology, Vol.22, No.11, pp.2409-2419, Nov 2004.
[5]. Vincent J. Hernandez, Antonio J. Mendez, Corey V. Bannett, Robert M. Gagliardand William J. Lennon, “Bit Error-Rate Analysis of a 16-User Gigabit Ethernet Optical CDMA (O-CDMA) Technology Demonstration Using Wavelength/Time Codes”, IEEE Photonics Technology Letters, Vol.17, No.12, pp.2784-2786, Dec 2005.
[6]. Neena Gupta, Divyesh M.Saxena, “Performance Comparison of High Speed LAN Optical CDMA Systems at Different Data Rates” IEEE ICTON, pp.127-131, 2007.
[7]. Z. Wang, J. Chang and Paul R. Prucnal, “Theoretical Analysis and Experimental Investigation on the Confidentiality of 2-D Incoherent Optical CDMA System”, Journal of Lightwave Technology, Vol.28, No.12, June 2010.
[8]. R. Poboril, J. Latal, P. Koudelka, J. Vitasek, P. Siska, J. Skapa and V. Vasinek, “ A Concept of a Hybrid WDM/TDM Topology using the Fabry-Perot Laser in the Optiwave Simulation Environment” ,Optics and Optoelectronics, Vol.9, No.4, pp.167-178, Dec 2011.
0
20
40
60
80
100
120
140
0
10
20
30
40
50
Q -F ac to r
Fiber Length (km)