Efficient Transmission of Information using
Transmission Code along FHSS
Adeel Ahmad
Asst. Prof Institute of Physics and Electronics University of Peshawar
Rahat Ullah
Department of CS &IT Sarhad University of Science &IT
Shahid Lateef
Department of CS &IT Sarhad University of Science &IT
ABSTRACT
Spread Spectrum is a modulation technique in which a signal is transmitted on a considerable larger bandwidth than the frequency contents of the original information. In other words, the signal of particular bandwidth is intentionally spread in the frequency domain, resulting in a signal having wider bandwidth. Here the minimum new bandwidth is much larger than the minimum required frequency spectrum. Frequency Hoping Spread Spectrum (FHSS) is one of the common forms/techniques of the Spread Spectrum, in which frequency is not remained fixed to the specified band of the frequency. Here the carrier frequency changes from one frequency to the other at every instant of time. Normally carrier frequency changes thousands time in a second. In FHSS synchronization of transmitter and receiver is necessary. In case, if the receiver is not synchronized with transmitter due to any reason, the recovery of the original information from its spread spectrum is merely impossible. To overcome this problem we propose a technique in which a code is combined and sent with the modulated signal before using the FHSS technique. Using this transmission code we can synchronize the receiver with transmitter at any instant of time. This proposed work is implemented and analyzed using MATLAB Simulation.
Index terms
Spread Spectrum, FHSS, MATLAB, Simulink.
Key words
Synchronization , delay, transmission code, transmitter/receiver, simulation.
1.
INTRODUCTION
By definition, Spread Spectrum is a technique in which a telecommunication (either electrical or electromagnetic) signal is transmitted on a wider bandwidth than the bandwidth or the frequency content of the original information. Spread-spectrum telecommunications is a signal structuring/making technique that employs several forms: direct sequence (DSSS), frequency hopping (FHSS), or a hybrid of these, which can be used for multiple access and/or multiple functions. Using spread spectrum technique the potential interference can be decreased and the privacy of the transmission can be achieved [x]. It generally use a sequential noise-like signal structure to spread the narrowband information signal over a relatively wideband signal (radio frequency/band of frequencies). At the receiving side, the original information signal is recovered or retrieved from the received spread signal.
In fact, from [2, 3 & 4], a spread-spectrum system uses a process other than the information signal to expand, or spread, the bandwidth of the signal. The two fundamental techniques for spectrum spreading are direct sequence and frequency hopping. These achieve the desired spectrum spreading. These techniques are used for a variety of reasons including secure communications, prevent detection, robustness or security of a radio link, multiple access between a number of users, decreasing the interference, noise and anti-jamming the communication etc. The Frequency Hoping Spread Spectrum (FHSS) is one of the common forms/techniques of the Spread Spectrum, in which frequency is not remained fixed to the specified band of the frequency. Here the carrier frequency changes from one frequency to the other at every instant of time. Normally carrier frequency changes thousands time in a second [y].In FHSS transmitter and receiver shown in figs.1 & 2. must be synchronized. In case, if the receiver is not synchronized with transmitter due to any reason, the recovery of the original information from its spread spectrum is merely impossible. To overcome this problem we propose a technique in which a code is combined and sent with the modulated signal before using the FHSS technique. Using this transmission code we can synchronize the receiver with transmitter at any instant of time. This proposed work is implemented and analyzed using MATLAB Simulation. This Simulink provides a graphical user interface (GUI), used in building block diagrams, performing simulations and analyzing the results.
This paper is organized in such a way that it consist of seven sections. Section one covers the brief introduction of the spread spectrum, need of spread spectrum, importance, applications, its common techniques and the proposed work. Section two is the overview of the frequency hopping spread spectrum FHSS technique. Section three covers the explanation for each step of the proposed work. While section four covers the complete block diagram of the proposed work as introduced earlier, while last section concludes the paper.
2.
FREQUENCY HOPING SPREAD
SPECTRUM
techniques: Frequency Hopping (FHSS) and Direct Sequence (DSSS). By comparing the performances of both techniques relative to a few parameters of communications systems, we found that there is no “good” technology and “bad” technology, but that there are applications were FHSS performs better than DSSS, and obviously there are applications were the opposite is true [S].
Frequency-hopping spread spectrum is a method of transmitting radio signals by rapidly switching a carrier among many frequency channels, using a pseudorandom sequence known to both transmitter and receiver. It is utilized as a multiple access method in the frequency-hopping code division multiple access (FH-CDMA) scheme. A spread-spectrum transmission offers three main advantages over a fixed-frequency transmission:
1. Spread-spectrum signals are highly resistant to narrowband interference. The process of re-collecting a spread signal spreads out the interfering signal, causing it to recede into the background.
2. Spread-spectrum signals are difficult to intercept. An FHSS signal simply appears as an increase in the background noise to a narrowband receiver. An eavesdropper would only be able to intercept the transmission if the pseudorandom sequence was known.
[image:2.595.323.553.157.352.2]3. Spread-spectrum transmissions can share a frequency band with many types of conventional transmissions with minimal interference. The spread-spectrum signals add minimal noise to the narrow-frequency communications, and vice versa. As a result, bandwidth can be utilized more efficiently.
Fig.1 FHSS transmitter
Fig. 2 FHSS receiver
3.
FULL FHSS SYSTEM
The information is provided through the sine wave which is carried from the Simulink library shown in fig.3. Then the four modulators of different frequencies are used to modulate the information on different carriers. Then these modulated signals are controlled through the switches. This allows only one carrier at a time.
Fig. 3 Block diagram for FHSS system
4.
MODULATING SIGNAL
[image:2.595.55.281.373.718.2]The information signal that is the modulating signal or the base band signal is shown in the figure. 4. The modulating signal is a sinusoidal signal with amplitude of 1 volt. The modulating signal is being applied to one input of the modulator. The carrier is applied to another input of the modulator.
Fig. 4 Information signal
5.
CARRIER SIGNAL
[image:2.595.320.538.465.668.2]Here in this model above there only three carriers are used. The frequencies of the carrier are managed. However we may use any number of the carrier signal.
[image:3.595.327.503.182.392.2]As we are doing the frequency hopping, so in the frequency hopping there are millions of the carrier frequencies are used and being switched with a very high speed. As in slow frequency hopping 217 hops per second. And in fast frequency hopping the hopping speed is very high.
Fig. 5 Carrier Signal
6.
HOW TO CHANGE THE
PARAMETERS OF A SIGNAL
We can change the parameters of the information signal as well as the carrier signal. The amplitude and the frequency of both the information signal and the carrier signal can be changed. To do so simply double click on the source of the signal that is the sinusoidal signal or the digital signal in fig.6. You will get a window . Now you can change the amplitude, frequency, phase and the other parameters of the signal. So simply change the values and apply the setting and click OK.
Fig. 6 Changing parameters
7.
MODULATOR
[image:3.595.58.276.184.352.2]Here we have four modulators, the parameters of the each modulator is set at the different carrier frequencies. The frequency of the each modulator is different from each other .The output signal is different ,the output is shown in the fig 8. Here in the model the DSBSC –AM is used. Here in this model the carrier are the internal however In the modulator the carriers are the external. Same here the parameters of the modulator can be changed.
Fig. 7 Modulators
8.
MODULATED SIGNAL ON SCOPE
The output of the modulators is shown in the figure.8 below. As how many carriers are used, the modulated signal also shows the same variation. We can see the light and the dense concentration of the frequency depending on the carrier frequency.
[image:3.595.58.275.502.709.2] [image:3.595.319.536.509.714.2]9.
SWITCHES
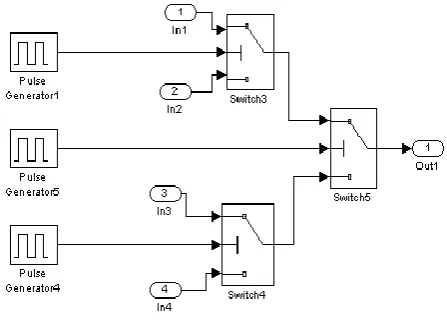
Switches are used for switching the carrier periodically or in the sequence that is selected. Switch three is used to switch the two modulated signal, the modulated signal one and the modulated signal two. Switch four is used to switch the two modulated signal as well. These are the modulated signal three and the modulated signal four. Then the switch five is used to switch the output of the switch three and the switch four. So doing this we can switch the four carrier simultaneously shown in fig.9.
However the time periods are important here. The time period is provided by the pulse generator one and the pulse generator two. The time period of the pulse generator one and four is two and the time period of the pulse generator is four. The time period can be set by double clicking the pulse generator.
These time period of the pulse generators are important because using these switches more than two signal cannot be switched. So using this configuration the four modulating signal can be switched. However if we have such a switch which could switch the entire modulating signal that can also be used.
Fig. 9 Switching the data
10.
CODES
The important was the code to send with the modulating signal.
A technique used for the code is shown below in the figure. VCOs are used to convert the input constant value into the relative frequency. The central frequency is set through the double clicking the VCO.
[image:4.595.326.555.78.230.2]When input value is changed then the output of the frequency of the VCO is changed according to that proportion shown in fig10. These codes are multiplexed though the multiplexer. The output is then multiplexed with the information signal as well.
[image:4.595.320.536.268.439.2]Fig. 10 Sending of a code with data
Fig. 11 Multiplexing of codes
The output of the codes multiplexed form is as shown in the figure.11 above. There are different colors in the scope depending upon the different VCOs outputs.
11.
CODES MULTIPLEXED WITH
MODULATED SIGNAL
The codes multiplexed with modulated signal are shown in the main model. The output of this section is shown here in the figure by the scope.
It can be easily seen that the codes and the modulated signal are both present in this figure.12.
But we cannot separate the codes from the modulated signal without the DE multiplexing of the signal. This is the next section of the model, shown in the main model diagram. After DE multiplexing this signal we get the codes and the modulated signal separately.
[image:4.595.64.288.331.493.2]Fig. 12 Multiplexing of a code with modulated signal
12.
DE MULTIPLEXING AND
FILTERING
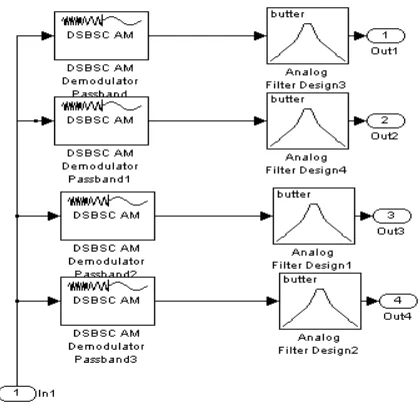
After DE multiplexing the codes from the modulated signal, we have to demodulate the modulated signal to get the information signal. As the after demodulating the we have the two terms a high frequency term and the base band signal. Our requirement is the information signal not the high frequency term. So get the required result what we have to do is that we use such a filter which could pass the information signal not the high frequency term. As we know that the information signal has a band width of zero to 3.5 kHz.
So we used band pass filters. We set the frequency range in this rage. However here in the model we used such a frequencies which we can see on the screen by naked eye.
[image:5.595.54.297.70.276.2]If we use the frequency in kilo hertz we cannot see the output visually.
Fig. 12 DE multiplexing of data
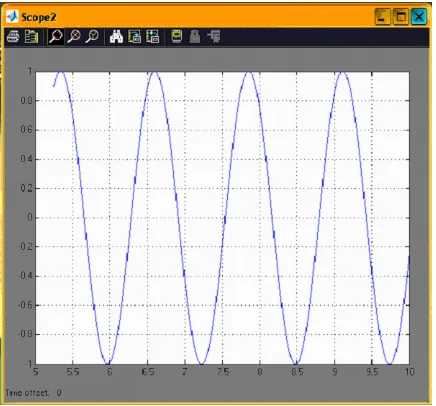
This is the output of the section of the main model after the demodulation and passing through the filters shown in fig.13.
[image:5.595.327.530.202.364.2]We showed the information signal above. It can be seen that there is a difference between the transmitted signal and the received signal. This is because of the distortion due to the filters. Secondly there are many distortions in the medium through which we transmit the signal. Distortion due to filters is also important factor. By controlling all these factors we can get the better output nearly equal to the information signal that is transmitted from the transmitter side. In real time communication the medium that is air is of very important factor. Medium is not in our control, so what we have to do is that is our system should automatic control system, which adjust according to the changes.
Fig. 13 Filtering of data
13.
ACKNOWLEDGEMENTS
Bundle of thanks to the co-authors who are also students Shahid Latif and Rahat Ullah (Telecom and Networking Scholars) and my family who really support me.
14.
REFERENCES
[1] Seok-Yee Tang, Peter Muller, Hamid Sharif “WiMAX Security and Quality of Service: An End-to-End Perspective” John wiley & Sons Ltd, the Atrium Southern Gate, Chichester, West Sussex, PO 19 8SQ, UK
[2] R. C. Dixon, Spread spectrum Systems with Commercial Applications, 3ed, John Wiley & Sons, New York, 1994 [3] M. K. Simon, J. K. Omura, R. A. Scholtz, B. K. Levitt,
Spread Spectrum Communications Handbook, McGraw-Hill, New York, 1994
[4] H. Taub, D. L. Schilling, Principles of Communication Systems, 2ed, McGraw-Hill, New York, 1986
[5] Abid Yahya, Member, IAENG, Othman Sidek, and Junita Mohamad-Saleh “Design and Develop Wireless System Using Frequency Hopping Spread Spectrum” Engineering Letters, 13:3, EL_13_3_6 (Advance online publication: 4 November 2006)
[6] Thiagarajan Viswanathan “Telecommunication Switching Systems and Networks” Prentice hall of India, Pvt Ltd, New Delhi 110 001, 2006
[7] FCC, Code of Federal Regulations CFR 47, Part 15, section .247
[image:5.595.72.281.508.712.2]