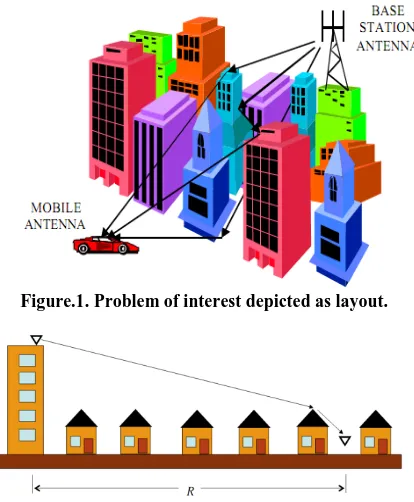
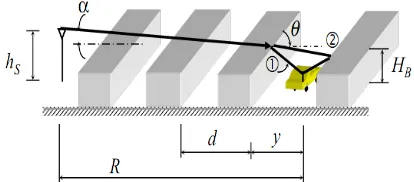
A Review on Empirical data collection and analysis of Bertoni’s model at 1 8 GHz
Full text
Figure


Related documents
The experiment showed that the yield was similar between control and fertilizer appplication during the first year observation, but at the secon year, continued fertilizer application
Naveen Kumar et al.,: Stress Degradation studies and Develpoment of Validated Stability Indicating Assay Method by RP- HPLC for Simultaneous Estimation of Naltrexone and
Computing Optimal Protection Levels: One approach in computing the optimal protection levels in the n-class static model is based on using dynamic programming recursion ( 3 )
An alternative to this scenario is that there may simply be a uniform distribution of particles, and thus particle flux increases with increasing mass flux (see Figures 14 and 15
The health hazard information presented is provided in accordance with US 29 CFR 1910.1200 and is based on the testing of individual components which have been shown to cause or
Table 1. For the TREC AP corpus and the hotel review dataset 100 topics were extracted, while 50 topics were obtained from the HICSS abstract dataset. The same custom stop
This algorithm assigns earlier generated packets to forwarders with higher queuing delays and scheduling feasibility, while assigns more recently generated packets
