Mette V. Larsen,aSalvatore Cosentino,aOksana Lukjancenko,aDhany Saputra,aSimon Rasmussen,aHenrik Hasman,b Thomas Sicheritz-Pontén,aFrank M. Aarestrup,bDavid W. Ussery,a,cOle Lunda
Center for Biological Sequence Analysis, Department of Systems Biology, Technical University of Denmark, Kongens Lyngby, Denmarka; National Food Institute, Technical University of Denmark, Kongens Lyngby, Denmarkb; Comparative Genomics Group, Biosciences Division, Oak Ridge National Laboratory, Oak Ridge, Tennessee, USAc
One of the first issues that emerges when a prokaryotic organism of interest is encountered is the question of what it is—that is, which species it is. The 16S rRNA gene formed the basis of the first method for sequence-based taxonomy and has had a tremen-dous impact on the field of microbiology. Nevertheless, the method has been found to have a number of shortcomings. In the current study, we trained and benchmarked five methods for whole-genome sequence-based prokaryotic species identification on a common data set of complete genomes: (i) SpeciesFinder, which is based on the complete 16S rRNA gene; (ii) Reads2Type that searches for species-specific 50-mers in either the 16S rRNA gene or thegyrBgene (for theEnterobacteraceaefamily); (iii) the ribosomal multilocus sequence typing (rMLST) method that samples up to 53 ribosomal genes; (iv) TaxonomyFinder, which is based on species-specific functional protein domain profiles; and finally (v) KmerFinder, which examines the number of cooc-curringk-mers (substrings ofknucleotides in DNA sequence data). The performances of the methods were subsequently evalu-ated on three data sets of short sequence reads or draft genomes from public databases. In total, the evaluation sets constituted sequence data from more than 11,000 isolates covering 159 genera and 243 species. Our results indicate that methods that sam-ple only chromosomal, core genes have difficulties in distinguishing closely related species which only recently diverged. The KmerFinder method had the overall highest accuracy and correctly identified from 93% to 97% of the isolates in the evaluations sets.
R
apid identification of the species of isolated bacteria isessen-tial for surveillance for human and animal health and for choosing optimal treatment and control measures. Since the be-ginning of microbiology more than a century ago, this has to a large extent been based on morphology and biochemical testing. However, for more than 30 years, 16S rRNA sequence data have
served as the backbone for the classification of prokaryotes (1),
and tremendous amounts of 16S rRNA sequences are available in
public repositories (2–4). However, due to the conserved nature
of the 16S rRNA gene, the resolution is often too low to adequately resolve different species and sometimes is not even adequate for
genus delineation (5, 6). Furthermore, many prokaryotic
ge-nomes contain several copies of the 16S rRNA gene with
substan-tial intergene variation (7,8). It is also considered problematic
that this gene represents only a tiny fraction, roughly about 0.1%
or less, of the coding part of a microbial genome (9).
Second- and third-generation sequencing techniques have the potential to revolutionize the classification and characterization of prokaryotes and is now being used routinely in some clinical microbiology labs. However, so far no consensus on how to utilize the vast amount of information in whole-genome sequence
(WGS) data has emerged (10). Nevertheless, a number of different
methods have been proposed. Roughly, they can be divided into those that require annotation of genes in the data and those that
employ the nucleotide sequences directly (9).
One of the first attempts to employ WGS data for taxonomic
purposes was carried out in 1999 (11). At the time, 13 completely
sequenced genomes of unicellular organisms were available, and distance-based phylogeny was constructed on the basis of the presence and absence of suspected orthologous (direct common ancestry) gene pairs. Later, it was recognized that methods that take into account gene content can be greatly influenced by hori-zontal gene transfer (HGT), and alternative methods were
devel-oped that used homologous groups (gene family content) (12) or
protein domains (13).
Functional protein domains also form the basis of a recent
approach developed by our group (14). Here, the protein domains
are combined into functional profiles of which some are species specific and can thus be used for inferring taxonomy.
As an extension of 16S rRNA analysis, which focuses on a single locus, super multilocus sequence typing (SuperMLST) has been
proposed (15). It relies on the selection of a set of genes that are
highly conserved and hence can be used with any organism. In a publication from 2012, Jolley et al. suggested that 53 genes encod-ing ribosomal proteins be used for bacterial classification in an
approach called ribosomal MLST (rMLST) (16). Not all 53 genes
were found in all bacterial genomes, but due to the relatively high number of sampled loci, this is not considered problematic. The rMLST method forms the basis of a proposed reclassification of
Neisseriaspecies (17) and has also been used for analyzing human
Campylobacterisolates (18).
It is also possible to employ the sequence data directly without preannotation of genes. For instance, this can be done using
BLAST (19). An alternative, faster approach would be to look at
Received4 November 2013Returned for modification17 December 2013
Accepted20 February 2014
Published ahead of print26 February 2014
Editor:G. A. Land
Address correspondence to Mette V. Larsen, metteb@cbs.dtu.dk.
Supplemental material for this article may be found athttp://dx.doi.org/10.1128 /JCM.02981-13.
Copyright © 2014, American Society for Microbiology. All Rights Reserved.
doi:10.1128/JCM.02981-13
The authors have paid a fee to allow immediate free access to this article.
on May 16, 2020 by guest
http://jcm.asm.org/
k-mers (substrings ofknucleotides in DNA sequence data) and
use the number of cooccurringk-mers in two bacterial genomes as
a measure of evolutionary relatedness. Using thek-mer-based
ap-proach, we have developed a method, KmerFinder, which
exam-ines all regions of the genomes, not only core genes (20).
Further-more, a gene segment will score highly despite the transposition of a gene segment within the genome since only the flanking regions will be mismatched.
In the current study, we have trained five different methods for species identification on a common data set of complete prokary-otic genomes: (i) the SpeciesFinder method, which serves as the baseline as it is based solely upon the 16S rRNA gene; (ii Reads2Type which is a variant that searched for species-specific 50-mers, predominantly within the 16S rRNA gene, with the help of non-species-specific 50-mers to quickly narrow the search; (iii) rMLST, which predicts species by examining 53 ribosomal genes; (iv) TaxonomyFinder, which is based on species-specific func-tional protein domain profiles; and finally (v) KmerFinder, which predicts species by examining the number of overlapping 16-mers.
The publicly available databases contain ample amounts of WGS data from prokaryotes, enabling us to conduct a large-scale benchmark study of the proposed methods. Hence, the process of reaching a consensus on how the WGS data should optimally be used for prokaryotic taxonomy is initiated.
MATERIALS AND METHODS
Data set. (i) Training data.In August 2011 a total of 1,647 complete genomes originating fromBacteria(1,535) andArchaea(112) were down-loaded from the National Center for Biotechnology Information (NCBI [http://www.ncbi.nlm.nih.gov/genome]). For each genome, the anno-tated taxonomy according to GenBank was compared to the taxonomy according to Entrez, which was retrieved using the taxonomy module of BioPerl. Discrepancies were checked and corrected manually. For each genome, it was also examined if the annotated name was in accordance to the List of Prokaryotic Names with Standing in Nomenclature (http: //www.bacterio.cict.fr/allnames.html) (21). When possible, names that were not in accordance were corrected to valid ones. In this way, 1,426 genomes were assigned to 847 approved genus and species names. The remaining 221 genomes, which were either assigned only to a genus, e.g.,
Vibriospp., or assigned to species with informal names, e.g.,Synechococcus islandicus, were kept in the training data under the assumption that they would influence the different methods for species identification equally. An overview of the training data is available in Table S1 in the supplemen-tal material.
(ii) Evaluation data.Three data sets were generated for the purpose of evaluating the methods. The first consisted of assembled complete or draft genomes with assigned species which were downloaded from NCBI in September 2012 and were not already part of the training data. Only genomes assigned to species that were also present in the training data were included. The set was called NCBIdraftsand consisted of genomes
from 695 isolates covering 81 genera and 149 species. The set includes three members of theArchaea, twoMethanobrevibacter smithiiisolates and oneSulfolobus solfataricusisolate. An overview of the data can be seen in Table S2 in the supplemental material.
Furthermore, in January 2012, 11,768 sets of Illumina raw reads with assigned species were downloaded from the NCBI Sequence Reads Ar-chive (SRA [http://www.ncbi.nlm.nih.gov/sra]) (22). A total of 10,517 of these had been sequenced by the Illumina Genome Analyzer II sequencer, while the remaining 1,251 had been sequenced by the Illumina HiSeq 2000 sequencer. A total of 1,361 sets of reads originated from species that were not part of the training data and were removed. The final SRAreads
data set consisted of 8,798 sets of paired-end reads and 1,609 sets of single reads, giving a total of 10,407 sets.
For the short reads of the SRAreadsset, the optimalk-mer length was
estimated and used forde novoassembly as described previously (23) using Velvet, version 1.1.04 (24). The resulting set of draft genomes con-stituted the SRAdraftsevaluation set. To measure the qualities of the draft assemblies, the N50 values were calculated (25). The draft assemblies had an average N50 of 77,018, with a range of 101 to 779,945 (see Fig. S1 in the supplemental material), an average number of scaffolds of 697, and an average size of 3,301 kb.
The SRAreadsand SRAdraftssets both cover 167 different species from 120 genera with more than 5,000 strains from theStreptococcus, Staphylo-coccus, andSalmonellagenera. There are no species fromArchaea. An overview of the SRAreadsand SRAdraftssets is available in Table S3 in the
supplemental material.
Methods for species identification. (i) SpeciesFinder.SpeciesFinder predicts the prokaryotic species based on the 16S rRNA gene. The concept of using the 16S rRNA gene for taxonomic purposes goes back to 1977 (1), but the implementation used in this study was developed by our group. A 16S database was built from the genomes of the common training data using RNAmmer (26). The species predictions were performed differently depending on the input type. If the input was short reads, the prediction was done in the following way.(a)The reads were mapped against the 16S database using the Smith-Waterman Burrows-Wheeler aligner (BWA) (27).(b)The mapped reads were assembled using Trinity (28) to obtain the 16S rRNA sequences.(c)The BLAST algorithm (19) was used to search the output from Trinity against the 16S database.(d)The best BLAST hit (see below) was chosen, and the species associated with the best hit was given as the final prediction.
When the input sequence was a draft or complete genome, the predic-tion was performed as follows.(a)The 16S rRNA gene was predicted from the input sequence using RNAmmer.(b)Using the BLAST algorithm, the predicted sequence was aligned against the 16S database.(c)The best BLAST hit (see below) was chosen, and the species associated with it given as the final prediction.
The best BLAST hit was chosen by ranking the output from the BLAST alignment by the best cumulative rank of coverage, percent identity, bit score, number of mismatches, and number of gaps. The highest ranked hit was chosen for the prediction.
SpeciesFinder is freely available at http://cge.cbs.dtu.dk/services /SpeciesFinder/.
(ii) rMLST.The rMLST method predicts bacterial species based on 53 ribosomal genes originally defined by Jolley et al. (16). The set of genes can be used in an approach similar to multilocus sequence typing (MLST), where each locus in the query genome is considered identical or noniden-tical to alleles of the corresponding locus in the reference database, and an allelic profile based on arbitrary numbers assigned to each of the alleles in the database is generated accordingly. Since the strains that we compare are more diverse than the ones compared in MLST, it is likely that many loci would have no identical matches in the database, making a simple cluster analysis based on allelic profiles problematic. To improve the res-olution of the method, in our implementation of rMLST, the nucleotide sequence of each locus is aligned to the alleles in the reference database, and a measure of the similarity of the locus and the best matching allele is used subsequently, as described below.
Briefly, for each of the genomes in the training data, the 53 ribosomal genes were extracted by BLAST and provided to us by Keith Jolley, De-partment of Zoology, University of Oxford, United Kingdom. In this way, for each genome, a gene collection of up to 53 ribosomal genes was as-signed. To predict the species of a query genome, the query genome was first aligned to each gene collection using Blat (29). Only hits with at least 95% identity and 95% coverage were considered potential matches. If there were several potential matches, the best match was selected based on the best cumulative rank of coverage, percent identity, bit score, number of mismatches, and number of gaps in the alignments. The final
on May 16, 2020 by guest
http://jcm.asm.org/
tion was given as the organism with the highest number of best hits across all genes. Our implementation of rMLST performs predictions for draft or complete genomes but not short reads.
(iii) TaxonomyFinder.The TaxonomyFinder method is based on tax-onomy group-specific protein profiles developed by our group (14; Luk-jancenko et al., submitted). It performs predictions for draft or complete genomes but not for short reads. The common training data were used to create the taxonomy-specific profile database. Briefly, for each genome, functional profiles were assigned based on three collections of hidden Markov model (HMM) databases: PfamA (30), TIGRFAM (31), and Su-perfamily (32). Genes that did not match any entry in the HMM databases were clustered using CD-HIT (33). Further, genomes were grouped ac-cording to the taxonomy level, either phylum or species, and profiles that were specific to each taxonomic group were extracted. Profiles were con-sidered specific to a taxonomic group if they were conserved in 30 to 100% of the genomes within a phylum/species group and absent in all genomes outside the group. The actual threshold for conservation depended on the size of the group, with large groups having smaller thresholds for conser-vation. The workflow of the TaxonomyFinder method is a four-step pro-cess, as follows.(a)The open reading frame is predicted using Prodigal (34).(b)Functional profiles are constructed from protein coding se-quences.(c)Functional profiles are assigned.(d)Functional profiles are compared to the taxonomy-specific profile database. The number of ar-chitectures, matched to each of the taxonomy groups, is recorded, and the fraction of taxon-specific genes (score) is calculated. The best-matching taxonomy group is selected based on a consensus of the best score and highest number of matched architectures.
TaxonomyFinder is freely available athttp://cge.cbs.dtu.dk/services /TaxonomyFinder/.
(iv) KmerFinder.The KmerFinder method was developed by our group and predicts prokaryotic species based on the number of overlap-ping (cooccurring)k-mers, i.e., 16-mers, between the query genome and genomes in a reference database (20). Initially, all genomes in the com-mon training data were split into overlapping 16-mers with step size of one, meaning that if the first 16-mer is initiated at positionNand ends at positionN⫹15, the next 16-mer is initiated at positionN⫹1 and ends at positionN⫹16, and so on. To reduce the size of the final 16-mer data-base, only 16-mers with the prefix ATGAC were kept. These 16-mers were stored in a hash table with links to the original genomes. The length of the
k-mers was chosen to be 16 since a parallel study showed that this resulted in the highest performance of the method (results not shown). The prefix ATGAC was initially selected in an attempt to focus the 16-mers on coding regions (ATG is the start codon for protein coding sequences), while the A and C were chosen arbitrarily as the first two nucleotides when the four nucleotides are sorted alphabetically. Later studies have shown that the nucleotide sequence of the prefix has little influence on the performance of the method as long as strongly repetitive sequences, e.g., CCCCC or AAAAA, are omitted (data not shown). When the prediction is per-formed, the species of the query genome is predicted to be identical to the species of the genome in the training data with which it has the highest number of 16-mers in common, regardless of position. In the case of ties, the species were sorted alphabetically according to their name and the first species selected. The input for KmerFinder can be draft or complete ge-nomes as well as short reads. KmerFinder is freely available athttp://cge .cbs.dtu.dk/services/KmerFinder/.
(v) Reads2Type.Reads2Type was developed by our group and iden-tifies the prokaryotic species based on a database of 50-mer probes gener-ated from chosen marker genes (D. Saputra, S. Rasmussen, M. V. Larsen, N. Haddad, F. M. Aarestrup, O. Lund O, and T. Sicheritz-Pontén, unpub-lished data). The version of Reads2Type evaluated in this study requires short reads as input. For bacterial species not belonging to the Enterobac-teriaceaefamily, the 50-mer database relies on the 16S rRNA locus, while forEnterobacteriaceaethegyrBlocus is used. Briefly, the following steps were applied for building the 50-mer probe database.(a)The 16S rRNA sequences of the complete bacterial genomes of the common training set
were predicted using RNammer (26).(b)For species belonging to the
Enterobacteriaceae family, thegyrBsequences were downloaded from NCBI.(c)The above sequences were pooled, and all possible 50-bp frag-ments were generated from that pool.(d)16S rRNA probes unique for
Enterobacteriaceaewere removed from the pool of 50-mers.(e)All 50-mer duplicates associated to the conserved regions of different strains but the same species were removed.(f)To further reduce the size of the final 50-mers database, 25 consecutive 50-mers previously fragmented from oneⱖ50-bp stretch of 16S rRNA belonging to the same list of organisms were removed.
The resulting 50-mer probe database consists of a number of se-quences found uniquely in one species, as well as other sese-quences shared between several species. Subsequently, each read was compressed into a suffix tree, which is a data structure for fast string matching. The com-pressed short reads were aligned to the 50-mer probe database using a hierarchical “narrow-down” strategy: when a compressed read matched a probe belonging to a group of species, a much smaller probe database excluding other species was created on the fly, causing the read progress to be faster and the species to be identified more quickly.
The Reads2Type method is freely available as a web server (http: //cge.cbs.dtu.dk/services/Reads2Type/) and as a console. The web-based Reads2Type is unique in not requiring the short read file to be uploaded to the server. Instead, the 4.6-MB 50-mer probe database is automatically transferred into the client computer’s memory before spe-cies identification is initiated. All computations needed for the spespe-cies identification is fully performed on the client’s computer, minimizing the data transfer and avoiding the network bottleneck on the server.
Testing the speed.The speed of the methods was evaluated on non-published internal data from up to 450 strains covering eight species ( En-terococcus faecalis,Enterococcus faecium,Escherichia coli,Escherichia fergu-sonii,Klebsiella pneumoniae,Salmonella enterica,Staphylococcus aureus, andVibrio cholerae) that had been sequenced by the Illumina sequencing method. Draft genomes werede novoassembled as described above for the SRAdraftsset. The speed was tested on a cluster with⫻86_64 architecture,
128 nodes, 4 cores per node, and 30 GB or 7 GB RAM per node. Species-Finder used 4 cores per job, TaxonomySpecies-Finder used up to 10 cores per job, and the other methods used 1 core per job.
RESULTS
Five methods for species identification were trained on a common data set of completed prokaryotic genomes. The performances of the methods were subsequently evaluated on three data sets of draft genomes or short sequence reads.
Performances on NCBI draft genomes.The SpeciesFinder, rMLST, TaxonomyFinder, and KmerFinder methods are able to perform species predictions on draft or completed prokaryotic
genomes. Their performances were evaluated on the NCBIdraftsset
of 695 draft genomes covering 149 species. File S1 in the
supple-mental material lists all predictions, whileFig. 1Asummarizes the
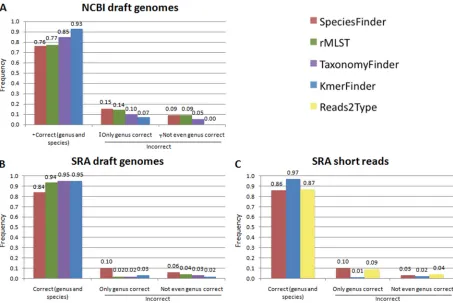
results. Overall, SpeciesFinder, which is based on the 16S rRNA gene, had the poorest performance, correctly identifying only 76% of the isolates down to species level. KmerFinder, which is based on cooccurring 16-mers, had the highest performance and correctly identified 93% of the isolates. For only three iso-lates (0.43%), KmerFinder did not get even the genus correct.
These three isolates were twoE. coliisolates predicted asShigella
sonneiand oneProvidencia alcalifaciensisolate predicted as Yer-sinia pestis.
The NCBIdraftsset contained three archaeal isolates: two M.
smithii isolates and one S. solfataricus isolate. SpeciesFinder, TaxonomyFinder, and KmerFinder predicted the species of all three isolates correctly, while rMLST, which was intended only for
characterization of bacteria (16), predicted theM. smithiiisolate
on May 16, 2020 by guest
http://jcm.asm.org/
correctly but was unable to make a prediction for theS. solfatari-cus.
The overlap in predictions of SpeciesFinder, rMLST, Tax-onomyFinder, and KmerFinder was examined and is illustrated in
Fig. 2A. All four methods correctly identified 428 out of 695 iso-lates (62%), and all methods misidentified the same six isoiso-lates. These six isolates were also misidentified by the BLAST-based
method. Table 1 lists these six isolates. Since all five methods
agreed on these predictions, the isolates are possibly wrongly an-notated. Alternatively, the annotations of the isolates in the train-ing data that the predictions were based on are incorrect.
As seen inFig. 2A, isolate predictions agreed upon by several
methods are more accurate that predictions unique to a particular method. However, the KmerFinder method made unique predic-tions for 36 isolates, of which 20 were in concordance with the annotation.
Predictions for the most common species in the NCBIdraftsdata
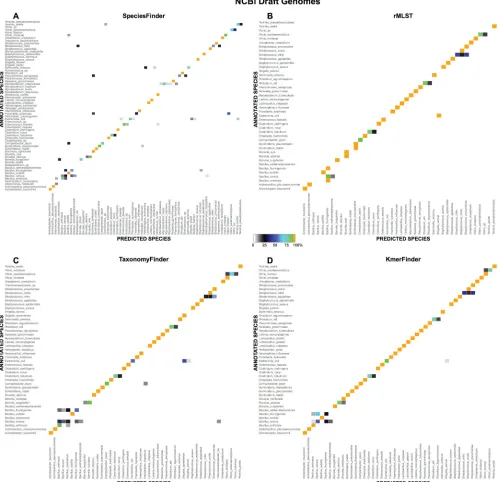
set were examined more closely and are illustrated inFig. 3and in
File S2 in the supplemental material. In general, the “wrong” pre-dictions by SpeciesFinder (that is, the ones that were in disagree-ment with the NCBI annotation) were typically scattered, often consisting of a few wrong predictions of each type. The rMLST method was, on the other hand, more consistent in its incorrect predictions. As an example, the rMLST method wrongly
anno-tated all 14Bacillus anthracisisolates asBacillus thuringiensis, all 8
Brucella abortusisolates as Brucella suis, and all 6Burkholderia malleiisolates asBurkholderia pseudomallei. In general, all four
methods had difficulties identifying species within theBacillus
ge-nus, such as isolates annotated asB. thuringiensisbut predicted to
beBacillus cereusor vice versa. Another mistake common to all
methods wasStreptococcus mitisbeing predicted asStreptococcus
oralisorStreptococcus pneumoniae. Also, none of the methods was
able to correctly identify all annotatedE. coliisolates but identified
at least some of them asShigella spp. Both SpeciesFinder and
TaxonomyFinder had problems identifying theBorrelia
burgdor-feriisolates, while SpeciesFinder and rMLST had problems
distin-guishingYersinia pestisfromYersinia pseudotuberculosis.
Species-Finder was the only method that had difficulties identifying
Mycobacterium tuberculosisisolates, often predicting them to be
Mycobacterium bovisisolates.
Performance rates on SRA draft genomes.The SpeciesFinder, rMLST, TaxonomyFinder, and KmerFinder methods were next
evaluated on the SRAdraftsset of 10,407 draft genomes covering
167 species. The performances on the draft genomes, for which
the methods were able to make a prediction, are depicted inFig.
1B, while the overlap in predictions is illustrated inFig. 2B. Again,
SpeciesFinder had the lowest performance, with only 84% correct predictions. The rMLST, TaxonomyFinder, and KmerFinder methods had almost equal performance rates of 94%, 95%, and 95%, respectively. There was, however, a difference in the percent-age of draft genomes for which each of the methods failed to make any prediction. SpeciesFinder and KmerFinder were the most ro-bust methods, failing to make predictions for only 0.2% and 0.4% of the draft genomes, respectively. TaxonomyFinder was not able
FIG 1Performance of the five methods for species identification on the indicated data sets. The rMLST and TaxonomyFinder methods take only draft or complete genomes as input, while Reads2Type works only for short reads. Correct (genus and species), predicted genus and species are in accordance with the annotation; only genus correct, the predicted genus is in accordance with the annotation, but the species is not; not even genus correct, neither predicted genus nor species is in accordance with the annotation.
on May 16, 2020 by guest
http://jcm.asm.org/
[image:4.585.65.518.65.368.2]to make a prediction for 1.8% of the draft genomes, and rMLST was not able to for 3.5%. That rMLST was the least robust method is at least partly due to our implementation of the method, where only hits with at least 95% identity and 95% coverage were con-sidered potential matches. On the other hand, the N50 values for the draft genomes that SpeciesFinder and KmerFinder could not make a prediction for were approximately half the size of the cor-responding values for rMLST and TaxonomyFinder (data not shown), meaning that the quality of the draft genomes has to be higher for rMLST and TaxonomyFinder to be able to make a
pre-diction. This is in accordance with these methods relying on the presence of many complete genes.
Predictions for the most common species in the SRAdraftsdata
set are shown inFig. 4and in File S2 in the supplemental material.
As seen previously when the NCBIdraftsset was used for
evalua-tions, the rMLST method was more consistent in its predictions for a given species than the other methods. For instance, rMLST
predicted all 15Mycobacterium bovisisolates to beM. tuberculosis.
As also seen when the NCBIdraftsset was used for evaluations, it is
evident that all methods had difficulties distinguishingE. colifrom
[image:5.585.126.464.67.405.2]FIG 2Overlap in predictions by the five methods for species identification. Numbers written in regular font indicate the number of isolates for which the predicted species corresponds to the annotated species. Numbers written in italics indicate the number of isolates for which the predicted and annotated species differ. The methods used and data sets evaluated are indicated.
TABLE 1Isolates of the NCBIdraftsset for which all five methods predict the species to be different from its present annotation
RefSeq accession no.a Strain namec Annotated species Predicted species
NZ_ACLX00000000 AH621 (uid55161) Bacillus cereus Bacillus weihenstephanensis
NZ_ACMD00000000 BDRD ST196 (uid55169) Bacillus cereus Bacillus weihenstephanensis
NZ_ABDQ00000000 C Eklund (uid54841) Clostridium botulinum Clostridium novyi
NZ_ABXZ00000000 FTG (uid55313) Francisella novicida Francisella tularensis
NZ_AHIE00000000 DC283 (uid86627) Pantoea stewartii Pantoea ananatis
NZ_AEPO00000000b ATCC 49296 (uid61461) Streptococcus sanguinis Streptococcus oralis aNCBI Reference Sequence (RefSeq) accession number from GenBank.
b
NZ_AEPO00000000 has been reannotated asStreptococcus oralissince we collected the data in 2011. cuid, unique identification number.
on May 16, 2020 by guest
http://jcm.asm.org/
[image:5.585.40.545.621.696.2]species within theShigellagenus. Furthermore, species within the
Brucellagenus were often wrongly identified. In particular, it was only TaxonomyFinder that was able to correctly identify most
Brucella abortusisolates. Some of the common problems that were
obvious when the NCBIdraftsset was used for evaluations were not
obvious when the SRAdraftsset was used for evaluations since the
problematic species were too scarcely represented here. For
in-stance, there were only five species from theBacillusgenus and
only oneS. mitisisolate in the SRAdraftsdata set. The difference in
species distribution between the NCBIdraftsand SRAdraftssets also
explain why SpeciesFinder, TaxonomyFinder, and rMLST all have
increased performance on the SRAdraftsset: while more than half
of the isolates in the SRAdraftsset belong to theSalmonella,
Staph-ylococcus, andStreptococcusgenera, which none of the methods have particular problems identifying, these genera constitute less
than 20% of the NCBIdraftsset. Conversely, the NCBIdraftsset
con-tains a high proportion of the problematic speciesE. coli(8.8%)
and the genusBacillus(10%). The corresponding proportions for
FIG 3Predictions for the most common species of the NCBIdraftsset. For each method, indicated at the top of each panel, the results for a given species are only
shown if the method made a prediction for five or more isolates annotated as this species (e.g., if there are five isolates annotated as species A in the data set, but the method was not able to make a prediction for one of the isolates, the species is not shown) or if two or more isolates are predicted as this species (e.g., if there are no isolates annotated as species B in the data set but two isolates annotated as species C are predicted to be species B, then species B is shown).
on May 16, 2020 by guest
http://jcm.asm.org/
[image:6.585.44.543.71.553.2]SRAdraftsare 3.5%E. coliisolates and 0.05% isolates of theBacillus
genus. Furthermore, the NCBIdraftsset is proportionally more
di-verse, consisting of 149 species, while the almost 15-times-larger SRAdraftsset consists of only 168 different species.
Performances on short reads from SRA.Only three of the methods were able to perform species predictions directly on short reads without first assembling the reads. These methods were SpeciesFinder, KmerFinder, and Reads2Type. Their
perfor-mances on the SRAreadsset of 10,407 sets of short reads
represent-ing 168 species are shown inFig. 1C.
Again, the SpeciesFinder method had the poorest perfor-mance, with 86% of the isolates being correctly predicted. Reads2Type performed marginally better (87%), while Kmer-Finder achieved 97% correct reads.
Figure 2Cillustrates the overlap in predictions between the three methods, while predictions for the most common species are shown in Fig. S2 in the supplemental material. In general, the
results correspond to those observed for the SRAdraftsset.
Speed.The speed of the methods was evaluated on a subset of draft genomes and short reads as described in Materials and
Meth-FIG 4Predictions for the most common species in the SRAdraftsdata set. For each method, indicated at the top of each panel, the results for a given species is
shown only if the method made a prediction for 10 or more isolates annotated as this species or if two or more isolates are predicted as this species.
on May 16, 2020 by guest
http://jcm.asm.org/
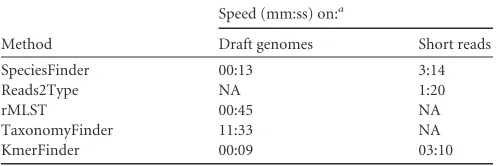
[image:7.585.44.543.68.561.2]ods (Table 2). Since the actual speed experienced by the user will depend on a number of factors, for instance, the network band-width capacity of the client computer and the number of jobs queued at the server, the relative speed of the different methods in comparison to each other is more relevant than the absolute speed.
DISCUSSION
In the present study, we trained five different methods for pro-karyotic species identification on a common data set and evalu-ated their performance on three data sets of draft genomes or short sequence reads.
The SpeciesFinder method is based on the 16S rRNA gene, which has served as the backbone of prokaryotic systematics since
1977 (1). Accordingly, sequencing of the 16S rRNA gene is a
well-established method for identification of prokaryotes and has, in all likelihood, been used for annotating some of the isolates in the training and evaluation sets. In the light of this potential advan-tage of the SpeciesFinder method over the other methods, it is noteworthy that it had the lowest performance on all evaluation sets. Previous studies, however, have also pointed to the many
limitations of the 16S rRNA gene for taxonomic purposes (5–9).
Examples, which are also observed in this study, include its
inad-equacy for the delineation of species within theBorrelia
burgdor-feri sensu latocomplex and theMycobacterium tuberculosis
com-plex (35). Similarly,in silicostudies of the applicability of the 16S
rRNA gene for the identification of medically important bacteria led to the authors concluding that although the method is useful for identification to the genus level, it is able to identify only 62%
of anaerobic bacteria (36) and less than 30% of aerobic bacteria
(37) confidently to the species level.
The performance of SpeciesFinder was surpassed only margin-ally by Reads2Type. This is not surprising since the two methods are conceptually very similar: SpeciesFinder utilizes the entire 16S rRNA gene of approximately 1,540 nucleotides, while for most species, Reads2Type searches for species-specific 50-mers in the same gene. In terms of its future usability, Reads2Type has, how-ever, one advantage over the other methods: like most of the other methods it is available as a web server, but uniquely it does not require the read data to be uploaded to the server. Instead, a small 50-mer database is transferred to the user’s computer, and all computations are performed there. As a result, bottleneck prob-lems on the server are avoided, and the data transfer is minimized, which may be particularly advantageous for users with limited Internet access.
While SpeciesFinder and Reads2Type sample only one locus, the rMLST method samples up to 53 loci—all ribosomal genes located to the chromosome of the bacteria. Evaluating on the data
set of SRA draft genomes, rMLST, TaxonomyFinder, and Kmer-Finder performed equally well. However, on the more diverse and difficult set of NCBI draft genomes, the rMLST method performed only marginally better than SpeciesFinder and signifi-cantly worse than TaxonomyFinder and KmerFinder. In particu-lar, the rMLST method consistently made incorrect
identifica-tions of a number of closely related species, e.g.,Y. pestisversusY.
pseudotuberculosis(38) andM. tuberculosisversusM. bovis(39).
Also, rMLST consistently predicted the human pathogenB.
an-thracisto beB. thuringiensis. The latter is used extensively as a biological pesticide and is generally not considered harmful for
humans.B. anthracisandB. thuringiensisare both members of the
B. cereusgroup and genetically very similar, with most of the dis-ease and host specificity being attributable to their plasmid
con-tent (40,41). It has even been suggested that all members of theB.
cereusgroup should be considered to beB. cereusand only
subse-quently be differentiated by their plasmids (42). Hence, in
concor-dance with rMLST sampling only chromosomal, core genes, it is not surprising that the method fails to distinguish these isolates. A
similar example is given by the rMLST method identifying allE.
coliisolates asShigella sonnei. AlthoughShigellasp. isolates have
been rewarded their own genus, the separation of the genus from
Escherichiaspp. is mainly historical (43–45). To be sure, some of the mistakes commonly made by rMLST as well as the other meth-ods highlight taxonomic taxa that are intrinsically difficult to
dis-tinguish due to a suboptimal initial classification. Although
Shi-gellahas for several years been considered a substrain ofE. coli, the practical implications of renaming it are considered insurmount-able. It should also be noted that the rMLST method was not developed for usage with a fixed training set but, rather, with all known alleles. Accordingly, the performance of the method is ex-pected to improve with increased size of the reference rMLST database, which is currently expanding rapidly (Keith Jolley, De-partment of Zoology, University of Oxford, United Kingdom, personal communication).
The TaxonomyFinder method was the second most accurate method on the set of NCBI draft genomes and performed in the top for the SRA drafts set. In contrast to the other methods, it does not work directly on the nucleotide sequence of the isolates but, rather, on the proteome, utilizing functional protein domain pro-files for the species prediction. It was the slowest of the tested methods, but in return for the extra time, the user is rewarded with an annotated genome.
The KmerFinder method performs its predictions on the basis
of cooccurringk-mers, regardless of their location in the
chromo-some. It had the overall highest accuracy, worked on complete or draft genomes as well as short reads, and was found to be very robust as well as fast. Furthermore, the KmerFinder method holds promise for future improvements as the implementation used for this study was very simple. Only the raw number of cooccurring
k-mers between the query and reference genome was considered
although a parallel analysis indicated that the performance could be improved even further if more sophisticated measures were
used, also taking into account the total number ofk-mers in the
[image:8.585.40.289.78.161.2]query and reference genome. KmerFinder took approximately 9 s per query genome, which makes it the fastest of the tested meth-ods. To test the general applicability of sampling the entire ge-nome and not preselected genes or sets of genes for the species prediction, we also implemented a whole-genome BLAST-based method. The method used hit aggregation of significant matches
TABLE 2Speed of the tested methods
Method
Speed (mm:ss) on:a
Draft genomes Short reads
SpeciesFinder 00:13 3:14
Reads2Type NA 1:20
rMLST 00:45 NA
TaxonomyFinder 11:33 NA
KmerFinder 00:09 03:10
aNA, not applicable.
on May 16, 2020 by guest
http://jcm.asm.org/
between the query genome and all genomes in the common train-ing set. As the final prediction, the species for which the query genome had the most bases matched was selected. The perfor-mance of this whole-genome BLAST-based method was tested on
the NCBIdraftsand SRAdraftsevaluation sets and found to be very
similar to that of KmerFinder (see File S2 in the supplemental material). The method was, however, almost 20 times slower than KmerFinder, taking approximately 3 min per genome.
It has previously been noted that some of the isolates present in public databases and, hence, used in this study, are wrongly
anno-tated (17,46,47). Based on the current study, it is likely that at
least the six isolates from the NCBIdraftsset that all methods
iden-tified as something other than the annotated species are wrongly annotated or, alternatively, most closely related to an isolate in the common training data that is wrongly annotated. In agreement with this, one of the isolates has indeed been reannotated since we initially downloaded the data. Of the remaining five isolates, two
B. cereus isolates were found to be most closely related to the
Bacillus weihenstephanensisstrain KBAB4 of the common training set. This strain is the single representative of the species in the public database and not the type strain. Hence, there is no
guar-antee that the sequenced strain represents the named taxon (48).
The same is the case for theClostridium botulinumstrain C
Ek-lund, which is predicted to be aClostridium novyibased on its
close resemblance toC. novyistrain NT of the training set.
Clos-tridium novyistrain NT is the only representative of this species in the database and not the type strain. Obviously, all the evaluated methods are highly dependent on the size and the accuracy of the set of genomes that they are trained on. Accordingly, all methods have the potential to improve their performance in the future when more genomes become available and when the present mis-takes in the public databases are corrected. Another way to ensure future improvement is to combine the individual predictions of the methods and let the final predicted species of a query genome be decided by a majority vote. We are currently planning to im-plement such a system.
In the current study, we included only species in the evaluation sets which were also present in the training set. We have hence not tested how the methods would perform when presented with a species not included in the training set. SpeciesFinder searches for the closest match in the query genome to a database of 16S rRNA genes. If the species of the query genome is not represented in the database, the closest match is likely to be of a closely related spe-cies, but the method will also test if the percent identity and cov-erage of the 16S rRNA gene are above 98% and mark the predic-tion as “failed” if the match is below this threshold. The rMLST method searches for closest matches in a database of 53 different ribosomal genes. In our implementation, the method will not provide an output if the percent identity and coverage of the matches are below a threshold of 95%, and hence it will be able to select only a closely related species for species that are not repre-sented in the training set. Other implementations of the rMLST method, however, would not necessarily have this limitation. The TaxonomyFinder method uses species- or phylum-specific protein profiles and would hence identify the correct phylum if the species of the query genome was not in the training set. Along with the predicted species, the KmerFinder outputs the
number of cooccurringk-mers that the selection was based on.
A high number ofk-mers indicates that the identification is
probable, while low numbers ofk-mers indicate that the
pre-dicted species is likely to be a related species and that the actual species is not in the training data. Further investigations would
be necessary to identify a threshold for the number ofk-mers to
make this distinction.
While some taxonomists consider the goal of bacterial tax-onomy to “mirror the order of nature and describe the
evolu-tionary order back to the origin of life” (6,49), a more
prag-matic and applied view is likely to be advantageous for epidemiological purposes, where most outbreaks last less than 6 months. The number of prokaryotic genomes in public data-bases is currently sufficiently high to replace theoretical views of which loci to sample for optimal species identification by actual testing of how different approaches perform. One locus (the 16S rRNA gene) was initially used for sequenced-based examination of relationships between bacteria, and when the approach was found to have limitations, more loci were added
in MLST and multilocus sequence analysis (MLSA) (50, 51).
The addition of still more loci has been suggested for
improv-ing MLSA even further (16, 35). This study suggests that an
optimal approach should not be limited to a finite number of genes but, rather, look at the entire genome.
Conclusion.The 16S rRNA gene has served prokaryotic tax-onomy well for more than 30 years, but the emergence of second-and third-generation sequencing technologies enables the use of WGS data with the potential of higher resolution and more phy-logenetically accurate classifications. Methods that sample the en-tire genome, not just core genes located to the chromosome, seem particularly well suited for taking up the baton.
ACKNOWLEDGMENTS
This work was supported by the Center for Genomic Epidemiology at the Technical University of Denmark and funded by grant 09-067103/DSF from the Danish Council for Strategic Research.
We are grateful to John Damm Sørensen for excellent technical assis-tance. We are grateful to Keith Jolley, Department of Zoology, University of Oxford, United Kingdom, for providing us with the rMLST genes for the genomes of the training data.
REFERENCES
1.Fox GE, Peckman KJ, Woese CE.1977. Comparative cataloging of 16S ribosomal ribonucleic acid: molecular approach to procaryotic systemat-ics. Int. J. Syst. Evol. Bacteriol. 27:44 –57. http://dx.doi.org/10.1099 /00207713-27-1-44.
2.DeSantis TZ, Hugenholtz P, Larsen N, Rojas M, Brodie EL, Keller K, Huber T, Dalevi D, Hu P, Andersen GL.2006. Greengenes, a chimera-checked 16S rRNA gene database and workbench compatible with ARB. Appl. Environ. Microbiol.72:5069 –5072.http://dx.doi.org/10.1128/AEM .03006-05.
3.Pruesse E, Quast C, Knittel K, Fuchs BM, Ludwig W, Peplies J, Glock-ner FO. 2007. SILVA: a comprehensive online resource for quality checked and aligned ribosomal RNA sequence data compatible with ARB. Nucleic Acids Res.35:7188 –7196.http://dx.doi.org/10.1093/nar/gkm864. 4.Ludwig W, Strunk O, Westram R, Richter L, Meier H, Yadhukumar Buchner A, Lai T, Steppi S, Jobb G, Forster W, Brettske I, Gerber S, Ginhart AW, Gross O, Grumann S, Hermann S, Jost R, Konig A, Liss T, Lussmann R, May M, Nonhoff B, Reichel B, Strehlow R, Stamatakis A, Stuckmann N, Vilbig A, Lenke M, Ludwig T, Bode A, Schleifer KH.
2004. ARB: a software environment for sequence data. Nucleic Acids Res.
32:1363–1371.http://dx.doi.org/10.1093/nar/gkh293.
5.Tindall BJ, Rossello-Mora R, Busse HJ, Ludwig W, Kampfer P.2010. Notes on the characterization of prokaryote strains for taxonomic pur-poses. Int. J. Syst. Evol. Microbiol.60:249 –266.http://dx.doi.org/10.1099 /ijs.0.016949-0.
6.Kampfer P.2012. Systematics of prokaryotes: the state of the art. Antonie Van Leeuwenhoek101:3–11.http://dx.doi.org/10.1007/s10482-011-9660-4.
on May 16, 2020 by guest
http://jcm.asm.org/
7.Tindall BJ, Schneider S, Lapidus A, Copeland A, Glavina Del Rio T, Nolan M, Lucas S, Chen F, Tice H, Cheng JF, Saunders E, Bruce D, Goodwin L, Pitluck S, Mikhailova N, Pati A, Ivanova N, Mavrommatis K, Chen A, Palaniappan K, Chain P, Land M, Hauser L, Chang YJ, Jeffries CD, Brettin T, Han C, Rohde M, Goker M, Bristow J, Eisen JA, Markowitz V, Hugenholtz P, Klenk HP, Kyrpides NC, Detter JC.2009. Complete genome sequence ofHalomicrobium mukohataeitype strain (arg-2). Stand. Genomic Sci.1:270 –277.http://dx.doi.org/10.4056/sigs .42644.
8.Walcher M, Skvoretz R, Montgomery-Fullerton M, Jonas V, Brentano S.
2013. Description of an unusualNeisseria meningitidisisolate containing and expressingNeisseria gonorrhoeae-specific 16S rRNA gene sequences. J. Clin. Microbiol.51:3199 –3206.http://dx.doi.org/10.1128/JCM.00309-13 .
9.Klenk HP, Goker M.2010. En route to a genome-based classification of
ArchaeaandBacteria? Syst. Appl. Microbiol.33:175–182.http://dx.doi .org/10.1016/j.syapm.2010.03.003.
10. Koser CU, Ellington MJ, Cartwright EJ, Gillespie SH, Brown NM, Farrington M, Holden MT, Dougan G, Bentley SD, Parkhill J, Peacock SJ.2012. Routine use of microbial whole genome sequencing in diagnostic and public health microbiology. PLoS Pathog.8:e1002824.http://dx.doi .org/10.1371/journal.ppat.1002824.
11. Snel B, Bork P, Huynen MA.1999. Genome phylogeny based on gene content. Nat. Genet.21:108 –110.http://dx.doi.org/10.1038/5052. 12. House CH, Fitz-Gibbon ST.2002. Using homolog groups to create a
whole-genomic tree of free-living organisms: an update. J. Mol. Evol.54:
539 –547.http://dx.doi.org/10.1007/s00239-001-0054-5.
13. Yang S, Doolittle RF, Bourne PE.2005. Phylogeny determined by pro-tein domain content. Proc. Natl. Acad. Sci. U. S. A.102:373–378.http://dx .doi.org/10.1073/pnas.0408810102.
14. Lukjancenko O, Thomsen MC, Larsen MV, Ussery DW2013. PanFunPro: PAN-genome analysis based on FUNctional PROfiles. F1000Research2:265. http://dx.doi.org/10.12688/f1000research.2-265.v1.
15. Ciccarelli FD, Doerks T, von Mering C, Creevey CJ, Snel B, Bork P.
2006. Toward automatic reconstruction of a highly resolved tree of life. Science311:1283–1287.http://dx.doi.org/10.1126/science.1123061. 16. Jolley KA, Bliss CM, Bennett JS, Bratcher HB, Brehony C, Colles FM,
Wimalarathna H, Harrison OB, Sheppard SK, Cody AJ, Maiden MC.
2012. Ribosomal multilocus sequence typing: universal characterization of bacteria from domain to strain. Microbiology158:1005–1015.http://dx .doi.org/10.1099/mic.0.055459-0.
17. Bennett JS, Jolley KA, Earle SG, Corton C, Bentley SD, Parkhill J, Maiden MC.2012. A genomic approach to bacterial taxonomy: an exam-ination and proposed reclassification of species within the genusNeisseria. Microbiology158:1570 –1580.http://dx.doi.org/10.1099/mic.0.056077-0. 18. Cody AJ, McCarthy ND, Jansen van Rensburg M, Isinkaye T, Bentley SD, Parkhill J, Dingle KE, Bowler IC, Jolley KA, Maiden MC.2013. Real-time genomic epidemiological evaluation of human campylobacter isolates by use of whole-genome multilocus sequence typing. J. Clin. Mi-crobiol.51:2526 –2534.http://dx.doi.org/10.1128/JCM.00066-13. 19. Altschul SF, Madden TL, Schaffer AA, Zhang J, Zhang Z, Miller W,
Lipman DJ.1997. Gapped BLAST and PSI-BLAST: a new generation of protein database search programs. Nucleic Acids Res.25:3389 –3402.http: //dx.doi.org/10.1093/nar/25.17.3389.
20. Hasman H, Saputra D, Sicheritz-Ponten T, Lund O, Svendsen CA, Frimodt-Moller N, Aarestrup FM.2014. Rapid whole-genome sequenc-ing for detection and characterization of microorganisms directly from clinical samples. J. Clin. Microbiol.52:139 –146.http://dx.doi.org/10.1128 /JCM.02452-13.
21. Euzeby JP.1997. List of Bacterial Names with Standing in Nomenclature: a folder available on the Internet. Int. J. Syst. Bacteriol.47:590 –592.http: //dx.doi.org/10.1099/00207713-47-2-590.
22. Kodama Y, Shumway M, Leinonen R.2012. The Sequence Read Archive: explosive growth of sequencing data. Nucleic Acids Res.40:D54 –56.http: //dx.doi.org/10.1093/nar/gkr854.
23. Larsen MV, Cosentino S, Rasmussen S, Friis C, Hasman H, Marvig RL, Jelsbak L, Sicheritz-Ponten T, Ussery DW, Aarestrup FM, Lund O.
2012. Multilocus sequence typing of total-genome-sequenced bacteria. J. Clin. Microbiol.50:1355–1361.http://dx.doi.org/10.1128/JCM.06094-11. 24. Zerbino DR, Birney E.2008. Velvet: algorithms for de novo short read assembly using de Bruijn graphs. Genome Res.18:821– 829.http://dx.doi .org/10.1101/gr.074492.107.
25. Miller JR, Koren S, Sutton G. 2010. Assembly algorithms for
next-generation sequencing data. Genomics95:315–327.http://dx.doi.org/10 .1016/j.ygeno.2010.03.001.
26. Lagesen K, Hallin P, Rodland EA, Staerfeldt HH, Rognes T, Ussery DW.2007. RNAmmer: consistent and rapid annotation of ribosomal RNA genes. Nucleic Acids Res.35:3100 –3108.http://dx.doi.org/10.1093 /nar/gkm160.
27. Li H, Durbin R.2010. Fast and accurate long-read alignment with Bur-rows-Wheeler transform. Bioinformatics26:589 –595.http://dx.doi.org /10.1093/bioinformatics/btp698.
28. Grabherr MG, Haas BJ, Yassour M, Levin JZ, Thompson DA, Amit I, Adiconis X, Fan L, Raychowdhury R, Zeng Q, Chen Z, Mauceli E, Hacohen N, Gnirke A, Rhind N, di Palma F, Birren BW, Nusbaum C, Lindblad-Toh K, Friedman N, Regev A.2011. Full-length transcriptome assembly from RNA-Seq data without a reference genome. Nat. Biotech-nol.29:644 – 652.http://dx.doi.org/10.1038/nbt.1883.
29. Kent WJ.2002. BLAT—the BLAST-like alignment tool. Genome Res.
12:656 – 664.http://dx.doi.org/10.1101/gr.229202.
30. Punta M, Coggill PC, Eberhardt RY, Mistry J, Tate J, Boursnell C, Pang N, Forslund K, Ceric G, Clements J, Heger A, Holm L, Sonnhammer EL, Eddy SR, Bateman A, Finn RD.2012. The Pfam protein families database. Nucleic Acids Res.40:D290 –301.http://dx.doi.org/10.1093/nar /gkr1065.
31. Haft DH, Selengut JD, White O. 2003. The TIGRFAMs database of protein families. Nucleic Acids Res. 31:371–373. http://dx.doi.org/10 .1093/nar/gkg128.
32. Gough J, Karplus K, Hughey R, Chothia C.2001. Assignment of ho-mology to genome sequences using a library of hidden Markov models that represent all proteins of known structure. J. Mol. Biol.313:903–919. http://dx.doi.org/10.1006/jmbi.2001.5080.
33. Li W, Godzik A.2006. Cd-hit: a fast program for clustering and compar-ing large sets of protein or nucleotide sequences. Bioinformatics22:1658 – 1659.http://dx.doi.org/10.1093/bioinformatics/btl158.
34. Hyatt D, Chen GL, Locascio PF, Land ML, Larimer FW, Hauser LJ.
2010. Prodigal: prokaryotic gene recognition and translation initiation site identification. BMC Bioinformatics 11:119. http://dx.doi.org/10.1186 /1471-2105-11-119.
35. Almeida LA, Araujo R.2013. Highlights on molecular identification of closely related species. Infect. Genet. Evol.13:67–75.http://dx.doi.org/10 .1016/j.meegid.2012.08.011.
36. Woo PC, Chung LM, Teng JL, Tse H, Pang SS, Lau VY, Wong VW, Kam KL, Lau SK, Yuen KY.2007. In silico analysis of 16S ribosomal RNA gene sequencing-based methods for identification of medically important anaerobic bacteria. J. Clin. Pathol.60:576 –579.http://dx.doi.org/10.1136 /jcp.2006.038653.
37. Teng JL, Yeung MY, Yue G, Au-Yeung RK, Yeung EY, Fung AM, Tse H, Yuen KY, Lau SK, Woo PC.2011. In silico analysis of 16S rRNA gene sequencing based methods for identification of medically important aer-obic Gram-negative bacteria. J. Med. Microbiol.60:1281–1286.http://dx .doi.org/10.1099/jmm.0.027805-0.
38. Achtman M, Zurth K, Morelli G, Torrea G, Guiyoule A, Carniel E.
1999. Yersinia pestis, the cause of plague, is a recently emerged clone of Yersinia pseudotuberculosis. Proc. Natl. Acad. Sci. U. S. A.96:14043– 14048.http://dx.doi.org/10.1073/pnas.96.24.14043.
39. Sreevatsan S, Pan X, Stockbauer KE, Connell ND, Kreiswirth BN, Whittam TS, Musser JM.1997. Restricted structural gene polymorphism in theMycobacterium tuberculosiscomplex indicates evolutionarily recent global dissemination. Proc. Natl. Acad. Sci. U. S. A.94:9869 –9874.http: //dx.doi.org/10.1073/pnas.94.18.9869.
40. Rasko DA, Altherr MR, Han CS, Ravel J.2005. Genomics of theBacillus cereusgroup of organisms. FEMS Microbiol. Rev.29:303–329.http://dx .doi.org/10.1016/j.fmrre.2004.12.005.
41. Jimenez G, Urdiain M, Cifuentes A, Lopez-Lopez A, Blanch AR, Tamames J, Kampfer P, Kolsto AB, Ramon D, Martinez JF, Codoner FM, Rossello-Mora R.2013. Description ofBacillus toyonensissp. nov., a novel species of theBacillus cereusgroup, and pairwise genome compari-sons of the species of the group by means of ANI calculations. Syst. Appl. Microbiol.36:383–391.http://dx.doi.org/10.1016/j.syapm.2013.04.008. 42. Helgason E, Okstad OA, Caugant DA, Johansen HA, Fouet A, Mock M,
Hegna I, Kolsto AB.2000.Bacillus anthracis,Bacillus cereus, andBacillus thuringiensis— one species on the basis of genetic evidence. Appl. Environ. Microbiol. 66:2627–2630. http://dx.doi.org/10.1128/AEM.66.6.2627 -2630.2000.
43. Lan R, Reeves PR.2002.Escherichia coliin disguise: molecular origins of
on May 16, 2020 by guest
http://jcm.asm.org/
Shigella. Microbes Infect.4:1125–1132.http://dx.doi.org/10.1016/S1286 -4579(02)01637-4.
44. Lukjancenko O, Wassenaar TM, Ussery DW.2010. Comparison of 61 sequencedEscherichia coligenomes. Microb. Ecol.60:708 –720.http://dx .doi.org/10.1007/s00248-010-9717-3.
45. Karaolis DK, Lan R, Reeves PR.1994. Sequence variation inShigella sonnei(Sonnei), a pathogenic clone ofEscherichia coli, over four conti-nents and 41 years. J. Clin. Microbiol.32:796 – 802.
46. Goris J, Konstantinidis KT, Klappenbach JA, Coenye T, Vandamme P, Tiedje JM.2007. DNA-DNA hybridization values and their relationship to whole-genome sequence similarities. Int. J. Syst. Evol. Microbiol.57:
81–91.http://dx.doi.org/10.1099/ijs.0.64483-0.
47. Yarza P, Richter M, Peplies J, Euzeby J, Amann R, Schleifer KH, Ludwig W, Glockner FO, Rossello-Mora R.2008. The All-Species Living Tree proj-ect: a 16S rRNA-based phylogenetic tree of all sequenced type strains. Syst. Appl. Microbiol.31:241–250.http://dx.doi.org/10.1016/j.syapm.2008.07.001.
48. Richter M, Rossello-Mora R.2009. Shifting the genomic gold standard for the prokaryotic species definition. Proc. Natl. Acad. Sci. U. S. A.106:
19126 –19131.http://dx.doi.org/10.1073/pnas.0906412106.
49. Kampfer P, Glaeser SP.2012. Prokaryotic taxonomy in the sequencing era—the polyphasic approach revisited. Environ. Microbiol.14:291–317. http://dx.doi.org/10.1111/j.1462-2920.2011.02615.x.
50. Gevers D, Cohan FM, Lawrence JG, Spratt BG, Coenye T, Feil EJ, Stackebrandt E, Van de Peer Y, Vandamme P, Thompson FL, Swings J.
2005. Opinion: re-evaluating prokaryotic species. Nat. Rev. Microbiol.
3:733–739.http://dx.doi.org/10.1038/nrmicro1236.
51. Maiden MC, Bygraves JA, Feil E, Morelli G, Russell JE, Urwin R, Zhang Q, Zhou J, Zurth K, Caugant DA, Feavers IM, Achtman M, Spratt BG.1998. Multilocus sequence typing: a portable approach to the identification of clones within populations of pathogenic microor-ganisms. Proc. Natl. Acad. Sci. U. S. A.95:3140 –3145.http://dx.doi .org/10.1073/pnas.95.6.3140.