Open Access
Vol 9 No 5Research article
Microarray gene expression profiling of osteoarthritic bone
suggests altered bone remodelling, WNT and transforming growth
factor-
β
/bone morphogenic protein signalling
Blair Hopwood
1,2, Anna Tsykin
3, David M Findlay
2,4and Nicola L Fazzalari
1,2,51Division of Tissue Pathology, Institute of Medical & Veterinary Science, Frome Road, Adelaide, South Australia, 5000, Australia 2Hanson Institute, Frome Road, Adelaide, South Australia, 5000, Australia
3School of Mathematics, University of Adelaide, North Terrace, Adelaide, South Australia, 5005, Australia
4Discipline of Orthopaedics & Trauma, University of Adelaide, North Terrace, Adelaide, South Australia, 5005, Australia 5Discipline of Pathology, University of Adelaide, North Terrace, Adelaide, South Australia, 5005, Australia
Corresponding author: Nicola L Fazzalari, [email protected]
Received: 11 Jul 2007 Revisions requested: 10 Aug 2007 Revisions received: 10 Sep 2007 Accepted: 27 Sep 2007 Published: 27 Sep 2007
Arthritis Research & Therapy 2007, 9:R100 (doi:10.1186/ar2301) This article is online at: http://arthritis-research.com/content/9/5/R100 © 2007 Hopwood et al.; licensee BioMed Central Ltd.
This is an open access article distributed under the terms of the Creative Commons Attribution License (http://creativecommons.org/licenses/by/2.0), which permits unrestricted use, distribution, and reproduction in any medium, provided the original work is properly cited.
Abstract
Osteoarthritis (OA) is characterized by alterations to subchondral bone as well as articular cartilage. Changes to bone in OA have also been identified at sites distal to the affected joint, which include increased bone volume fraction and reduced bone mineralization. Altered bone remodelling has been proposed to underlie these bone changes in OA. To investigate the molecular basis for these changes, we performed microarray gene expression profiling of bone obtained at autopsy from individuals with no evidence of joint disease (control) and from individuals undergoing joint replacement surgery for either degenerative hip OA, or fractured neck of femur (osteoporosis [OP]). The OP sample set was included because an inverse association, with respect to bone density, has been observed between OA and the low bone density disease OP. Compugen human 19K-oligo microarray slides were used to compare the gene expression profiles of OA, control and OP bone samples. Four sets of samples were analyzed, comprising 10 OA-control female, 10 OA-control male, 10 OA-OP female and 9 OP-control female sample pairs. Print tip Lowess normalization and Bayesian statistical analyses were carried out using linear models for microarray analysis,
which identified 150 differentially expressed genes in OA bone with t scores above 4. Twenty-five of these genes were then confirmed to be differentially expressed (P < 0.01) by real-time PCR analysis. A substantial number of the top-ranking differentially expressed genes identified in OA bone are known to play roles in osteoblasts, osteocytes and osteoclasts. Many of these genes are targets of either the WNT (wingless MMTV integration) signalling pathway (TWIST1, IBSP, S100A4, MMP25, RUNX2 and CD14) or the transforming growth factor (TGF)-β/bone morphogenic protein (BMP) signalling pathway (ADAMTS4, ADM, MEPE, GADD45B, COL4A1 and FST). Other differentially expressed genes included WNT (WNT5B, NHERF1, CTNNB1 and PTEN) and TGF-β/BMP (TGFB1, SMAD3, BMP5 and INHBA) signalling pathway component or modulating genes. In addition a subset of genes involved in osteoclast function (GSN, PTK9, VCAM1, ITGB2, ANXA2, GRN, PDE4A and FOXP1) was identified as being differentially expressed in OA bone between females and males. Altered expression of these sets of genes suggests altered bone remodelling and may in part explain the sex disparity observed in OA.
Introduction
Osteoarthritis (OA) is a complex, multifactorial, age-depend-ent degenerative disease of the synovial joints. It affects the knee and the hip most commonly, and females at a higher rate
than males, particularly after the menopause [1]. OA is charac-terized by changes to all components of the joint, with degen-eration and loss of articular cartilage and changes to the subchondral bone being constant factors in disease
sion [2]. Along with the breakdown of the cartilage and joint space narrowing, there is thickening and sclerosis of subchon-dral bone, development of cysts and bony overgrowth at the margins of the joint. Despite an increase in bone volume fraction, the subchondral bone is mechanically weaker in OA because of hypomineralization, increased collagen metabo-lism and altered bone remodelling [3,4]. Evidence from animal models of OA suggests that the changes in the density and metabolism of subchondral bone develop concomitantly with the signs of cartilage damage [5-7]. In addition, there is now evidence in animal OA models that antiresorptive agents, which inhibit subchondral bone remodelling, also prevent the bone changes and loss of cartilage seen in OA, thus reducing joint damage [8,9]. A human trial of an antiresorptive agent also showed clear trends toward improvement in both joint structure and symptoms in patients with primary knee OA [10]. These findings are consistent with the hypothesis that OA is a bone disease, rather than – or in addition to – a cartilage dis-ease, and that the structural and compositional changes seen in OA subchondral bone, brought about by altered bone remodelling, contribute to the breakdown of the articular carti-lage at the joint [11-14].
There is also evidence that the osteoblasts in subchondral bone can influence chondrocyte and cartilage metabolism more directly, leading to abnormal remodelling of OA cartilage [15,16]. In articular joints there is a complex juxtaposition of vascular elements, subchondral bone and the different carti-lage layers, with important communication between these tis-sues [17]. These observations point to a clear interplay between bone and cartilage at articular joints and show that these tissues represent a functional cellular and molecular unit [18]. Altered angiogenesis could also be contributing to the changes seen in OA bone and cartilage, because important inter-relationships between bone remodelling, chondrogenic and angiogenic processes are now emerging [19-21].
In addition to the changes observed in subchondral bone, there is growing evidence for generalized involvement of bone in the pathogenesis of OA. Studies investigating bone at sites distal to the joint cartilage degeneration, such as the intertro-chanteric (IT) and medial principal compressive regions of the proximal femur, and the iliac crest, have yielded evidence of altered bone composition and increased bone volume in OA compared with control individuals [22-25]. It has been pro-posed that these structural and compositional changes reflect systemic differences in OA bone remodelling compared with control bone, and when these changes operate in subchon-dral bone they can contribute to the breakdown of the articular cartilage and eventual failure of the joint [11-14]. Furthermore, an inverse association between OA and the low bone density disease osteoporosis (OP) has been observed. OA patients rarely proceed to osteoporotic fracture, suggesting that OA has a protective effect on progression of OP. Conversely, OA is reported to be rare in OP individuals [26].
The structural and compositional changes seen in OA bone are likely to have considerable genetic input because there is a significant heritable component to OA, as judged by genetic studies [27]. Interestingly, many of the candidate susceptibility genes for OA identified by genetic screening approaches have bone-related functions, further suggesting the involvement of bone in OA. Primary OA candidate genes identified, with bone-related functions, include COL1A1, VDR, ESR1, IGF1, SFRP3, BMP5 and TGFB1 [27-30]. SFRP3 encodes a decoy receptor for WNT (wingless MMTV integration) ligands and plays a role in osteoblast differentiation [31]. The WNT signal-ling pathway is a major developmental pathway that is involved in cell fate, differentiation and proliferation. This signalling pathway has also been linked to skeletal development and bone pathologies such as OP [32]. The identification of TGFB1 and BMP5, a member of the transforming growth fac-tor (TGF)-β superfamily, as OA susceptibility loci has impli-cated the TGF-β/BMP signalling pathway in OA pathogenesis. The TGF-β/BMP signalling pathway plays important roles in development, cell proliferation and differentiation, and it has also been shown to influence bone mass and bone remodel-ling [33,34].
Complementing the human genetic studies described above, and in support of altered bone remodelling at sites distal to the active subchondral disease site, we previously identified differ-ences in the expression of known skeletally active genes in human trabecular bone obtained from the IT region from indi-viduals with hip OA, as compared with bone from the same site in control individuals. Genes identified as differentially expressed include downregulated osteoclastogenic factor genes (RANKL, RANK, IL6 and IL11) and upregulated bone formation marker genes (ALPL, BGLAP, SPP1 and COL1A2) [35-37]. Others have identified in OA individuals altered levels of insulin-like growth factor-1, insulin-like growth factor-2 and TGF-β1 in cortical bone from the iliac crest [38]; matrix metal-loproteinase (MMP)2 and liver alkaline phosphatase in subchondral bone [4]; and IL-1β, IL-6 and TGF-β1 in human primary subchondral osteoblasts [39].
In the present study, we used microarray analysis to survey comprehensively the expression levels of many thousands of genes simultaneously in trabecular bone from the IT region of the proximal femur and to compare gene expression in bone from OA, control and OP individuals. We identified altered expression of WNT and TGF-β/BMP signalling pathway and target genes in OA bone. The genes include those with known or suspected roles in osteoblast, osteocyte and osteoclast dif-ferentiation and function, supporting a role for altered bone remodelling in OA pathogenesis.
Materials and methods
Human bone samples
region of the proximal femur. These were obtained from 24 patients (14 females [age range 49 to 83 years] and 10 males [50 to 85 years]) undergoing hip arthroplasty for primary OA and from 10 patients (10 females [74 to 87 years]) undergoing hip arthroplasty for a fractured neck of femur (designated OP). For the control group, trabecular bone from the IT region was obtained during 21 autopsies (11 females [43 to 85 years] and 10 males [50 to 85 years]) of individuals who were known not to have suffered from any chronic condition or disease that may have affected the skeleton. In selecting the OA, OP and control individuals, those with a known history of medication that might have affected bone metabolism were excluded. Informed consent was obtained for the collection of these specimens, with approval from the Royal Adelaide Hospital Research Ethics Committee (protocol number 030309).
The surgical and autopsy femoral heads were graded for OA according to the criteria of Collins [40]. Primary OA femoral heads were either grade III or IV, and the graded autopsy fem-oral heads were not worse than grade II and predominantly were grade I. Surgical IT trabecular bone specimens from OA and OP individuals were collected within 12 to 24 hours (stored at 4°C in sterile RNase-free phosphate-buffered saline). Control bone was collected within 24 to 72 hours after death.
Trabecular bone in the IT region of the proximal femur, includ-ing the marrow, was sampled, permittinclud-ing analysis of the total contribution of the bone microenvironment. The IT region was also chosen because the trabecular structure in this region depends on stresses in the proximal femoral shaft, while being unaffected by the secondary sclerotic and cystic changes that are often seen in the OA femoral head as the destruction of the cartilage proceeds. By comparing the OA and OP samples with control samples, the contribution to changes in gene expression associated with surgery as opposed to autopsy could be assessed.
RNA extraction
For total RNA extraction, the trabecular bone samples were rinsed briefly in diethylpyrocarbonate-treated water and then separated into small fragments, containing bone and bone marrow, using bone cutters. Total RNA was extracted as described previously [35,41]. Briefly, bone fragments were placed in 4 mol/l guanidinium thiocyanate solution and homog-enized using an Ultra-Turrax (TP 18–10; Janke & Kunkel, IKA-WERK, Staufen, Germany), and the mixture was clarified by centrifugation (1,000 × g for 5 min). After addition of 0.1 vol of 2 mol/l sodium acetate (pH 4.0), the mixture was vortexed and the RNA extracted with 1 vol of phenol and 0.2 vol of chlo-roform/isoamylalcohol (49:1). Total RNA was precipitated with isopropanol, resuspended in 1 × 10 mmol/l Tris-HCl/1 mmol/ l EDTA containing 0.1 vol of 3 mol/l sodium acetate (pH 5.2) and then re-extracted with 0.5 vol phenol, followed by 0.5 vol chloroform/isoamylalcohol. The RNA was then precipitated
with 3 vol of 4 mol/l sodium acetate (pH 7.0), to remove con-taminating proteoglycans, at -20°C overnight. Total RNA was recovered by centrifugation, washed with 75% ethanol, air dried, dissolved in diethylpyrocarbonate-treated water, and stored at -80°C until further use. RNA concentration and purity (260/280 absorbance ratio) were determined by spectropho-tometry. RNA integrity was confirmed by visualization on ethid-ium bromide stained 1% weight/vol agarose-formaldehyde gels.
Microarray
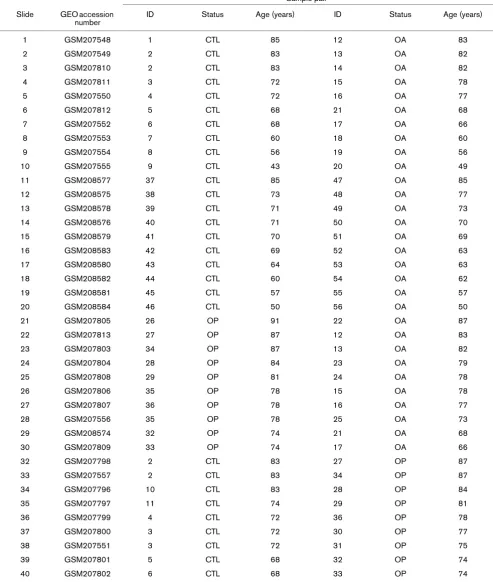
RNA was further purified using RNeasy columns (Qiagen, Hilden, Germany), in accordance with the manufacturer's instructions. RNA (5 μg) was amplified using a Message Amp II kit (Ambion, Austin, TX, USA) with indirect, amino allyl medi-ated incorporation of either Cy3 or Cy5 dyes (Amersham Bio-sciences, Piscataway, NJ, USA), in accordance with the manufacturer's instructions. A Compugen Human 19K-oligo library (Jamesburg, NJ, USA) spotted onto Corning glass slides (Lowell, MA, USA) by the Adelaide Microarray facility (AMF) was used in this study. The Compugen human oligo library consisted of 17,260 oligonucleotide 65-mers each rep-resenting a single human gene. The slides were interrogated by competitive hybridization with 5 μg each of Cy3 and Cy5 labelled pairs of OA-control, OA-OP, or OP-control amplified RNA samples. The sample pairs used in the microarray analy-sis are listed in Table 1. Sample pairs were age-matched as closely as possible.
A biological dye-swap strategy was employed rather than a replicate dye swap strategy. This involved swapping of Cy3 and Cy5 labelling of the samples in each pair for each group of paired samples to balance for potential dye incorporation and signal intensity bias. It also reduced the number of slides required for the experiment and maximized the statistical power of the experiment with regard to analyzing the biological differences between samples.
Table 1
Control versus OA versus OP sample microarray comparisons
Sample pair
Slide GEO accession number
ID Status Age (years) ID Status Age (years)
1 GSM207548 1 CTL 85 12 OA 83
2 GSM207549 2 CTL 83 13 OA 82
3 GSM207810 2 CTL 83 14 OA 82
4 GSM207811 3 CTL 72 15 OA 78
5 GSM207550 4 CTL 72 16 OA 77
6 GSM207812 5 CTL 68 21 OA 68
7 GSM207552 6 CTL 68 17 OA 66
8 GSM207553 7 CTL 60 18 OA 60
9 GSM207554 8 CTL 56 19 OA 56
10 GSM207555 9 CTL 43 20 OA 49
11 GSM208577 37 CTL 85 47 OA 85
12 GSM208575 38 CTL 73 48 OA 77
13 GSM208578 39 CTL 71 49 OA 73
14 GSM208576 40 CTL 71 50 OA 70
15 GSM208579 41 CTL 70 51 OA 69
16 GSM208583 42 CTL 69 52 OA 63
17 GSM208580 43 CTL 64 53 OA 63
18 GSM208582 44 CTL 60 54 OA 62
19 GSM208581 45 CTL 57 55 OA 57
20 GSM208584 46 CTL 50 56 OA 50
21 GSM207805 26 OP 91 22 OA 87
22 GSM207813 27 OP 87 12 OA 83
23 GSM207803 34 OP 87 13 OA 82
24 GSM207804 28 OP 84 23 OA 79
25 GSM207808 29 OP 81 24 OA 78
26 GSM207806 35 OP 78 15 OA 78
27 GSM207807 36 OP 78 16 OA 77
28 GSM207556 35 OP 78 25 OA 73
29 GSM208574 32 OP 74 21 OA 68
30 GSM207809 33 OP 74 17 OA 66
32 GSM207798 2 CTL 83 27 OP 87
33 GSM207557 2 CTL 83 34 OP 87
34 GSM207796 10 CTL 83 28 OP 84
35 GSM207797 11 CTL 74 29 OP 81
36 GSM207799 4 CTL 72 36 OP 78
37 GSM207800 3 CTL 72 30 OP 77
38 GSM207551 3 CTL 72 31 OP 75
39 GSM207801 5 CTL 68 32 OP 74
40 GSM207802 6 CTL 68 33 OP 74
moderated t-statistic score is based on the ratio of the log2 fold change to its standard error. Because there is no consensus on appropriate adjustment of P values in the context of micro-arrays, genes of interest were chosen based on a combination of statistical and biological indicators. Microarray data have been deposited in the Gene Expression Omnibus [50] and are accessible through Gene Expression Omnibus series number GSE8406.
Real-time PCR
First-strand reverse transcription cDNA synthesis was per-formed on 1 μg amplified RNA from each sample using a first-strand cDNA synthesis kit with Superscript II (Invitrogen,
Carlsbad, CA, USA) and 250 ng random hexamer primer (Geneworks, Adelaide, SA, Australia), in accordance with the manufacturer's instructions. Template cDNA (1 μl of 1/100 dilution of cDNA) was amplified using iQ SYBR Green Super-mix (BioRad, Hercules, CA, USA) on a Rotor-Gene thermocy-cler (Corbett Research, Mortlake, NSW, Australia). The reactions were incubated at 94°C for 10 min for 1 cycle, and then 94°C (20 seconds), 60°C, or 65°C (ADAMTS4 and MMP25 only; 20 seconds) and 72°C (30 seconds) for 40 cycles. This set of cycles was followed by an additional exten-sion step at 72°C for 5 minutes. All PCR reactions were vali-dated by the presence of a single peak in the melt curve analysis, and amplification of a single specific product was
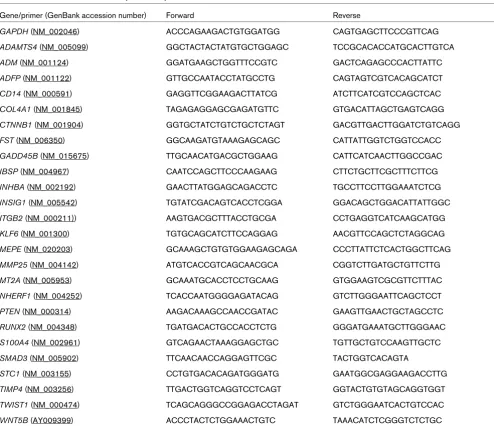
fur-Table 2
GenBank accession numbers and primer sequences
Gene/primer (GenBank accession number) Forward Reverse
GAPDH (NM_002046) ACCCAGAAGACTGTGGATGG CAGTGAGCTTCCCGTTCAG
ADAMTS4 (NM_005099) GGCTACTACTATGTGCTGGAGC TCCGCACACCATGCACTTGTCA
ADM (NM_001124) GGATGAAGCTGGTTTCCGTC GACTCAGAGCCCACTTATTC
ADFP (NM_001122) GTTGCCAATACCTATGCCTG CAGTAGTCGTCACAGCATCT
CD14 (NM_000591) GAGGTTCGGAAGACTTATCG ATCTTCATCGTCCAGCTCAC
COL4A1 (NM_001845) TAGAGAGGAGCGAGATGTTC GTGACATTAGCTGAGTCAGG
CTNNB1 (NM_001904) GGTGCTATCTGTCTGCTCTAGT GACGTTGACTTGGATCTGTCAGG
FST (NM_006350) GGCAAGATGTAAAGAGCAGC CATTATTGGTCTGGTCCACC
GADD45B (NM_015675) TTGCAACATGACGCTGGAAG CATTCATCAACTTGGCCGAC
IBSP (NM_004967) CAATCCAGCTTCCCAAGAAG CTTCTGCTTCGCTTTCTTCG
INHBA (NM_002192) GAACTTATGGAGCAGACCTC TGCCTTCCTTGGAAATCTCG
INSIG1 (NM_005542) TGTATCGACAGTCACCTCGGA GGACAGCTGGACATTATTGGC
ITGB2 (NM_000211)) AAGTGACGCTTTACCTGCGA CCTGAGGTCATCAAGCATGG
KLF6 (NM_001300) TGTGCAGCATCTTCCAGGAG AACGTTCCAGCTCTAGGCAG
MEPE (NM_020203) GCAAAGCTGTGTGGAAGAGCAGA CCCTTATTCTCACTGGCTTCAG
MMP25 (NM_004142) ATGTCACCGTCAGCAACGCA CGGTCTTGATGCTGTTCTTG
MT2A (NM_005953) GCAAATGCACCTCCTGCAAG GTGGAAGTCGCGTTCTTTAC
NHERF1 (NM_004252) TCACCAATGGGGAGATACAG GTCTTGGGAATTCAGCTCCT
PTEN (NM_000314) AAGACAAAGCCAACCGATAC GAAGTTGAACTGCTAGCCTC
RUNX2 (NM_004348) TGATGACACTGCCACCTCTG GGGATGAAATGCTTGGGAAC
S100A4 (NM_002961) GTCAGAACTAAAGGAGCTGC TGTTGCTGTCCAAGTTGCTC
SMAD3 (NM_005902) TTCAACAACCAGGAGTTCGC TACTGGTCACAGTA
STC1 (NM_003155) CCTGTGACACAGATGGGATG GAATGGCGAGGAAGACCTTG
TIMP4 (NM_003256) TTGACTGGTCAGGTCCTCAGT GGTACTGTGTAGCAGGTGGT
TWIST1 (NM_000474) TCAGCAGGGCCGGAGACCTAGAT GTCTGGGAATCACTGTCCAC
WNT5B (AY009399) ACCCTACTCTGGAAACTGTC TAAACATCTCGGGTCTCTGC
[image:5.612.61.555.276.702.2]ther confirmed by electrophoresis on a 2.5% weight/vol agar-ose gel. Primers were designed for each gene that primed in separate exons and spanned at least one intron to avoid con-taminating amplification from genomic DNA. Primers were obtained from Geneworks. Amplicons were designed to be in the 100 to 200 base pairs size range. GenBank accession numbers for gene sequences and primer sequences are pro-vided in Table 2. Real-time PCR validation was carried out using the 2-ΔΔCT method [51]. Reactions were performed in duplicate. Normalized gene expression values for each gene based on cycle threshold (CT) values for each of the genes and the housekeeping gene GAPDH were generated. Mean ± standard deviation (SD) values were generated from eight samples from each group of either OA or control samples tested.
Statistical analysis
The statistical significance of the differences between the means of the OA and control or OP gene expression values was determined using Student's t-test. The critical value for significance was chosen as P < 0.05.
Results
Microarray analysis of OA, control and OP bone samples
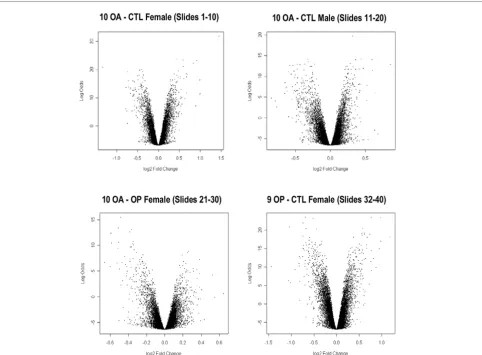
This study used Compugen human 19K-oligo human micro-array slides to compare the gene expression profiles of OA, control and OP bone samples, with the aim being to identify altered gene expression in OA bone. Microarray analysis was conducted in four sets of samples (39 comparisons in total), comprising 10 OA-control female sample pairs, 10 OA-control male sample pairs, 10 OA-OP female sample pairs and 9 OP-control female sample pairs. Samples from individuals with a range of ages were analyzed in each group, but with sample pairs age-matched as closely as possible (Table 1). Bayesian statistical analysis was carried out using LIMMA to identify sta-tistically significant differentially expressed genes between OA, control and OP bone. Log odds score versus log2 fold change volcano plots of differentially expressed genes from each of the four groups of sample pair comparisons are shown in Figure 1. The log odds (or B statistic) score is the log odds that that gene is differentially expressed. The log2 fold change represents the fold change in expression of the gene. Small levels of differential expression (ranging from 0.38-fold to 2.83-fold change in expression) were detected, with several hundred differentially expressed genes present in each group-ing, with t scores above 6. The moderated t-statistic score is based on the ratio of the log2 fold change to its standard error.
Identification and functional classification of top-ranking differentially expressed genes in OA bone
By comparing the lists of ranked differentially expressed genes from each of the four initial groupings, we were able to identify a group of differentially expressed genes that was more likely to be associated with the OA disease process. This group of genes was assembled by filtering out genes that were similarly
regulated between OA-control and OP-control samples in order to remove genes that were more likely to be differentially expressed because of potential differences caused by sourc-ing bone at surgery versus autopsy. Because there were also very few significant differences in gene expression between the male and female OA-control groups, these data were com-bined because it strengthened the statistical significance of the genes identified as differentially expressed. Using these selection processes, several hundred genes from each initial grouping was reduced to a list of 150 differentially expressed genes in OA bone with t scores above 4.
Gene function and pathway analyses were carried out by searching the National Centre for Biotechnology Information database [52] and by using various analysis programs includ-ing OntoExpress [53] and Gostat [54]. We were able to iden-tify a group of 62 top-ranking OA differentially expressed genes from within the initial list of 150 genes, which have known or suspected roles (direct or indirect via angiogenesis) in influencing bone development or bone remodelling (Table 3). For many of the genes both osteogenic and angiogenic roles have been described. In addition, a subset of these genes, particularly those that encode secreted, cell surface and extracellular matrix molecules, also have potential chondrogenic functions, consistent with the proposal that an altered OA subchondral bone microenvironment could inter-fere with cartilage metabolism.
Although many of the genes identified in this analysis have pleiotropic effects in bone and other tissues, it was of interest that many of the top-ranking differentially expressed genes in OA bone have known or suspected roles in osteoblast and osteocyte differentiation and function. These genes included ADAMTS4, ADM, GADD45B, IBSP, MMP25, MT2A, STC1, MEPE, TWIST1, IGFBP3, S100A4, AKT3 and COL4A1. There was also a group of differentially expressed genes in OA bone that have known or potential roles in osteoclast function, such as the previously mentioned osteoblast-related genes ADAMTS4, GADD45B, STC1 and IGFB3, as well as ADAM8, CCR2, CSTA, RAC2, CRYAB and CYP1B. Func-tionally, within the list of genes given in Table 3, there are genes encoding secreted molecules (ADM, ANGPTL4, STC1, CORT, IGFBP3 and MIF), cell surface molecules (SELL, ICAM3, SELP, CRIM1, CLECSF6, CLECSF2, CCR2 and SLC14A1), intracellular signalling molecules (RAB20, YWHAG, RAC2, NHERF1, GNA11 and SNX9), protein kinases (AKT3 and PRKCD), calcium and metal ion binding proteins (S100A4, S100A6, MT1L, MT2A and MT1G), tran-scription factors (TWIST1, FMR2, KLF6, NR4A2 and DEC1), and both enzymatic (ADAMTS4, MMP25, ADAM8, TIMP4, GALNT4 and CTSG) and structural (TGFBI, IBSP, MEPE, MFAP3L and COL4A1) extracellular matrix molecules.
confirm a selection of the differentially expressed genes iden-tified by the microarray analysis of OA, control and OP bone. The real-time PCR results (depicted as fold differential expression) are shown alongside the microarray results in Table 3. In total, the differential expression levels of 20 genes were examined using real-time PCR. Results for 16 genes reached statistical significance (P < 0.01) for differential expression between OA and control bone. The differential expression of four genes (TGFBI, S100A6, SLC14A1 and SNX9) could not be confirmed. The female control samples 1– 8 (age range 56 to 85 years, mean [ ± SD] age 70.5 ± 10 years) and female OA samples 12–19 (age range 56 to 83 years; mean age 73 ± 10.8 years) were used to confirm the microarray data by real-time PCR (Table 1). The mean age of the OA group did not differ significantly from that in the control group. Interestingly, although the microarray expression ratios were quite small (ranging from 0.62-fold change to 1.47-fold change in expression), the fold difference in expression identi-fied using the real-time PCR reactions was significantly
greater in most cases (ranging from 0.08-fold change to 2.6-fold change in expression). This probably reflects differences in sensitivity between the two techniques [55,56]. The differ-ence is probably also accentuated by the competitive pair-wise comparison of samples used by the microarray platform in this study compared with the individual gene/GAPDH CT expression ratio values generated using real-time PCR. Encouragingly, there was a high confirmation rate with the real-time PCR and consistency between the microarray and PCR detection of expression ratio differences for each of the genes analyzed, suggesting that the majority of the genes identified by the microarray are bona fide differentially expressed genes in OA bone.
Altered expression of WNT and TGF-β/BMP signalling pathway component and target genes in OA bone
[image:7.612.71.553.94.448.2]A significant number of the top-ranking differentially expressed genes in OA bone were identified as WNT signalling pathway targets (Table 3). WNT targets included upregulated genes Figure 1
Bayesian statistical analysis of differentially expressed genes using LIMMA
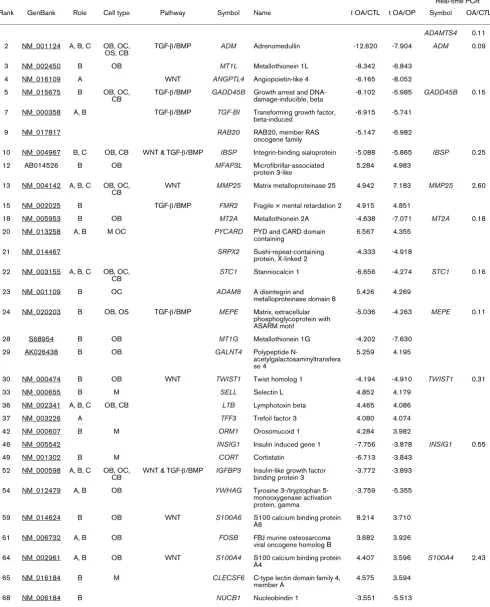
Table 3
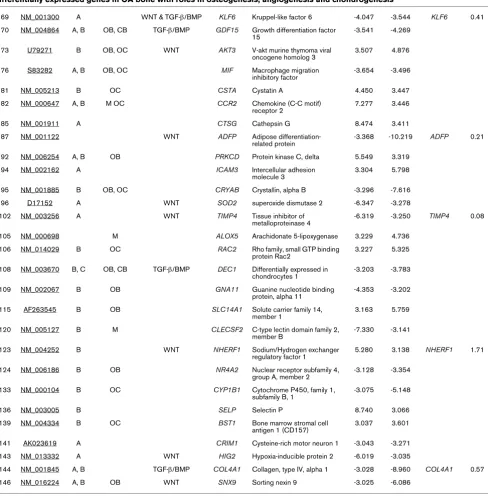
Differentially expressed genes in OA bone with roles in osteogenesis, angiogenesis and chondrogenesis
Real-time PCR Rank GenBank Role Cell type Pathway Symbol Name t OA/CTL t OA/OP Symbol OA/CTL
ADAMTS4 0.11 2 NM_001124 A, B, C OB, OC,
OS, CB TGF-β/BMP ADM Adrenomedullin -12.620 -7.904 ADM 0.09 3 NM_002450 B OB MT1L Metallothionein 1L -8.342 -6.843
4 NM_016109 A WNT ANGPTL4 Angiopoietin-like 4 -6.165 -8.052 5 NM_015675 B OB, OC,
CB TGF-β/BMP GADD45B Growth arrest and DNA-damage-inducible, beta -8.102 -5.985 GADD45B 0.15 7 NM_000358 A, B TGF-β/BMP TGF-BI Transforming growth factor,
beta-induced -6.915 -5.741 9 NM_017817 RAB20 RAB20, member RAS
oncogene family -5.147 -6.982
10 NM_004967 B, C OB, CB WNT & TGF-β/BMP IBSP Integrin-binding sialoprotein -5.088 -5.865 IBSP 0.25 12 AB014526 B OB MFAP3L Microfibrillar-associated
protein 3-like
5.284 4.983
13 NM_004142 A, B, C OB, OC, CB
WNT MMP25 Matrix metalloproteinase 25 4.942 7.183 MMP25 2.60
15 NM_002025 B TGF-β/BMP FMR2 Fragile × mental retardation 2 4.915 4.851
18 NM_005953 B OB MT2A Metallothionein 2A -4.638 -7.071 MT2A 0.18 20 NM_013258 A, B M OC PYCARD PYD and CARD domain
containing
6.567 4.355
21 NM_014467 SRPX2 Sushi-repeat-containing protein, X-linked 2
-4.333 -4.918
22 NM_003155 A, B, C OB, OC, CB
STC1 Stanniocalcin 1 -6.656 -4.274 STC1 0.16
23 NM_001109 B OC ADAM8 A disintegrin and metalloproteinase domain 8
5.426 4.269
24 NM_020203 B OB, OS TGF-β/BMP MEPE Matrix, extracellular phosphoglycoprotein with ASARM motif
-5.036 -4.263 MEPE 0.11
28 S68954 B OB MT1G Metallothionein 1G -4.202 -7.630 29 AK026438 B OB GALNT4 Polypeptide
N-acetylgalactosaminyltransfera se 4
5.259 4.195
30 NM_000474 B OB WNT TWIST1 Twist homolog 1 -4.194 -4.910 TWIST1 0.31 33 NM_000655 B M SELL Selectin L 4.852 4.179
36 NM_002341 A, B, C OB, CB LTB Lymphotoxin beta 4.465 4.086 37 NM_003226 A TFF3 Trefoil factor 3 4.080 4.074 42 NM_000607 B M ORM1 Orosomucoid 1 4.284 3.982
46 NM_005542 INSIG1 Insulin induced gene 1 -7.756 -3.878 INSIG1 0.55 49 NM_001302 B M CORT Cortistatin -6.713 -3.843
52 NM_000598 A, B, C OB, OC, CB
WNT & TGF-β/BMP IGFBP3 Insulin-like growth factor binding protein 3
-3.772 -3.893
54 NM_012479 A, B OB YWHAG Tyrosine 3-/tryptophan 5-monooxygenase activation protein, gamma
-3.759 -5.355
59 NM_014624 B OB WNT S100A6 S100 calcium binding protein
A6 8.214 3.710
61 NM_006732 A, B OB FOSB FBJ murine osteosarcoma
viral oncogene homolog B 3.682 3.926 64 NM_002961 A, B OB WNT S100A4 S100 calcium binding protein
A4 4.407 3.596 S100A4 2.43 65 NM_016184 B M CLECSF6 C-type lectin domain family 4,
such as MMP25 and S100A4, and downregulated genes such as IBSP, TWIST1 and TIMP4. The altered expression of these genes suggests that WNT signalling may be perturbed in the OA bone microenvironment. This was apparently borne out by closer examination of the extended list of differentially
expressed genes in OA bone, which revealed further WNT sig-nalling pathway components and modulators such as WNT5B, FZD3, SFRP5, APC, AXIN2, PTEN and NHERF1. These genes, and additional WNT target genes such as CD14, APOE, ID1, IL6, FST and RUNX2, are listed in Table
69 NM_001300 A WNT & TGF-β/BMP KLF6 Kruppel-like factor 6 -4.047 -3.544 KLF6 0.41 70 NM_004864 A, B OB, CB TGF-β/BMP GDF15 Growth differentiation factor
15
-3.541 -4.269
73 U79271 B OB, OC WNT AKT3 V-akt murine thymoma viral oncogene homolog 3
3.507 4.876
76 S83282 A, B OB, OC MIF Macrophage migration inhibitory factor
-3.654 -3.496
81 NM_005213 B OC CSTA Cystatin A 4.450 3.447 82 NM_000647 A, B M OC CCR2 Chemokine (C-C motif)
receptor 2 7.277 3.446 85 NM_001911 A CTSG Cathepsin G 8.474 3.411 87 NM_001122 WNT ADFP Adipose
differentiation-related protein
-3.368 -10.219 ADFP 0.21
92 NM_006254 A, B OB PRKCD Protein kinase C, delta 5.549 3.319 94 NM_002162 A ICAM3 Intercellular adhesion
molecule 3 3.304 5.798 95 NM_001885 B OB, OC CRYAB Crystallin, alpha B -3.296 -7.616 96 D17152 A WNT SOD2 superoxide dismutase 2 -6.347 -3.278 102 NM_003256 A WNT TIMP4 Tissue inhibitor of
metalloproteinase 4 -6.319 -3.250 TIMP4 0.08 105 NM_000698 M ALOX5 Arachidonate 5-lipoxygenase 3.229 4.736
106 NM_014029 B OC RAC2 Rho family, small GTP binding protein Rac2
3.227 5.325
108 NM_003670 B, C OB, CB TGF-β/BMP DEC1 Differentially expressed in chondrocytes 1
-3.203 -3.783
109 NM_002067 B OB GNA11 Guanine nucleotide binding protein, alpha 11
-4.353 -3.202
115 AF263545 B OB SLC14A1 Solute carrier family 14, member 1
3.163 5.759
120 NM_005127 B M CLECSF2 C-type lectin domain family 2, member B
-7.330 -3.141
123 NM_004252 B WNT NHERF1 Sodium/Hydrogen exchanger regulatory factor 1
5.280 3.138 NHERF1 1.71
124 NM_006186 B OB NR4A2 Nuclear receptor subfamily 4, group A, member 2
-3.128 -3.354
133 NM_000104 B OC CYP1B1 Cytochrome P450, family 1, subfamily B, 1
-3.075 -5.148
136 NM_003005 B SELP Selectin P 8.740 3.066 139 NM_004334 B OC BST1 Bone marrow stromal cell
antigen 1 (CD157) 3.037 3.601 141 AK023619 A CRIM1 Cysteine-rich motor neuron 1 -3.043 -3.271 143 NM_013332 A WNT HIG2 Hypoxia-inducible protein 2 -6.019 -3.035
144 NM_001845 A, B TGF-β/BMP COL4A1 Collagen, type IV, alpha 1 -3.028 -8.960 COL4A1 0.57 146 NM_016224 A, B OB WNT SNX9 Sorting nexin 9 -3.025 -6.086
Rank' indicates the ranking within the top 150 differentially expressed genes in osteoarthritis (OA) bone compared with control (CTL) and osteoporosis (OP) bone. 'Role' indicates the known or suspected role of the gene: A, angiogenic; B, osteogenic; and C, chondrogenic. 'Cell type' indicates the cell type that the gene is expressed in or affects: OB, osteoblast, OC, osteoclast, OS, osteocyte, CB, chondroblast, or M, monocyte. 't OA/CTL' is the t score of OA compared with CTL differential expression of gene: a positive value indicates upregulation in OA and a negative one indicates downregulation in OA. 't OA/OP' is the t score of OA compared with OP differential expression of gene: a positive value indicates upregulation in OA and a negative one indicates downregulation in OA. The moderated t-statistic score is based on the ratio of the log2 fold change to its standard error. 'OA/CTL' under 'Real-time PCR' indicates the fold change in gene expression expressed
[image:9.612.63.551.108.603.2]as ratio of OA to CTL.
Table 3 (Continued)
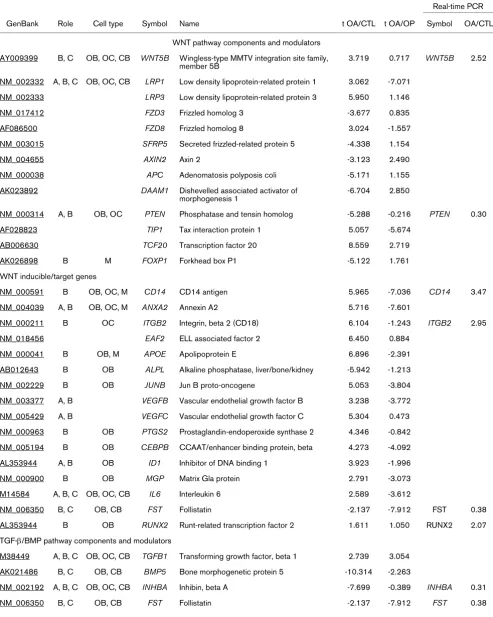
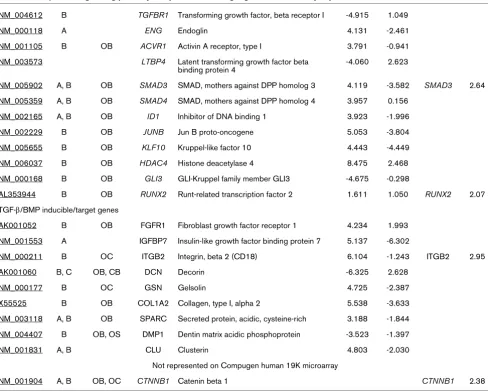
Table 4
WNT and TGF-β/BMP signalling pathway components and target genes differentially expressed in OA bone
Real-time PCR
GenBank Role Cell type Symbol Name t OA/CTL t OA/OP Symbol OA/CTL
WNT pathway components and modulators
AY009399 B, C OB, OC, CB WNT5B Wingless-type MMTV integration site family, member 5B
3.719 0.717 WNT5B 2.52
NM_002332 A, B, C OB, OC, CB LRP1 Low density lipoprotein-related protein 1 3.062 -7.071
NM_002333 LRP3 Low density lipoprotein-related protein 3 5.950 1.146
NM_017412 FZD3 Frizzled homolog 3 -3.677 0.835
AF086500 FZD8 Frizzled homolog 8 3.024 -1.557
NM_003015 SFRP5 Secreted frizzled-related protein 5 -4.338 1.154
NM_004655 AXIN2 Axin 2 -3.123 2.490
NM_000038 APC Adenomatosis polyposis coli -5.171 1.155
AK023892 DAAM1 Dishevelled associated activator of
morphogenesis 1
-6.704 2.850
NM_000314 A, B OB, OC PTEN Phosphatase and tensin homolog -5.288 -0.216 PTEN 0.30
AF028823 TIP1 Tax interaction protein 1 5.057 -5.674
AB006630 TCF20 Transcription factor 20 8.559 2.719
AK026898 B M FOXP1 Forkhead box P1 -5.122 1.761
WNT inducible/target genes
NM_000591 B OB, OC, M CD14 CD14 antigen 5.965 -7.036 CD14 3.47
NM_004039 A, B OB, OC, M ANXA2 Annexin A2 5.716 -7.601
NM_000211 B OC ITGB2 Integrin, beta 2 (CD18) 6.104 -1.243 ITGB2 2.95
NM_018456 EAF2 ELL associated factor 2 6.450 0.884
NM_000041 B OB, M APOE Apolipoprotein E 6.896 -2.391
AB012643 B OB ALPL Alkaline phosphatase, liver/bone/kidney -5.942 -1.213
NM_002229 B OB JUNB Jun B proto-oncogene 5.053 -3.804
NM_003377 A, B VEGFB Vascular endothelial growth factor B 3.238 -3.772
NM_005429 A, B VEGFC Vascular endothelial growth factor C 5.304 0.473
NM_000963 B OB PTGS2 Prostaglandin-endoperoxide synthase 2 4.346 -0.842
NM_005194 B OB CEBPB CCAAT/enhancer binding protein, beta 4.273 -4.092
AL353944 A, B OB ID1 Inhibitor of DNA binding 1 3.923 -1.996
NM_000900 B OB MGP Matrix Gla protein 2.791 -3.073
M14584 A, B, C OB, OC, CB IL6 Interleukin 6 2.589 -3.612
NM_006350 B, C OB, CB FST Follistatin -2.137 -7.912 FST 0.38
AL353944 B OB RUNX2 Runt-related transcription factor 2 1.611 1.050 RUNX2 2.07
TGF-β/BMP pathway components and modulators
M38449 A, B, C OB, OC, CB TGFB1 Transforming growth factor, beta 1 2.739 3.054
AK021486 B, C OB, CB BMP5 Bone morphogenetic protein 5 -10.314 -2.263
NM_002192 A, B, C OB, OC, CB INHBA Inhibin, beta A -7.699 -0.389 INHBA 0.31
4. The differences in expression of this group of genes (t scores above 3) in general were not as pronounced as that seen for the target genes identified from within the top-ranking 150 genes.
In addition, a significant number of TGF-β/BMP signalling pathway target genes were identified as being differentially expressed in OA bone (Table 3). TGF-β/BMP signalling path-way targets included downregulated genes such as ADAMTS4, ADM, GADD45B, MEPE and COL4A1. The altered expression of these genes also suggests that TGF-β/ BMP signalling may be perturbed in the OA bone microenvi-ronment. Additional evidence for this was that genes for
TGF-β/BMP signalling pathway components and modulators, such
as TGFB1, BMP5, INHBA, SMAD3 and FST, were also iden-tified in the extended list of differentially expressed genes in OA bone. These genes, and additional TGF-β/BMP target genes identified, such as COL1A2, GSN, DMP1 and ITGB2, are listed in Table 4. The differences in expression of this group of genes (t scores above 3) was not as pronounced as the target genes identified from within the top-ranking 150 genes.
Like the top-ranking list of 150 differentially expressed genes in OA bone, many of the WNT and TGF-β/BMP signalling pathway related genes identified in Table 4 also have known or suspected roles in either osteoblast (WNT5B, PTEN, CD14, SMAD3, RUNX2, ID1, HDAC4, TGFB1, BMP5,
NM_004612 B TGFBR1 Transforming growth factor, beta receptor I -4.915 1.049
NM_000118 A ENG Endoglin 4.131 -2.461
NM_001105 B OB ACVR1 Activin A receptor, type I 3.791 -0.941
NM_003573 LTBP4 Latent transforming growth factor beta
binding protein 4
-4.060 2.623
NM_005902 A, B OB SMAD3 SMAD, mothers against DPP homolog 3 4.119 -3.582 SMAD3 2.64
NM_005359 A, B OB SMAD4 SMAD, mothers against DPP homolog 4 3.957 0.156
NM_002165 A, B OB ID1 Inhibitor of DNA binding 1 3.923 -1.996
NM_002229 B OB JUNB Jun B proto-oncogene 5.053 -3.804
NM_005655 B OB KLF10 Kruppel-like factor 10 4.443 -4.449
NM_006037 B OB HDAC4 Histone deacetylase 4 8.475 2.468
NM_000168 B OB GLI3 GLI-Kruppel family member GLI3 -4.675 -0.298
AL353944 B OB RUNX2 Runt-related transcription factor 2 1.611 1.050 RUNX2 2.07
TGF-β/BMP inducible/target genes
AK001052 B OB FGFR1 Fibroblast growth factor receptor 1 4.234 1.993
NM_001553 A IGFBP7 Insulin-like growth factor binding protein 7 5.137 -6.302
NM_000211 B OC ITGB2 Integrin, beta 2 (CD18) 6.104 -1.243 ITGB2 2.95
AK001060 B, C OB, CB DCN Decorin -6.325 2.628
NM_000177 B OC GSN Gelsolin 4.725 -2.387
X55525 B OB COL1A2 Collagen, type I, alpha 2 5.538 -3.633
NM_003118 A, B OB SPARC Secreted protein, acidic, cysteine-rich 3.188 -1.844
NM_004407 B OB, OS DMP1 Dentin matrix acidic phosphoprotein -3.523 -1.397
NM_001831 A, B CLU Clusterin 4.803 -2.030
Not represented on Compugen human 19K microarray
NM_001904 A, B OB, OC CTNNB1 Catenin beta 1 CTNNB1 2.38
[image:11.612.62.550.111.502.2]'Role' indicates the known or suspected role of the gene: A, angiogenic; B, osteogenic; and C, chondrogenic. 'Cell type' indicates the cell type that the gene is expressed in or affects: OB, osteoblast, OC, osteoclast, OS, osteocyte, CB, chondroblast, or M, monocyte. 't OA/CTL' is the t score of osteoarthritis (OA) compared with control (CTL) differential expression of gene: a positive value indicates upregulation in OA and a negative one indicates downregulation in OA. 't OA/OP' is the t score of OA compared with osteoporosis (OP) differential expression of gene: a positive value indicates upregulation in OA and a negative one indicates downregulation in OA. The moderated t-statistic score is based on the ratio of the log2 fold change to its standard error. 'OA/CTL' under 'Real-time PCR' indicates the fold change in gene expression expressed as ratio of OA to CTL. BMP, bone morphogenic protein; TGF, transforming growth factor.
Table 4 (Continued)
INHBA, DMP1 and FST) or osteoclast (CD14, PTEN, FOXP1, ANXA2, ITGB2, IL6 and GSN) differentiation and function.
The differential expression of a selection of these WNT and TGF-β/BMP signalling pathway component and target genes was confirmed by real-time PCR. In total, the differential expression of 11 genes was examined by real-time PCR (Table 4). The differential expression of two genes (LRP1 and IGFBP7) could not be confirmed. However, results for the other nine genes reached statistical significance (P < 0.01) for differential expression between OA and control bone. CTNNB1 was assayed directly by real-time PCR because it was not represented on the Compugen H19K library. Seven of the remaining nine genes (with FST and RUNX2 being the exceptions) were represented in the top-ranking 300 genes differentially regulated in OA bone. These genes were tested, like those listed in Table 3, using female control samples 1 to 8 and female OA samples 12 to 19 (Table 1). The range of fold difference in expression identified by the real-time PCR reac-tions was slightly smaller (ranging from 0.3-fold change to 3.47-fold change in expression) than for the group of genes tested from the top ranking 150 genes in Table 3.
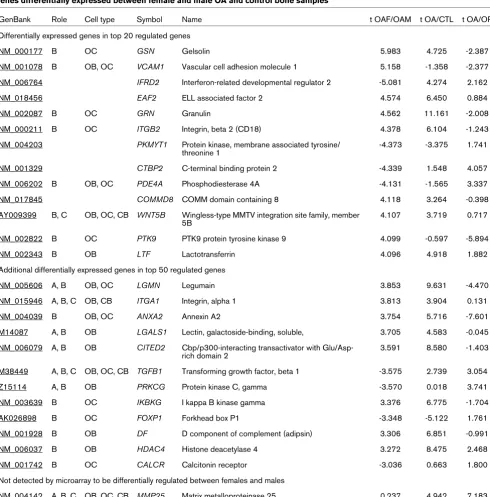
Identification of differentially expressed OA genes between females and males
There is a higher incidence of primary hip OA in females than in males [1], and we were interested in identifying differences in gene expression between females and males that may con-tribute to this disparity. Therefore, we tested for differences between the OA-control female and male microarray datasets. Genes with the greatest difference in expression between females and males in the OA-control microarray comparisons are listed in Table 5. There were very few significant differ-ences in gene expression between females and males. How-ever, approximately 50 genes with t scores above 3, which included the top-ranking 20 genes with t scores above 4, were identified as being differentially expressed between females and males. Interestingly, a significant proportion of these genes have known or suspected roles in osteoclast-lineage cells and osteoclasts (GSN, PTK9, VCAM1, ITGB2, GRN, ANXA2, PDE4A and FOXP1). There are also genes with known roles in osteoblasts (LTF, DF, PRKCG and TGFB1). A number of the highest ranking differentially expressed genes between females and males in OA bone also involve WNT sig-nalling pathway components, including WNT5B, along with the EAF2 and CTBP2 genes, which encode transcription fac-tors that are involved in mediating WNT signalling.
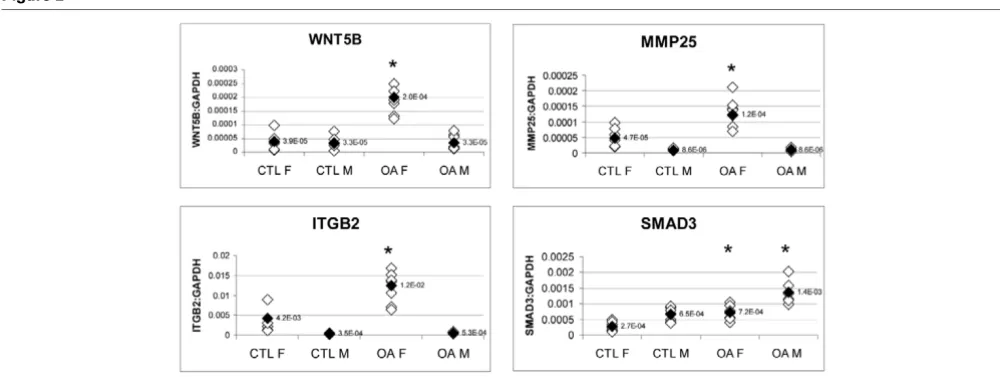
The differential expressions of WNT5B and ITGB2 (along with MMP25) between females and males in OA bone were con-firmed by real-time PCR (Figure 2). MMP25 was not originally identified as being differentially expressed between females and males in OA bone by microarray analysis. WNT5B, ITGB2 and MMP25 were all found to be differentially expressed only
in females, and not in males, between OA and control bone. The OA/control ratios of expression for the WNT5B gene were 2.52 in female samples (P < 0.01) and 0.92 in male sam-ples (P = 0.7486); those for the ITGB2 gene were 2.95 (P < 0.01) and 1.35 (P = 0.1173), respectively; and those for the MMP25 gene were 2.60 (P < 0.01) and 1.01 (P = 0.4748), respectively. There was also a significant difference in the total expression levels of these three genes between females and males, being approximately 6-fold, 14-fold and 23-fold higher for WNT5B, MMP25 and ITGB2, respectively, in females than in males in OA bone. Thirteen other genes (ADAM8, ADM, ADAMTS4, ADFP, CD14, COL14A1, GADD45B, LRP1, S100A4, SMAD3, TGFBI, TIMP4 and TWIST1) were also tested for differential expression between females and males in OA bone, but none of these was found to be differently expressed (data not shown). Genes were tested using female control samples 1 to 8 and OA samples 12 to 19 as compared with male control samples 37 to 44 (age range 60 to 85 years; mean [ ± SD] age 70.4 ± 7.3 years) and OA samples 47 to 54 (62 to 85 years; 70.3 ± 8 years; Table 1). The mean ages of the female and male OA groups did not significantly differ from those of the control groups. Of the other 13 genes examined by PCR, only SMAD3 had significant differences in total expression levels between males and females, being approxi-mately 2-fold higher in males than in females (Figure 2). How-ever, SMAD3 was similarly differentially regulated between OA and control bone in both females and males (ratio of OA/ control: 2.64 in females [P < 0.01] and 2.08 in males [P < 0.01]).
Discussion
In this study we identified altered expression of WNT and TGF-β/BMP signalling pathway component and target genes in OA bone distal to the disease site (from the IT region of the proximal femur). This was accomplished by using microarray analysis to compare gene expression in bone from individuals with end-stage OA disease and individuals without obvious OA (control or OP). The genes identified include those with known or suspected roles in osteoblast, osteocyte and osteo-clast differentiation and function, as well as angiogenesis, sug-gesting perturbation of these processes and a role for altered bone remodelling in OA pathogenesis.
secondary to the disease. However, by sampling the IT region we have avoided secondary pathogenic changes that the subchondral bone undergoes at the joint as the disease progresses (such as sclerosis, osteophytes and cysts), which could confound identification of altered gene expression
[image:13.612.62.552.107.603.2]potentially responsible for the underlying subchondral bone remodelling. Therefore, we suggest that the altered gene expression identified in the IT region from OA bone may be informative about underlying systemic OA disease mecha-nisms that also operate at the joint in the subchondral bone. Table 5
Genes differentially expressed between female and male OA and control bone samples
GenBank Role Cell type Symbol Name t OAF/OAM t OA/CTL t OA/OP
Differentially expressed genes in top 20 regulated genes
NM_000177 B OC GSN Gelsolin 5.983 4.725 -2.387
NM_001078 B OB, OC VCAM1 Vascular cell adhesion molecule 1 5.158 -1.358 -2.377
NM_006764 IFRD2 Interferon-related developmental regulator 2 -5.081 4.274 2.162
NM_018456 EAF2 ELL associated factor 2 4.574 6.450 0.884
NM_002087 B OC GRN Granulin 4.562 11.161 -2.008
NM_000211 B OC ITGB2 Integrin, beta 2 (CD18) 4.378 6.104 -1.243
NM_004203 PKMYT1 Protein kinase, membrane associated tyrosine/
threonine 1
-4.373 -3.375 1.741
NM_001329 CTBP2 C-terminal binding protein 2 -4.339 1.548 4.057
NM_006202 B OB, OC PDE4A Phosphodiesterase 4A -4.131 -1.565 3.337
NM_017845 COMMD8 COMM domain containing 8 4.118 3.264 -0.398
AY009399 B, C OB, OC, CB WNT5B Wingless-type MMTV integration site family, member 5B
4.107 3.719 0.717
NM_002822 B OC PTK9 PTK9 protein tyrosine kinase 9 4.099 -0.597 -5.894
NM_002343 B OB LTF Lactotransferrin 4.096 4.918 1.882
Additional differentially expressed genes in top 50 regulated genes
NM_005606 A, B OB, OC LGMN Legumain 3.853 9.631 -4.470
NM_015946 A, B, C OB, CB ITGA1 Integrin, alpha 1 3.813 3.904 0.131
NM_004039 B OB, OC ANXA2 Annexin A2 3.754 5.716 -7.601
M14087 A, B OB LGALS1 Lectin, galactoside-binding, soluble, 3.705 4.583 -0.045
NM_006079 A, B OB CITED2 Cbp/p300-interacting transactivator with Glu/Asp-rich domain 2
3.591 8.580 -1.403
M38449 A, B, C OB, OC, CB TGFB1 Transforming growth factor, beta 1 -3.575 2.739 3.054
Z15114 A, B OB PRKCG Protein kinase C, gamma -3.570 0.018 3.741
NM_003639 B OC IKBKG I kappa B kinase gamma 3.376 6.775 -1.704
AK026898 B OC FOXP1 Forkhead box P1 -3.348 -5.122 1.761
NM_001928 B OB DF D component of complement (adipsin) 3.306 6.851 -0.991
NM_006037 B OB HDAC4 Histone deacetylase 4 3.272 8.475 2.468
NM_001742 B OC CALCR Calcitonin receptor -3.036 0.663 1.800
Not detected by microarray to be differentially regulated between females and males
NM_004142 A, B, C OB, OC, CB MMP25 Matrix metalloproteinase 25 0.237 4.942 7.183
The first main finding of this study is that many of the top-rank-ing differentially expressed genes in OA bone (Table 3) have known or suspected roles in osteoblast and osteocyte differ-entiation and function. (Also see Table 6 for descriptions of the functions of selected genes: MEPE, IBSP, MT2A, ADM, STC1, IGFBP3, GADD45B, ADAMTS4, S100A4 and MMP25.) Significantly, the changes in expression of these genes as a group suggest altered osteoblast and osteocyte activity in OA bone, which is consistent with increased bone volume fraction and under-mineralization previously reported in OA bone [3,4,11,22-25]. For instance, MEPE (matrix extra-cellular phosphoglycoprotein), which is highly expressed in osteoblasts and osteocytes, appears to be an important regu-lator of bone formation and mineralization. Targeted disruption of MEPE has been found to result in increased bone formation and bone mass [58]. MEPE was found to be downregulated in OA bone, which is consistent with the increased trabecular bone volume in OA. MMP25 (upregulated in OA bone) encodes a metalloproteinase that plays a role in MMP2 activation [59], and MMP2 is a major effector in osteocytes, with MMP2-/- mice exhibiting disrupted osteocytic networks and altered bone remodelling and mineralization [60]. The MMP2-/- mice have a complex bone phenotype that includes reduced bone volume in the long bones. Upregulation of MMP25 in OA bone is consistent with increased activity of MMP2 and increased bone volume.
Interestingly, and in contrast to the large number of differen-tially expressed genes identified in OA bone with osteoblast-related and osteocyte-osteoblast-related roles, a substantial group of top-ranking differentially expressed genes identified in OP bone (data not shown) have known or suspected roles in osteoclast-lineage cells. The change in expression of these genes as a
group is consistent with increased osteoclast numbers, activ-ity and bone resorption, leading to the reduction of bone vol-ume seen in OP. There was also a group of differentially expressed genes identified in OA bone that have known or potential roles in osteoclast function (Tables 3 to 5). However, the overall change in expression of these genes, as a group, was not as consistent as for those genes identified with oste-oblast-related functions. For instance, the change in expres-sion of a subset of these genes (ADAMTS4, GADD45B, IGFBP3 and CSTA) is consistent with decreased osteoclast activity and increased bone volume in OA, whereas the change in expression of another subset of these osteoclast-related genes (ADAM8, STC1, CCR2, RAC2, CRYAB, CYP1B, CD14, PTEN, ANXA2 and GSN) suggests upregu-lated osteoclast activity (Table 6). It is now becoming clear that, in addition to osteoblasts being intimately involved in influencing osteoclast-lineage cell differentiation and function [61], the converse may also be true [62,63]. As a result, per-turbed osteoblast or osteoclast gene expression could lead to complex changes in communication between these bone cell types and their remodelling behaviour in OA bone. Therefore, differential expression of a subset of the osteoclast-related genes, suggesting upregulated osteoclast activity, is consist-ent with the increased levels of bone remodelling seen in OA bone and perhaps a net gain of under-mineralized bone rather than the net loss of bone volume seen in OP.
Important inter-relationships between bone remodelling and angiogenesis are also now emerging, and so perturbations to angiogenic molecular pathways could contribute to the changes seen in OA bone. Consistent with a role for increased angiogenesis in OA bone, leading to increased bone volume and potentially turnover, is the upregulation of a group of top-Figure 2
PCR analysis of WNT5B, ITGB2, MMP25 and SMAD3 expression between females and males in OA bone
[image:14.612.55.555.91.279.2]Table 6
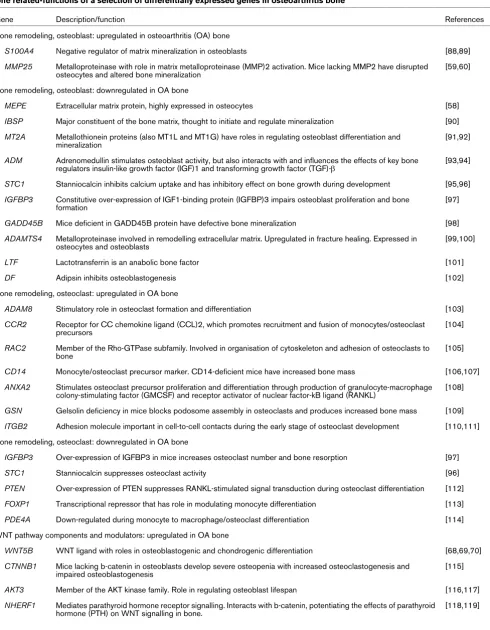
Bone related-functions of a selection of differentially expressed genes in osteoarthritis bone
Gene Description/function References
Bone remodeling, osteoblast: upregulated in osteoarthritis (OA) bone
S100A4 Negative regulator of matrix mineralization in osteoblasts [88,89]
MMP25 Metalloproteinase with role in matrix metalloproteinase (MMP)2 activation. Mice lacking MMP2 have disrupted osteocytes and altered bone mineralization
[59,60]
Bone remodeling, osteoblast: downregulated in OA bone
MEPE Extracellular matrix protein, highly expressed in osteocytes [58]
IBSP Major constituent of the bone matrix, thought to initiate and regulate mineralization [90]
MT2A Metallothionein proteins (also MT1L and MT1G) have roles in regulating osteoblast differentiation and mineralization
[91,92]
ADM Adrenomedullin stimulates osteoblast activity, but also interacts with and influences the effects of key bone regulators insulin-like growth factor (IGF)1 and transforming growth factor (TGF)-β
[93,94]
STC1 Stanniocalcin inhibits calcium uptake and has inhibitory effect on bone growth during development [95,96]
IGFBP3 Constitutive over-expression of IGF1-binding protein (IGFBP)3 impairs osteoblast proliferation and bone formation
[97]
GADD45B Mice deficient in GADD45B protein have defective bone mineralization [98]
ADAMTS4 Metalloproteinase involved in remodelling extracellular matrix. Upregulated in fracture healing. Expressed in osteocytes and osteoblasts
[99,100]
LTF Lactotransferrin is an anabolic bone factor [101]
DF Adipsin inhibits osteoblastogenesis [102]
Bone remodeling, osteoclast: upregulated in OA bone
ADAM8 Stimulatory role in osteoclast formation and differentiation [103]
CCR2 Receptor for CC chemokine ligand (CCL)2, which promotes recruitment and fusion of monocytes/osteoclast precursors
[104]
RAC2 Member of the Rho-GTPase subfamily. Involved in organisation of cytoskeleton and adhesion of osteoclasts to bone
[105]
CD14 Monocyte/osteoclast precursor marker. CD14-deficient mice have increased bone mass [106,107]
ANXA2 Stimulates osteoclast precursor proliferation and differentiation through production of granulocyte-macrophage colony-stimulating factor (GMCSF) and receptor activator of nuclear factor-kB ligand (RANKL)
[108]
GSN Gelsolin deficiency in mice blocks podosome assembly in osteoclasts and produces increased bone mass [109]
ITGB2 Adhesion molecule important in cell-to-cell contacts during the early stage of osteoclast development [110,111]
Bone remodeling, osteoclast: downregulated in OA bone
IGFBP3 Over-expression of IGFBP3 in mice increases osteoclast number and bone resorption [97]
STC1 Stanniocalcin suppresses osteoclast activity [96]
PTEN Over-expression of PTEN suppresses RANKL-stimulated signal transduction during osteoclast differentiation [112]
FOXP1 Transcriptional repressor that has role in modulating monocyte differentiation [113]
PDE4A Down-regulated during monocyte to macrophage/osteoclast differentiation [114]
WNT pathway components and modulators: upregulated in OA bone
WNT5B WNT ligand with roles in osteoblastogenic and chondrogenic differentiation [68,69,70]
CTNNB1 Mice lacking b-catenin in osteoblasts develop severe osteopenia with increased osteoclastogenesis and impaired osteoblastogenesis
[115]
AKT3 Member of the AKT kinase family. Role in regulating osteoblast lifespan [116,117]
NHERF1 Mediates parathyroid hormone receptor signalling. Interacts with b-catenin, potentiating the effects of parathyroid hormone (PTH) on WNT signalling in bone.
ranking differentially expressed genes with recognized pro-angiogenic functions (MMP25, S100A4, FOSB, TFF3, CTSG and LTB) and downregulation of a group of genes that nega-tively influence angiogenesis (HIG2, ADAMTS4, ANGPTL4, STC1, KLF6, IGFBP3, TIMP4 and GDF15).
In addition, a subset of the genes with roles in osteoblasts, particularly those that encode secreted, cell surface and extra-cellular matrix molecules, including ADM, IBSP, MMP25, STC1, IGFBP3, WNT5B, FST, TGFB1, BMP5 and INHBA, also have potential chondrogenic functions. Altered expres-sion of many of these genes is consistent with the proposal that similar altered expression of these genes in osteoblasts in the subchondral bone microenvironment could interfere with chondrocyte or cartilage metabolism. For instance, ADM, which is downregulated in OA bone has a pro-chondrogenic role [64]. Reduced levels of ADM could negatively affect chondrocyte/cartilage metabolism.
The second significant and connected observation from this study was that many of the top-ranking differentially expressed genes identified in OA bone (with osteoblast, osteocyte and osteoclast related roles) were WNT or TGF-β/BMP signalling pathway target genes. This observation, on closer examination of the ranked list of differentially expressed in OA bone, led to the identification of additional sets of differentially expressed genes that were WNT or TGF-β/BMP signalling pathway com-ponent or modulator genes. These data together suggest that the WNT and TGF-β/BMP signalling pathways are altered in OA bone and may play a role(s) in OA pathogenesis. Both the
WNT and TGF-β/BMP signalling pathways have been impli-cated in influencing bone mass and bone remodelling [32-34] and have been demonstrated to do this by controlling both osteoblast and osteoclast differentiation and function [65-67].
WNT signalling, in terms of bone mass and bone remodelling, is a very complex process that depends on the interplay of a large number of WNT ligands, the receptors they complex with, prevailing antagonists and particular combinations of β -catenin/transcription factor complexes that ultimately control the expression of the target genes. Interestingly, the only gene encoding a WNT ligand, WNT5B, that was identified as being differentially expressed (upregulated in OA bone) in the present study was recently demonstrated to increase in expression during in vitro osteoblast differentiation [68]. The protein encoded by WNT5B is known to have both stimulatory and inhibitory effects on bone and cartilage cells, and signals through both the canonical and noncanonical WNT signalling pathways, depending on the receptor it complexes with at the cell surface [68-70]. Along with WNT5B, there were also sev-eral other important WNT pathway related genes that were altered in their expression in OA bone. Genes for the WNT5B co-receptor FZD3 and extracellular WNT antagonist SFRP5 were under-expressed, relative to controls, suggesting increased WNT signalling. Downregulation of the intracellular signalling cascade genes PTEN, APC and AXIN2, and upreg-ulation of CTNNB1, AKT3 and NHERF1 are also consistent with increased WNT signalling. CTNNB1 encodes β-catenin, which is the central downstream mediator of canonical WNT signalling, which forms a complex with lymphoid enhancer
fac-WNT pathway components and modulators: downregulated in OA bone
FZD3 WNT5B co-receptor [120]
PTEN Modulates/antagonises WNT signalling. Roles in osteoclast and osteoblast differentiation [112,117]
APC Loss of APC in mice leads to increased bone mass [115]
AXIN2 Negatively regulates both expansion of osteoprogenitors and maturation of osteoblasts through its modulation of WNT signalling
[121]
TGF-β/bone morphogenic protein (BMP) pathway components and modulators: upregulated in OA bone
ACVR1 BMP and activin A receptor. Mutation in receptor causes ectopic osteogenesis [122]
SMAD3 Important mediator of TGF-β signalling and regulator of osteoblastogenesis and bone formation [80,82]
ID1 Transcription factor with roles in bone formation and osteoblast proliferation and differentiation [123]
RUNX2 Key transcription factor involved in promoting osteoblast differentiation [76]
TGF-β/BMP pathway components and modulators: downregulated in OA bone
TGFB1 Growth factor with key role in regulating bone development and metabolism [34,80]
INHBA TGF-β family member. Can act as either inhibitor or activator of bone formation and osteoblast differentiation [124,125]
BMP5 Secreted signalling molecule involved in skeletal development and genetically implicated in OA [29]
[image:16.612.57.553.108.368.2]FST TGF-β/BMP antagonist that inhibits osteoblast differentiation [126]
Table 6 (Continued)
tor/T cell factor (LEF/TCF) transcription factors to modulate target gene expression [71], whereas PTEN, APC, AXIN2, AKT3 and NHERF1 gene products modulate β-catenin activ-ity (Table 6).
Like WNT signalling, TGF-β/BMP signalling is similarly com-plex, with a large family of ligands, cognate receptors and intracellular signalling molecules involved in the pathway, exerting both stimulatory and inhibitory effects on bone remod-elling. Several TGF-β/BMP signalling pathway component and modulator genes that influence osteoblast function, bone remodelling and bone mineralization were identified as altered in OA bone. These included TGFB1, INHBA, ACVR1, BMP5, FST and SMAD3 (Table 6).
There is significant crosstalk between the WNT and TGF-β/ BMP signalling pathways. β-Catenin, SMAD3 and runt-related transcription factor (RUNX)2 potentially play important roles in mediating the crosstalk between the WNT and TGF-β/BMP signalling pathways via direct interactions and in complexes with the TCF/LEF transcription factor family members in the nucleus [72-75]. We observed increased RUNX2 expression in OA bone in this study, which is consistent with increased osteoblast differentiation and activity in OA bone. RUNX2, which is a WNT inducible gene, encodes a transcription factor that plays roles in mediating both WNT and TGF-β/BMP sig-nalling, and is essential for osteoblast differentiation and skel-etal development [66,75-77]. Intriguingly, decreased expression of RUNX2 has been shown to reduce cartilage destruction and subchondral bone changes in a mouse joint instability OA model [78], suggesting a role for increased RUNX2 expression in OA pathogenesis. An important role for RUNX2 in OA pathogenesis is supported by our microarray data. The products of several of the top-ranking differentially expressed genes identified, such as TWIST1 (twist homo-logue 1) [79], FOXF1 (forkhead box F1), ID1 (inhibitor of DNA binding 1), HDAC4 (histone deacetylase 4) and SMAD3, modify RUNX2 expression or interact with and modify RUNX2 function. SMAD3 is an important mediator of TGF-β regulation of bone mechanical properties and composition [80]. TGF-β represses RUNX2, and one of the ways it does this is through recruitment of the histone deacetylase HDAC4 by SMAD3 [81]. However, SMAD3 over-expression (SMAD3 was upreg-ulated in OA bone in the present study) has also been reported to induce RUNX2 expression and osteoblast differ-entiation [82]. Significantly, several of the highest ranking dif-ferentially expressed genes identified in this study in OA bone are targets of RUNX2 and SMAD3, such as GADD45B [83], ADAMTS4 [84] and MEPE [82].
Finally, the molecular mechanisms that are responsible for the greater incidence of OA in females are not known. Genes may operate differently in the two sexes, at different body sites and on different disease features within body sites [27]. Interest-ingly, of the relatively small number of differences between
females and males in OA bone identified in this study, there were significant numbers of genes that were involved in both osteoclast (for example, ANXA2, GSN, ITGB2, FOXP1 and PDE4A) and osteoblast (LTF, DF and TGFB1) function and hence bone remodelling (Tables 5 and 6). Collectively, the dif-ferential expression of these genes is consistent with increased bone turnover in OA females compared with males, suggesting an OA disease mechanism and perhaps partly accounting for a greater incidence of OA in females than in males.
A number of the highest ranking differentially expressed genes between OA females and males include WNT signalling path-way components such as WNT5B and the transcription factor genes EAF2 and CTBP2. In addition MMP25 and ITGB2 are WNT target genes, suggesting a difference between females and males in WNT signalling that may have an impact on the OA bone microenvironment. There is also evidence of cross-talk between WNT and oestrogen signalling pathways via functional interaction between β-catenin and oestrogen recep-tor-α [85]. A number of the genes identified in our study, including WNT5B, ITGB2, GSN, VCAM1, LTF and DF, are affected by oestrogen, potentially providing a mechanism by which they are differentially expressed in females compared with males. Examples of sexual dimorphism in mammalian gene expression related to different responses to disease by females and males are beginning to be identified [86]. The dif-ferences in expression levels of WNT5B, ITGB2 and MMP25 detected between females and males in OA bone is of interest and marks these genes as good candidates for further investi-gation into the sex disparity in OA.