R E S E A R C H A R T I C L E
Open Access
The impact of frailty on healthcare
utilisation in Ireland: evidence from the
Irish longitudinal study on ageing
Lorna Roe
1*, Charles Normand
1, Maev-Ann Wren
2, John Browne
3and Aisling M. O
’
Halloran
4Abstract
Introduction:To examine the impact of frailty on medical and social care utilisation among the Irish
community-dwelling older population to inform strategies of integrated care for older people with complex needs.
Methods: Participants aged ≥65 years from the Irish Longitudinal Study on Ageing (TILDA) representative of
the Irish community-dwelling older population were analysed (n= 3507). The frailty index was used to examine patterns of utilisation across medical and social care services. Multivariate logistic and negative binomial regression models were employed to examine the impact of frailty on service utilisation outcomes after controlling for other factors.
Results:The prevalence of frailty and pre-frailty was 24% (95% CI: 23, 26%) and 45% (95% CI: 43, 47%) respectively. Frailty was a significant predictor of utilisation of most social care and medical care services after controlling for the main correlates of frailty and observed individual effects.
Conclusions: Frailty predicts utilisation of many different types of healthcare services rendering it a useful risk stratification tool for targeting strategies of integrated care. The pattern of care is predominantly medical as few of the frail older population use social care prompting questions about sub-groups of the frail older population with unmet care needs.
Keywords:Frailty, Healthcare utilisation, Complex needs, Ageing, Health and social care planning
Background
Advances in health technologies and improvements in standards of living have resulted in significant longevity gains. In 1916, over half of the Irish population died be-fore reaching 65 years of age, most commonly from in-fectious diseases. A century later, eight in ten deaths occur in old age and chronic non-communicable dis-eases are the leading cause of death [1]. Today’s manage-ment of acute health episodes, previously deemed life-threatening, results in many older people surviving into their eighties and nineties [2, 3]. However, epidemio-logical and demographic changes like this challenge healthcare systems, specifically; managing older people presenting with complex combinations of chronic
conditions, geriatric conditions and disabilities [4, 5]. Healthcare systems have been designed traditionally to manage everyday health problems in general practice and acute health events in hospital, resulting in complex en-titlement structures and fragmented care delivery for those patients who require care from both sectors. Add-itionally, patients report difficulties navigating, activating and managing services needed to meet their medical and personal-care needs often over a number of years [6–10]. ‘Integrated care’has been proposed as a solution to man-age this type of problem, viewed as a strategy to improve the patient experience through better coordination of ser-vices across all service boundaries [11]. It is a prominent health policy goal [12–14], however, it is recognised as a resource-intensive effort and thus commonly targeted to people with complex needs who require different types of services [15, 16].
* Correspondence:loroe@tcd.ie
1Centre for Health Policy and Management, Trinity College Dublin, 3-4 Foster
Place, College Green, Dublin 2, Ireland
Full list of author information is available at the end of the article
Targeting older people with complex needs is a prior-ity as older people are recognised as intensive users of healthcare services. However, conceptualising those older people with complex ‘breadth and depth’ to their needs is challenging. Chronological age alone is not a re-liable predictor of healthcare utilisation. Likewise, dis-ability has been found to increase the odds of using social care but not medical care [17] while multimorbid-ity has been found to increase the odds of using medical care but not social care [18]. The concept of frailty may bridge this gap and act as a lens for complex needs in old age.
Frailty is recognised as a multidimensional geriatric con-dition, characterised by a decreased reserve and associated with increased risk of adverse outcomes such as falls, hos-pitalisation, nursing home admission and death, when en-countering minor stressors [19]. Frailty is related to, but distinct from disability and multimorbidity [20]. It is a common condition, with prevalence in the community-dwelling population aged ≥65 years ranging from 4% to 59% [21]. It is associated with increasing age which has implications for country’s with an ageing demographic, such as Ireland [22]. In practice, it is recommended that frailty is identified and managed with care planning, the activation and ongoing management of an integrated package of services [23–27]. Many early pilot studies of in-tegrated care targeted older people with frailty [28, 29]. However, it is not clear how to scale these local pilots to national level, as these pilots were designed and imple-mented without using evidence on the frail older popula-tion napopula-tionally, their current patterns in service utilisapopula-tion and whether it was frailty that determined high levels of service utilisation or other factors.
As countries focus their strategy for integrated care on those patients with “complex needs” it is important that such strategies are progressed in a systematic manner with a strong evidence base. Currently little is known about the frail older population in Ireland and their current patterns of service utilisation. Results of studies among community-dwelling older people in other coun-tries indicate frailty has an important role in explaining variation in service use [30–38]. However, the evidence is limited by the multitude of frailty measures in use, reflecting the lack of an agreed standard definition and conceptualisation of frailty in the literature [27]. Two approaches, a frailty-phenotype and a cumulative deficits approach are commonly used [39]. While phenotype frailty is more frequently used in population-based stud-ies [40, 41], both approaches are similar with respect to their strong predictive value for negative outcomes [39] but, different in that each classifies different individuals as frail with only partial overlap [42, 43]. The aim of this study is to examine the relationship between frailty and service utilisation after controlling for confounders such
as other healthcare needs, entitlements and socio-economic factors. In so doing, this study will improve our understanding of the potential burden of frailty on healthcare systems as population’s age.
Methods
This cross-sectional study was based on data from wave one of The Irish Longitudinal Study on Ageing (TILDA), a prospective cohort study. TILDA collects data from a representative sample of the Irish community-dwelling population aged≥50 years and covers several aspects of social, economic, life-style, physical health and health-care utilisation. In TILDA, participants are selected ac-cording to a multistage sampling design, including stratification, clustering and systematic sampling, which has been described extensively elsewhere [44]. The resulting sample is self-weighting except for biases caused by non-random variations in response rates. These biases have been dealt with at the analysis stage by means of calibration weights.
Data were collected over a 17-month period from October 2009 to February 2011 through a computer assisted personal interview, a self-completed question-naire and a nurse-led health assessment. Respondents were required to provide written informed consent to participate in the study which may have resulted in the exclusion of those with severe cognitive impair-ment. In total, 8175 individuals aged ≥50 years were interviewed at baseline. We restricted our analysis to the older adult population aged ≥65 years (n = 3507) as frailty is more prevalent in this age-group and 65 years is the minimum age at which one can apply for Services for Older People in the Irish healthcare system.
Respondents reported their utilisation of a range of healthcare services in the 12 months preceding the sur-vey, see Additional file 1. Dichotomous variables cap-tured if a respondent used a range of community-based services; dietician, respite, chiropody, physiotherapy, hearing, social work, psychological, homecare (the home help service and personal care service), day centre, opti-cian, dental, community nurse/public health nurse (PHN), occupational therapy (OT), meals on wheels, speech and language therapy. Count variables captured the frequency with which respondents visited the general practitioner (GP), emergency department (ED), out-patient clinic and the number of day case procedures, hospital overnight admissions and nights spent in a hospital.
and theoretical reasoning were grouped as predisposing, enabling and need factors.
Need factors
Independent variables reflecting a need for care included frailty, disability, multimorbidity, falls, self-reported physical health and self-reported emotional health.
Three frailty measures were constructed for use in the first step in the analysis. A cumulative deficits approach was operationalised with the construct of a frailty index (FI) [46] adapted to the TILDA database [47, 48]. The deficits included any symptom, sign, disease, disability or laboratory abnormality associated with age and adverse outcomes, present in at least 1% of the population, cov-ering several organ systems and which had under 5% missing data [49]. A 32-item index was constructed using self-report health measures and categorised into robust (FI score: <0.09374), pre-frail (FI score: 0.09375– 0.2499) and frail (FI score:≥0.25) based on index scores. Respondents missing no more than 20% of deficits were included in the analysis resulting in 3507 participants with a frailty index classification score. Additionally, two phenotype approach measures were operationalised in TILDA [50, 51]. Five objective measures; gait speed, ex-haustion, physical inactivity, unintentional weight loss and grip strength were used to construct a Fried Pheno-type measure [20]. Fewer respondents underwent a nurse-led health assessment, resulting in 2287 partici-pants with a Fried Phenotype classification score. Finally, the FRAIL scale [52] was operationalised using self-reported responses on five items; fatigue, resistance, ambulation, illness and loss of weight resulting in 2827 participants with a FRAIL scale classification score. Full details of the frailty measures are provided in Additional file 2.
Disability status was measured by combining re-sponses to the Activities of Daily Living (ADL) [53] and the Instrumental Activities of Daily Living (IADL) scales in which individuals with at least one ADL or IADL dif-ficulty were classified as ‘disabled’. Self-reported health status was assessed by asking respondents to rate their health relative to others of the same age and to rate their emotional or mental health, with responses dichoto-mised into “excellent, very good, good” and “fair, poor”. Respondents were asked if they had fallen in the previ-ous 12 months. Multimorbidity was conceived as the co-occurrence of multiple chronic or acute conditions within one person [54] and operationalized as threshold-multimorbidity indicated by two or more of the follow-ing conditions; self-reported poor vision; self-reported poor hearing; high blood pressure or hypertension; an-gina; heart attack; congestive heart failure; diabetes or high blood sugar; stroke (cerebral vascular disease); mini-stroke/ transient ischemic attack; high cholesterol;
heart murmur; heart arrhythmia; chronic lung disease; asthma; arthritis (including osteoarthritis, or rheuma-tism); osteoporosis; cancer; Parkinson’s disease; any emotional, nervous or psychiatric problem such as de-pression or anxiety; alcohol or substance abuse; Alzhei-mer’s disease; dementia, organic brain syndrome, senility; serious memory impairment; stomach ulcers; varicose ulcers; cirrhosis, or serious liver damage. A vari-able was generated indicating the presence of multimor-bidity based on these conditions.
Predisposing factors
Predisposing factors included age, gender, marital status and living arrangement. Living arrangement was trans-formed into a dichotomised variable for “living alone” and“living with spouse or others”.
Enabling factors
Enabling characteristics are described as the means indi-viduals have at their disposal to avail of services and in-cluded; education, healthcare entitlement, private health insurance, informal care, transport and household location.
Respondents were asked to indicate the highest level of education that they had completed which was classi-fied as“primary”,“secondary”and“third level or higher”. Healthcare entitlement was assessed by asking respon-dents about their entitlement to a medical card/GP-visit card and if they had purchased private health insurance. A medical card provides free GP care, eligibility for pub-licly provided community services and subsidised pre-scribed medicines while the GP visit card provides free GP care only. Private health insurance in Ireland can be typically used to purchase quicker access to hospital care. A categorical variable was generated indicating those older people with“no cover”,“private health insur-ance only”, “medical/GP card only” and “dual cover”. A binary variable for the availability of informal help was generated by asking family respondents if, in the last 2 years, they or their spouse/partner had received any practical household help and help with paperwork from non-resident children or grandchildren, other relatives or neighbours and friends. The availability of transport was identified by asking respondents about the type of transport used regularly in the previous 12 months. To drive or to be driven was the most common answer and the variable was transformed to reflect those who could drive or be driven.
Krustal-Wallis test for the non-normally distributed count dependent outcomes. Tests were two-tailed, with αthreshold of 0.05 for statistical significance. Basic pat-terns between frailty and health and social care out-comes were examined across three quasi-continuous measures of frailty; the frailty index, Fried phenotype and the FRAIL scale. All three frailty measures displayed statistically increased rates of service utilisation among the frail compared to the pre-frail and robust groups. The conceptualisation and operationalisation of frailty using the cumulative deficits approach, the Frailty Index, was associated with proportionately higher rates of ser-vice utilisation in contrast to the Fried and FRAIL scale, see Additional file 3. As a result, the frailty index was chosen for use in this study.
Next, regression techniques were used to test the rela-tionship between frailty and service use outcomes after controlling for other factors. Logistic regression was used to model the impact of frailty on the dichotomized service outcomes and the results were presented as odds ratios. Seven of the fifteen dichotomous dependent vari-ables had sufficient power for the analysis based on a guide of 10 cases required per independent variable to avoid a type II error. Consequently eight variables cap-turing utilisation of speech and language therapy, hear-ing, social work, psychological, meals on wheels, day centre, dietician and respite services which were re-ported in the summary analysis were dropped from the regression modelling. In modeling the utilisation of count variables, ordinary least squares (OLS) regression is not advisable because count data often violate the as-sumption of normality. It is common in health services research to encounter semi-continuous data which are characterized by a point mass at zero followed by a right-skewed continuous distribution [55]. Consequently, count data econometric methodologies, which assume a skewed, discrete distribution and restrict predicted values to non-negative values, are usually employed in modeling healthcare utilisation [56]. Two non-parametric methodologies; a negative binomial and pois-son regression were considered. The dispersion of the data is one criterion for deciding between a poisson and a negative binomial model as a poisson distribution as-sumes that the conditional mean is equal to the condi-tional variance [57]. Information criteria and log-likelihood values were used to choose the most appro-priate model specification [56, 57] where in each of the six models; lower akaike information criterion (AIC) values indicated that the negative binomial model was the more appropriate model for use and the results were presented as marginal effects.
A multivariate regression modeling strategy was devel-oped based on the underlying conceptual framework. A correlation analysis was run between all independent
variables; the results of which identified problematic col-linearity between informal care and disability (correl-ation score: 0.75) and marital status and living arrangements (correlation score: 0.82). Informal care and marital status were thus dropped from the model-ing. Each independent variable was examined as signifi-cant confounders in each bivariate model, tests were two-tailed with α adopted at the less conservative 0.10 significance level. Multivariate models examined in-cluded age, sex and those other independent variables which were significant in the bivariate analysis. The Breusch-Pagan test for heteroskedasticity indicated het-erogeneity which was corrected by estimating robust standard errors in the negative binomial models. Multi-collinearity diagnostics were performed using variance inflation factor analysis and final models were selected based on model fit determined by lower AIC values. Analyses were performed using STATA version 13.
Results
A total of 3507 participants (mean age: 74.03; 55% women) were included in this analysis. The weighted prevalence of frailty in the TILDA study sample aged ≥65 years using the categorical frailty index, Fried Phenotype and FRAIL scale, was 24%, 8% and 5% re-spectively. Disability was experienced by 19.5% of those aged ≥65 years and the prevalence of multimorbidity was 66.7% among this population, see Table 1. Just over one third of respondents lived alone. More than half of the respondents had primary school education only. Most respondents (79.3%) had access to free GP care through the medical card/GP visit card scheme. The ma-jority (88.22%) had access to personal transport by driv-ing or bedriv-ing driven. 12.6% of the older population reported having an informal carer for help with practical household tasks and paperwork.
93.8% of community-dwelling older people aged ≥65 years visited their GP at least once in the previous year. Rates of utilisation were lower across all other ser-vices. The second most frequently used service; hospital outpatient clinics, were utilised by 43.9% of the older population. The least frequently used service was the so-cial work service which was used by 0.26% of the older population. Less than 1 in 10 of the older population used services to support them to remain at home includ-ing homecare, respite care, meals on wheels and day centre care, see Table 1.
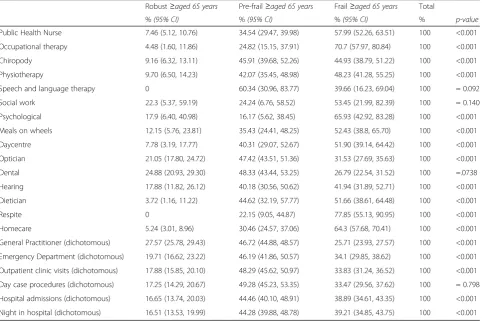
While the frail were the dominant users of these ser-vices, the proportion of the frail population utilising these services was less than one-third, see Fig. 2 and Table 3, while GP and outpatient clinic care was used by 98% and 60% respectively, of frail older population. Fi-nally, frailty had a statistically significant impact on the average amount of services utilised. While the majority of older people visited their GP in the previous year, frail older people had more visits on average, see Fig. 3 and Table 4. This was also the case for unplanned hospital care, particularly the number of nights spent in hospital. Finally, frailty was associated with higher amounts of outpatient care and day case procedures on average, by comparison to the pre-frail and robust.
[image:5.595.305.539.110.386.2] [image:5.595.58.290.111.723.2]Results for the impact of frailty on each of the seven community based dichotomized outcomes are presented in Table 5. In the unadjusted models, frailty was found to be a significant predictor of utilising these services. The impact of frailty is particularly notable with respect to the odds of utilising the homecare service (OR: 20.96) and the PHN (OR: 14.60). The effect of frailty is reduced in the adjusted models as other factors known to be determinants of service use are added to the model. Des-pite the inclusion of factors such as disability and health-care entitlement, a strong effect of frailty on the homecare service (OR: 7.4) was observed. In the multi-variate analysis, no statistically significant impact of frailty on the adjusted odds of using optician (p= 0.054),
Table 1Characteristics of the TILDA sample aged≥65 years (TILDA, wave 1)
General population≥aged 65 years
Variable Sub-category % (95% CI)
Frailty (FRAIL scale)
Robust 61.71 (59.77, 63.62)
Pre-frail 31.96 (30.13, 33.85)
Frail 6.33 (5.33, 7.50)
Frailty
(Fried phenotype)
Robust 48.48 (46.23, 50.74)
Pre-frail 43.41 (41.15, 45.69)
Frail 8.11 (6.84, 9.58)
Frailty (Frailty Index)
Robust 29.89 (28.14, 31.69)
Pre-frail 45.43 (43.67, 47.12)
Frail 24.68 (22.99, 26.45)
Multimorbidity Present 68.1 (66.23, 69.92)
Disability Present 19.55 (18.05, 21.13)
Self-reported physical health in comparison to others of a similar age
Fair/Poor 17.99 (16.49, 19.6)
Self-reported emotional health
Fair/Poor 10.15 (9.01, 11.41)
Falls Present 21.66 (20.13, 23.26)
Age Average years 74.03 (73.74, 74.32)
Sex Female 55.06 (53.62, 56.50)
Living arrangement
Alone 34.26 (32.49, 36.07)
Healthcare entitlement No cover 3.73 (3.09, 4.48)
Private health insurance only
16.94 (15.50, 18.49)
Medical card only 49.74 (47.31,52.18)
Dual cover 29.59 (27.59, 31.68)
Education Primary 56.58 (54.44, 58.70)
Secondary 31.11 (29.37, 32.91)
Third level or higher
12.3 (11.20, 13.50)
Household location
Urban 50.88 (46.78, 54.96)
Transport Available to
drive/driven
88.22 (86.58, 89.69)
Informal care Available informal care
12.61 (11.34, 14.00)
Healthcare utilisation in previous 12 months Public Health Nurse
12.12 (10.85, 13.51)
Occupational therapy
2.07 (1.60, 2.67)
Chiropody 9.04 (7.84, 10.40)
Physiotherapy 6.29 (5.48, 7.20)
Speech and language therapy
0.28 (0.15, 0.51)
Social work 0.26 (0.12, 0.53)
Table 1Characteristics of the TILDA sample aged≥65 years (TILDA, wave 1)(Continued)
Psychological 0.47 (0.30, 0.75)
Meals on wheels 1.95 (1.44, 2.63)
Daycentre 2.34 (1.85, 3.03)
Optician 18.06 (16.47, 19.77)
Dental 11.69 (10.42, 13.10)
Hearing 3.06 (2.48, 3.78)
Dietician 1.81 (1.40, 2.33)
Respite 0.75 (0.47, 1.17)
Homecare 8.24 (7.17, 9.44)
General Practitioner visits (dichotomous)
93.84 (92.93, 94.64)
Emergency Department visits (dichotomous)
16.11 (14.81, 17.5)
Outpatient clinic visits (dichotomous)
43.92 (41.94, 45.91)
Day case procedures (dichotomous)
17.72 (16.31, 19.26)
Hospital admissions (dichotomous)
15.86 (14.63, 17.16)
Night in hospital (dichotomous)
Fig. 1Weighted estimate of frailty among healthcare service users aged≥65 years (TILDA, wave 1)
Table 2Frailty classification among health services users aged≥65 years in the community (TILDA wave 1)
Robust≥aged 65 years Pre-frail≥aged 65 years Frail≥aged 65 years Total
%(95% CI) %(95% CI) %(95% CI) % p-value
Public Health Nurse 7.46 (5.12, 10.76) 34.54 (29.47, 39.98) 57.99 (52.26, 63.51) 100 <0.001
Occupational therapy 4.48 (1.60, 11.86) 24.82 (15.15, 37.91) 70.7 (57.97, 80.84) 100 <0.001
Chiropody 9.16 (6.32, 13.11) 45.91 (39.68, 52.26) 44.93 (38.79, 51.22) 100 <0.001
Physiotherapy 9.70 (6.50, 14.23) 42.07 (35.45, 48.98) 48.23 (41.28, 55.25) 100 <0.001
Speech and language therapy 0 60.34 (30.96, 83.77) 39.66 (16.23, 69.04) 100 = 0.092
Social work 22.3 (5.37, 59.19) 24.24 (6.76, 58.52) 53.45 (21.99, 82.39) 100 = 0.140
Psychological 17.9 (6.40, 40.98) 16.17 (5.62, 38.45) 65.93 (42.92, 83.28) 100 <0.001
Meals on wheels 12.15 (5.76, 23.81) 35.43 (24.41, 48.25) 52.43 (38.8, 65.70) 100 <0.001
Daycentre 7.78 (3.19, 17.77) 40.31 (29.07, 52.67) 51.90 (39.14, 64.42) 100 <0.001
Optician 21.05 (17.80, 24.72) 47.42 (43.51, 51.36) 31.53 (27.69, 35.63) 100 <0.001
Dental 24.88 (20.93, 29.30) 48.33 (43.44, 53.25) 26.79 (22.54, 31.52) 100 =.0738
Hearing 17.88 (11.82, 26.12) 40.18 (30.56, 50.62) 41.94 (31.89, 52.71) 100 <0.001
Dietician 3.72 (1.16, 11.22) 44.62 (32.19, 57.77) 51.66 (38.61, 64.48) 100 <0.001
Respite 0 22.15 (9.05, 44.87) 77.85 (55.13, 90.95) 100 <0.001
Homecare 5.24 (3.01, 8.96) 30.46 (24.57, 37.06) 64.3 (57.68, 70.41) 100 <0.001
General Practitioner (dichotomous) 27.57 (25.78, 29.43) 46.72 (44.88, 48.57) 25.71 (23.93, 27.57) 100 <0.001
Emergency Department (dichotomous) 19.71 (16.62, 23.22) 46.19 (41.86, 50.57) 34.1 (29.85, 38.62) 100 <0.001
Outpatient clinic visits (dichotomous) 17.88 (15.85, 20.10) 48.29 (45.62, 50.97) 33.83 (31.24, 36.52) 100 <0.001
Day case procedures (dichotomous) 17.25 (14.29, 20.67) 49.28 (45.23, 53.35) 33.47 (29.56, 37.62) 100 = 0.798
Hospital admissions (dichotomous) 16.65 (13.74, 20.03) 44.46 (40.10, 48.91) 38.89 (34.61, 43.35) 100 <0.001
[image:6.595.58.545.411.732.2]Fig. 2Weighted estimate of healthcare utilisation among robust, pre-frail and frail respondent’s aged≥65 years (TILDA, wave 1)
Table 3Health service use (previous 12 months) in the community population aged≥65 years by frailty classification (TILDA wave 1)
Robust≥aged 65 years Pre-frail≥aged 65 years Frail≥aged 65 years
%(95% CI) %(95% CI) %(95% CI) p-value
Public Health Nurse 3.02 (2.03, 4.49) 9.21 (7.71, 10.96) 28.47 (25.03, 32.18) <0.001
Occupational therapy 0.31 (0.11, 0.88) 1.13 (0.66, 1.91) 5.94 (4.41, 7.96) <0.001
Chiropody 2.77 (1.88, 4.07) 9.14 (7.57, 10.98) 16.46 (13.58, 19.80) <0.001
Physiotherapy 2.04 (1.34, 3.08) 5.83 (4.70, 7.20) 12.3 (10.22, 14.73) <0.001
Speech and language therapy 0 0.38 (0.17, 0.81) 0.46 (0.17, 1.16) = 0.092
Social work 0.19 (0.04, 0.79) 0.14 (0.04, 0.46) 0.56 (0.19, 1.61) = 0.140
Psychological 0.28 (0.10, 0.80) 0.17 (0.05, 0.48) 1.27 (0.71, 2.26) <0.001
Meals on wheels 0.79 (0.37, 1.68) 1.52 (0.98, 2.35) 4.14 (2.72, 6.25) <0.001
Daycentre 0.62 (0.24, 1.53) 2.11 (1.44, 3.06) 5.00 (3.52, 7.04) <0.001
Optician 12.72 (10.54, 15.28) 18.85 (16.73, 21.17) 23.07 (20.06, 26.39) <0.001
Dental 9.73 (7.81, 12.07) 12.44 (10.81, 14.28) 12.69 (10.47, 15.31) = 0.073
Hearing 1.83 (1.17, 2.84) 2.71 (1.96, 3.72) 5.21 (3.72, 7.24) <0.001
Dietician 0.22 (0.07, 0.71) 1.78 (1.22, 2.56) 3.79 (2.58, 5.53) <0.001
Respite 0 0.36 (0.14, 0.89) 2.36 (1.41, 3.94) <0.001
Homecare 1.45 (0.81, 2.55) 5.52 (4.33, 7.02) 21.47 (18.38, 24.91) <0.001
General Practitioner visits (dichotomous) 86.35 (84.09, 88.33) 96.3 (95.14, 97.19) 98.42 (97.03, 99.16) <0.001
Emergency Department visits (dichotomous) 10.62 (8.89, 12.63) 16.37 (14.49, 18.45) 22.3 (19.31, 25.61) <0.001
Outpatient clinic visits (dichotomous) 26.22 (23.37, 29.27) 46.68 (44.09, 49.28) 60.36 (56.3, 64.27) <0.001
Day case procedures (dichotomous) 10.23 (8.34, 12.47) 19.25 (17.32, 21.3) 24.02 (20.89, 27.46) <0.001
Hospital admissions (dichotomous) 8.83 (7.26, 10.71) 15.51 (13.72, 17.48) 25 (22.01, 28.26) <0.001
[image:7.595.63.537.400.721.2]dental (p = 0.199) and hearing (p= 0.099) services was detected.
Results for the impact of frailty in each of the six med-ical service count outcomes in the final model are pre-sented in Table 6.The unadjusted marginal effects for using GP and hospital-based services were significantly higher for frail compared with robust participants (refer-ence category). This was particularly so with respect to the marginal effects of frailty on frequency of GP visits where frailty was estimated as resulting in a marginal in-crease of 4.4 visits to the service. Frailty also had a large impact on the number of nights a respondent spent in hospital where the marginal effect of frailty was esti-mated as an additional 3.11 nights in comparison to the robust group. The effect of frailty found in the bivariate modelling was reduced after controlling for other need, enabling and predisposing variables. Adjusted marginal effects indicate that the frail participants had 2.29 times more GP visits, 1.50 times more outpatient visits, 0.23 times more hospital admissions, 0.41 times more day case procedures and 1.33 times more nights in a hospital in the previous 12 months in comparison to the robust category. Visits to the ED (p= 0.27) was no longer sta-tistically significant in the multivariate analysis.
Discussion
We found that frailty, measured with the frailty index, has an important role to play in explaining variation in service utilisation in Ireland, even when controlling for other health and socio-economic indicators. This is broadly consistent with the results of other research [30, 33, 35]. Consequently, there is strong evidence to rec-ommend the addition of frailty as an important ‘need’ variable in the Behavioural Model of Health Service Use in future studies as it captures previously unexplained variation in service utilisation across a range of different types of services.
The findings from this study indicate that general practice is a prominent service in the management of frailty. This study found that frailty results in a signifi-cant increase in the number of times an older person visited their GP in the previous year. This result was similarly found in a Europe-wide study [31]; in a Belgian study [30] and finally in an Australian study of men aged ≥70 years [32]. As each of these studies used different measures of frailty to this study, and different combina-tions of confounding variables, within slightly different populations, direct comparison of the magnitude of the effect is difficult.
[image:8.595.57.541.87.248.2]Fig. 3Weighted estimate of frailty and frequency of healthcare utilisation among respondent’s aged≥65 years (TILDA, wave 1)
Table 4Average use of health services in the previous 12 months among adults aged≥65 years by frailty classification (TILDA wave 1)
Population≥aged 65 years Robust≥aged 65 years Pre-frail≥aged 65 years Frail≥aged 65 years
Number of Average no. (95% CI) Average no. (95% CI) Average no. (95% CI) Average no. (95% CI) p-value
General Practitioner visits 4.99 (4.76, 5.21) 3.03 (2.82, 3.24) 4.91 (4.67, 5.15) 7.51 (6.89, 8.14) <0.001
Emergency Department visits 0.27 (0.23, 0.30) 0.19 (0.12, 0.25) 0.24 (0.19, 0.28) 0.42 (0.33, 0.50) <0.001
Outpatient visits 1.64 (1.49, 1.79) 0.6 (0.49, 0.72) 1.71(1.49, 1.93) 2.80 (2.34, 3.20) <0.001
Day case procedures 0.40 (0.33, 0.47) 0.13 (0.10, 0.16) 0.48 (0.35, 0.60) 0.58 (0.41, 0.76) <0.001
Hospital admissions 0.27 (0.23, 0.30) 0.12 (0.09, 0.15) 0.25 (0.19,0.30) 0.48 (0.39, 0.58) <0.001
[image:8.595.57.539.621.731.2]However, the largest effect of frailty is experienced in the homecare service where an individual who is frail is nearly twice as likely to receive a homecare service than someone who is pre-frail, and over eight times more likely to receive a homecare service than a robust individual. This effect of frailty on homecare has been found in another study in the Belgian context [30]. However frailty status alone did not solely determine the receipt of homecare services, and factors such as living alone and increasing age are significant determinants of
homecare utilisation which is in keeping with the findings in the Irish context [17, 58]. This study also found that frailty is a significant predictor of physiotherapy utilisation which is in keeping with the findings of a study of men aged≥70 living in Sydney [32].
Frailty had a significant impact on variation in patterns of unplanned hospital care; specifically hospital admis-sions and nights spent in hospital. These findings are in keeping with those observed in the Belgian study [30] and in a US study which found that a higher number of frailty deficits was associated with greater risk of hospitalization [33]. However, a significant relationship between frailty and the ED utilisation after adjusting for known confounders was not detected. This contrasts with findings in the Belgian study which found that the differences between frail and robust older people were most pronounced in their contacts with the ED [30]. Al-though this was not found in the Irish context among a similarly aged population, most of the variation in the analysis presented here was captured by disability, self-reported health and falls; variables which were not in-cluded in the Belgian model but which may reflect the unplanned acute health events which commonly lead to ED visits. However, frailty was found to be a significant predictor of length of stay in a hospital, in keeping with findings from an Australian study [32].
[image:9.595.57.292.122.245.2]Finally, this study found a statistically significant asso-ciation between frailty and planned hospital care; specif-ically visits to an outpatient clinic and any medical procedures which were carried out on as a day-case pro-cedure. This contrasts with a US study which did not find a statistically significant relationship between frailty and outpatient ED visits. The researchers concluded that their findings suggested that repeat outpatient ED visits are a unique type of health service utilisation that non-health-related factors may influence more significantly
Table 5Bivariate and multivariate logistic regression model for community-based service utilisation among adults aged ≥65 years (TILDA wave 1)
Unadjusted Odds Ratio Adjusted Odds Ratio
n Pre-frail Frail n Pre-frail Frail
Public Health Nursea 3507 3.61*** 14.60*** 3485 2.07** 3.95***
Chiropodyb 3507 3.42*** 7.46*** 3479 2.20** 2.86***
Physiotherapyc 3507 2.74*** 6.61*** 3491 2.31** 3.90***
Homecared 3507 4.10*** 20.96*** 3486 2.75** 7.39***
Opticiane 3507 1.61*** 2.11*** 3487 1.28 1.41
Dentalf 3507 1.37* 1.46** 3486 1.18 1.27
Hearingg 3507 1.50 2.87*** 3364 1.18 1.70
* =p< 0.05, ** =p< 0.01, *** =p< 0.001
The independent variables entered into each service outcome model were: a
Frailty, disability, multimorbidity, physical health, falls, age, gender, living arrangements, healthcare entitlement, transport, education
b
Frailty, disability, multimorbidity, physical health, emotional health, falls, age, gender, living arrangements, healthcare entitlement, transport, education, household location
c
Frailty, disability, multimorbidity, physical health, falls, age, gender, living arrangements
d
Frailty, disability, multimorbidity, physical health, emotional health, age, gender, living arrangements, healthcare entitlement, education e
Frailty, disability, multimorbidity, physical health, age, gender, living arrangements, healthcare entitlement, education
f
Frailty, multimorbidity, falls, age, gender, healthcare entitlement, education, household location
g
Frailty, disability, falls, age, gender, healthcare entitlement
Table 6Bivariate and multivariate negative binomial regression models for GP and hospital service utilisation among those adults aged≥65 years (TILDA wave 1)
Unadjusted marginal effect Adjusted marginal effect
n Pre-frail Frail n Pre-frail Frail
General Practitioner visitsa 3501 1.84*** 4.40*** 3471 1.35*** 2.29***
Outpatient clinic visitsb 3504 1.17*** 2.32*** 3476 0.94*** 1.50***
Emergency Department visitsc 3504 0.05 0.24*** 3487 −0.001 0.06
Hospital admissionsd 3505 0.12*** 0.41*** 3481 0.10** 0.23***
Day case procedurese 3503 0.37*** 0.54*** 3485 0.30*** 0.41***
Nights spent in hospitalf 3504 0.54** 3.11*** 3485 0.30* 1.33***
* =p< 0.05, ** =p< 0.01, *** =p< 0.001
The independent variables entered into each service outcome model were: a
Frailty, disability, multimorbidity, physical health, emotional health, falls, age, gender, living arrangements, healthcare entitlement, education, household location b
Frailty, disability, multimorbidity, physical health, emotional health, falls, age, gender, healthcare entitlement, household location c
Frailty, disability, multimorbidity, physical health, emotional health, falls, age, gender d
Frailty, disability, multimorbidity, physical health, falls, age, gender, healthcare entitlement, household location e
Frailty, disability, multimorbidity, physical health, emotional health, age, gender, healthcare entitlement f
[image:9.595.58.538.554.664.2]than a global measure of health [33]. However, their study was not representative of the population aged≥65 in the United States but of a subsample of this age-group who had previously visited the ED and there are also differences between the classification of outpatient services in the studies making a comparison unsuitable.
Overall, the effect of frailty found in this study is inter-esting in the Irish context as a frailty classification is not currently used as a criterion in the service allocation process for older people. This validates the viewpoint that frailty can be subjectively identified in clinical prac-tice [59] as reflected in service allocation patterns identi-fied here. However, most of the frail older population fail to utilise social care services, which indicates a po-tential weakness in the targeting of these services in Irish long term care system, which has been discussed else-where [17]. These findings also raise questions about po-tential sub-groups of the frail older population who are failing to utilise these services which can be investigated within the TILDA database using person-centred analyt-ical techniques.
Study strengths and weaknesses
This study is limited by the cross-sectional design which allows the interpretation of associations rather than causation. Secondly, the impact of frailty on healthcare utilisation may be underestimated as this study does not include older people in convalescent care or inpatient hospital care who were excluded during the first wave of data collection. This limitation will be overcome in sub-sequent waves. Thirdly, this study used both the self-report dependent and self-self-report independent variables which raises an issue with common method variance [60], however this is counteracted with face-to-face com-puter aided interview technique and strong survey de-sign. Fourthly, the potential for measurement error in counting service utilisation events is well-recognised [61]. Specifically it is known that under-reporting of utilisation is exacerbated by increased utilisation [62]. While we acknowledge this potential limitation of our dependent variables, it must be remembered that surveys of this kind are the usual source of data for analyses of this type. Finally, factors associated with service utilisation such as the availability of services or distances to services were beyond the scope of this study and could therefore be considered a limitation. The strengths of this study in-clude the large sample size which is generalisable to the Irish population, a strong questionnaire design and data collection processes and the contribution of knowledge about frailty and service utilisation in Ireland.
Conclusion
This study has identified a sub-group of the older popu-lation, classified as frail according to their score on the
frailty index, who were identified as heavy-users of healthcare services. This frail sub-group use more of medical and social care services in comparison to those who are pre-frail or robust even after controlling for many factors known to drive service use. Frailty is clearly an important and useful concept of need captur-ing those older individuals who are users of many differ-ent services. Going forward, it will be important to develop strategies for integrated care targeted to support frail older people so that they can receive the right com-binations of services, in the right place at the right time which can support them to remain living in their own home. Key to informing such a strategy will be the iden-tification of sub-groups of the frail older population who are not accessing such supports and experiencing poor outcomes.
Additional files
Additional file 1:Details of dependent variables from the TILDA CAPI questionnaire. (DOCX 13 kb)
Additional file 2:Details of independent frailty variables operationalised in the TILDA database using CAPI and health assessment data. (DOCX 14 kb)
Additional file 3:Sensitivity analysis to compare how well each of the three frailty measures capture health care use. (DOCM 38 kb)
Abbreviations
ADL:Activities of Daily Living; ED: Emergency department; FI: Frailty index; GP: General practitioner; IADL: Instrumental Activities of Daily Living; OT: Occupational therapist; PHN: Public health nurse; TILDA: The Irish Longitudinal Study on Ageing
Acknowledgements
We are grateful to all of the TILDA respondents who participated in this study.
Funding
TILDA is funded by the Irish Government, The Atlantic Philanthropies and Irish Life PLC. This study was funded by the Health Research Board of Ireland under Grant No. PHD/2007/16, and the Irish Institute of Public Health, Division of Ageing Research and Development (formerly, Centre for Ageing Research and Development in Ireland- CARDI) under Grant No. LP3.
Availability of data and materials
Researchers interested in using TILDA data may access the data for free from the following sites: Irish Social Science Data Archive (ISSDA) at University College Dublin http://www.ucd.ie/issda/data/tilda/; Interuniversity Consortium for Political and Social Research (ICPSR) at the University of Michigan http://www.icpsr.umich.edu/icpsrweb/NACDA/studies/34315.
Authors’contributions
LR conceived the approach, led the writing and researching of quantitative data analysis and drafted the research paper. CN, JB, MAW, AOH inputted into the conceptual development and applicability of measures and contributed to drafts. All authors read and approved the final manuscript.
Ethics approval and consent to participate
could opt for this information to be given to their GP. In the course of the study, participants with undiagnosed atrial fibrillation were also informed and invited to a clinic for diagnosis.
Consent for publication
Not applicable
Competing interests
The authors declare that they have no competing interests.
Publisher’s Note
Springer Nature remains neutral with regard to jurisdictional claims in published maps and institutional affiliations.
Author details
1
Centre for Health Policy and Management, Trinity College Dublin, 3-4 Foster Place, College Green, Dublin 2, Ireland.2The Economic and Social Research
Institute, Whitaker Square, Sir John Rogerson’s Quay, Dublin 2, Ireland.
3Epidemiology & Public Health, University College Cork, College Road, Cork,
Ireland.4The Irish Longitudinal Study on Ageing, Trinity College Dublin, College Green, Dublin 2, Ireland.
Received: 13 April 2017 Accepted: 4 August 2017
References
1. Central Statistics Office. Life in 1916 Ireland: Stories from Statistics. Cork: Central Statistics Office; 2016.
2. Laatikainen T, et al. Explaining the decline in coronary heart disease mortality in Finland between 1982 and 1997. Am J Epidemiol. 2005;162(8): 764–73.
3. Prince MJ, et al. The burden of disease in older people and implications for health policy and practice. The Lancet. 2015;385(9967):549–62.
4. Marengoni A, et al. Aging with multimorbidity: a systematic review of the literature. Ageing Res Rev. 2011;10(4):430–9.
5. Rechel B, et al. Ageing in the European Union. Lancet. 2013;381(9874): 1312–22.
6. Mason B, et al.‘my body's falling apart.’understanding the experiences of patients with advanced multimorbidity to improve care: serial interviews with patients and carers. BMJ Support Palliat Care. 2016;6(1):60–5. 7. Bodenheimer T. Coordinating care–a perilous journey through the health
care system. N Engl J Med. 2008;358(10):1064–71.
8. Larragy J, Boyle M. Older people speak up: on health, social care and the future of healthcare financing in Ireland. Dublin: Older and Bolder; 2012. 9. Doyle M. Older peoples perception on services and activities in the Marino
and Fairview area: A participatory project. Dublin: Social Policy Ageing and Research Centre, Trinity College Dublin; 2007.
10. Banerjee S. Multimorbidity- older adults need health care that can count past one. Lancet. 2014;385(9968):587–9.
11. Stein V. Why integrated care? Conclusions from an international expert survey. Int J Integr Care. 2011;11(7):e110.
12. Calciolari S, Ilinca S. Lessons from international experiences: comparative case studies of integrated care in Europe and North America. Int J Integr Care. 2011;11(Suppl):e089.
13. World Health Organization. World report on ageing and health. Luxembourg: World Health Organisation; 2015.
14. Department of Health. Future health: a strategic framework for reform of the health service 2012–2015. Dublin: The Stationary Office; 2012. 15. Alderwick H, Ham C, Buck D. Population health systems: going beyond
integrated care. London: The Kings Fund; 2015.
16. Leutz W. Five laws for integrating medical and social services: lessons from the United States and the United Kingdom. Milbank Q. 1999;77(1):77–110. 17. Murphy C, Whelan B, Normand C. Formal home-care utilisation by older
adults in Ireland: evidence from the Irish longitudinal study on ageing (TILDA). Health Soc Care Community. 2014;23(4):408–18.
18. McDaid O. The chronic ills of multimorbidity: a cross sectional examination of the prevalence, patterns and factors associated with multimorbidity in the Irish population aged 50 and over and its corresponding impact on health and social care utilisation. Dublin: School of Medicine, Trinity College Dublin; 2013.
19. Clegg A, et al. Frailty in eldery people. Lancet. 2013;381(9868):752–62.
20. Fried LP, et al. Frailty in older adults: evidence for a phenotype. J Gerontol Biol Sci Med Sci. 2001;56(3):M146–56.
21. Collard RM, et al. Prevalence of frailty in community-dwelling older persons: a systematic review. J Am Geriatr Soc. 2012;60(8):1487–92.
22. Central Statistics Office, Population and Labour Force Projections 2016– 2046. Cork: Central Statistics Office; 2015.
23. Turner G, et al. Fit for frailty II: developing, commissioning, and managing services for people living with frailty in community settings: guidance for GPs, geriatricians, health service managers, social service managers and commissioners of services. UK: British Geriatrics Society and the Royal College of General Practitioners and AGE UK London; 2015.
24. Turner G, Clegg A, Youde J. Fit for frailty- consensus best practice guidance for the care of older people living in community and outpatient settings- a report from the British Geriatrics Society 2014. London: British Geriatrics Society; 2014. 25. Vellas B, Cestac P, Moley JE. Implementing frailty into clinical practice: we
cannot wait. J Nutr Health Ageing. 2012;16(7):599–600. 26. Akner G. Frailty and multimorbidity in elderly people: A shift in
management approach. Clin Geriatr. 2013;21(9):1–7.
27. Acosta M. Frailty in older persons. In: Kauffman T, Scott R, Barr J, Moran M, editors. A comprehensive guide to geriatric rehabilitation. 3rd ed. London: Churchill Livingstone Elsevier; 2014.
28. Béland F, Hollander M. Integrated models of care delivery for the frail elderly: international perspectives. Gac Sanit. 2011;2:138–46. 29. Hébert R, et al. Frail elderly patients. New model for integrated service
delivery. Can Fam Physician. 2003;49:992–7.
30. Hoeck S, et al. Health-care and home-care utilisation among frail elderly persons in Belgium. Eur J Pub Health. 2012;22(5):671–7.
31. Ilinca S, Calciolari S. The patterns of health care utilisation by elderly Europeans: frailty and its implications for health systems. Health Serv Res. 2015;50(1):305–20.
32. Rochat S, et al. Frailty and use of health and community services by community-dwelling older men: the concord health and ageing in men project. Age Ageing. 2010;39(2):228–33.
33. Hastings SN, et al. Frailty predicts some but not all adverse outcomes in older adults discharged from the emergency department. J Am Geriatr Soc. 2008;56(9):1651–7.
34. Woo J, et al. Public health significance of the frailty index. Disabil Rehabil. 2006;28(8):515–21.
35. Dent E, et al. Frailty and health service use in rural South Australia. Arch Geriatr Gerontol. 2016;62(2016):53–8.
36. Bandeen-Roche K, et al. Frailty in older adults: a nationally
representative profile in the United States. J Gerontol Biol Sci Med Sci. 2015;70(11):1427–34.
37. Khandelwal D, et al. Frailty is associated with longer hospital stay and increased mortality in hospitalized older patients. J Nutr Health Ageing. 2012;16(8):732–5.
38. Robinson TN, et al. Frailty predicts increased hospital and six-month healthcare cost following colorectal surgery in older adults. Am J Surg. 2011;202(5):511–4.
39. Theou O, et al. Identifying common characteristics of frailty across seven scales. J Am Geriatr Soc. 2014;62(5):901–6.
40. Bouillon K, et al. Measures of frailty in population-based studies: an overview. Biomed Cen Geriatr. 2013;13(64):1471–2318.
41. Sternberg SA, et al. The identification of frailty: a systematic literature review. J Am Geriatr Soc. 2011;59(11):2129–38.
42. Cigolle CT, et al. Comparing models of frailty: the health and retirement study. J Am Geriatr Soc. 2009;57(5):830–9.
43. van Iersel MB, Rikkert MG. Frailty criteria give heterogeneous results when applied in clinical practice. J Am Geriatr Soc. 2006;54(4):728–9.
44. Whelan B, Savva GM. Design and methodology of the TILDA study. J Am Geriatr Soc. 2013;61(2):S265–8.
45. Anderson RM. Revisiting the behavioural model and access to medical care: does it matter? J Health Soc Behav. 1995;36(1):1–10.
46. Rockwood K, et al. A global clinical measure of fitness and frailty in elderly people. Can Med Assoc J. 2005b;173(5):489–95.
47. Theou O, et al. Measuring frailty using self-report and test-based health measures. Age and ageing, 2015.
48. Peklar J, et al. Sedative load and frailty among community-dwelling population aged >/=65 years. J Am Med Dir Assoc. 2015;16(4):282–9. 49. Searle SD, et al. A standard procedure for creating a frailty index. Biomed
50. O'Halloran AM, et al. Sustained attention and frailty in the older adult population. J Gerontol Psychol Sci Soc Sci. 2014;69(2):147–56. 51. Scarlett S, et al. Frailty and disability in Ireland 2014, Centre for Ageing
Research and Development in Ireland.
52. Morley JE, Malmstrom TK, Miller DK. A simple frailty questionnaire (FRAIL) predicts outcomes in middle aged African Americans. J Nutr Health Ageing. 2012;16(7):601–8.
53. Katz S, et al. Studies of illness in the aged. The index of ADL: a standardised measure of biological and psychosocial function. J Am Med Assoc. 1963; 185:914–9.
54. Van Den Akker M, Buntinx F, Knottnerus J. Comorbidity or multimorbidity: what's in a name? A review of literature. Eur J Gen Pract. 1996;2:65–70. 55. Smith V, et al. A marginalized two-part model for semicontinuous data. Stat
Med. 2014;33(28):4891–903.
56. Layte R, Nolan A. Eligibility for free GP care and the utilisation of GP services by children in Ireland. Int J Health Econ Manag. 2015;15(1):3–27.
57. Sarma S, Simpson W. A microeconometric analysis of Canadian health care utilisation. J Health Econ. 2006;15(3):219–39.
58. McNamara A, Normand C, Whelan B. Patterns and determinants of healthcare utilisation in Ireland. Dublin: The Irish Longitudinal Study on Ageing; 2013.
59. Reynaud C, McHugh T, Romero-Ortuño R. Frailty: what does it mean for clinical care provision? Scott Univ Med J. 2014;3(1):54–64.
60. Podsakoff PM, et al. Common method biases in behavioral research: a critical review of the literature and recommended remedies. J Appl Psychol. 2003;88(5):879–903.
61. Hoeck S, et al. Healthcare utilisation among the Belgian elderly in relation to their socio-economic status. Health Policy. 2011;99(2):174–82.
62. Bhandari A, Wagner T. Self-reported utilisation of health care services: improving measurement and accuracy. Med Care Res Rev. 2006;63(2):217–35.
• We accept pre-submission inquiries
• Our selector tool helps you to find the most relevant journal
• We provide round the clock customer support
• Convenient online submission
• Thorough peer review
• Inclusion in PubMed and all major indexing services
• Maximum visibility for your research
Submit your manuscript at www.biomedcentral.com/submit