http://dx.doi.org/10.4236/ijmpcero.2015.41010
Performance Evaluation of a miniPET
Camera for Brain Scanning
Arif Mahmud1, Md. Moshiur Rahman2
1Department of Physics, BGMEA University of Fashion and Technology, Dhaka, Bangladesh 2Department of Physics, Jahangirnagar University, Dhaka, Bangladesh
Email: [email protected]
Received 20 January 2015; accepted 6 February 2015; published 12 February 2015
Copyright © 2015 by authors and Scientific Research Publishing Inc.
This work is licensed under the Creative Commons Attribution International License (CC BY). http://creativecommons.org/licenses/by/4.0/
Abstract
A nuclear miniPET camera was constructed with 2 bucket rings, each having 8 BGO detector mod-ules for brain scanning. After calibration of the camera, an experimental investigation of sensitiv-ity was carried out to evaluate the performance of this PET scanner. The characteristics of NECR were examined for comparisons of count rate considering the statistical noise due to scattered and random events. NECR performance was observed using 10 cm diameter phantom filled with 1 L water and 240 MBq of 18F. All data were acquired in 2D acquisition mode but without septa. Randoms were estimated by introducing delay into the coincidence circuit which was an extra 100 ns time delay. Multiples were recorded simultaneously with the prompt and delayed events. The true plus scattered coincidence events were calculated as the difference between prompt and random plus multiple events. After recording all the data, the noise equivalent count rate (NECR) was calculated and graphically presented. It is observed that NEC value is significantly lower than other similar scanners. Comparing the individual components of the count rate, a much higher randoms rate is observed for the camera because of the absence of any side shielding, so that out of field activity contributes significantly to the randoms rate and hence reduces the NECR value.
Keywords
PET, BGO, NECR, Prompt-Events, Detector-Module & Septa
1. Introduction
characteristics of PET/CT instrument, and it is used to measure the image quality. Higher the NEC value indi-cates better the PET image quality.
NEC is fairly straightforward to measure and has become a standard metric for scanner performance provided by manufacturers and determined as part of acceptance testing for new equipment. NEC is most frequently (or invariably, in the case of acceptance testing) computed using a standard test object. NEC rate is a global meas-ure of PET scanner count rate performance. It is used to understand the scanner performance under a wide range of imaging situations, and enables comparisons of count rate taking into account the statistical noise due to scat-tered and random events [3].
Currently the PET is available on the market, and both CT and PET are state of the art [4]. The CT scanner is in all cases a helical multi-slice system (from 2 up to 16 slices). The PET scanner is based on different crystal types [bismuth germinate (BGO)] and different detector architecture (blocks of detectors, continuous pixilated detectors). In the recent years, the PET scanner has received a deserving attention due to its important [5] role in the staging and restaging of cancer by showing the functional activity of neoplasms with respect to normal tis-sues. Very recently the characterisation of the physical (whole body) performance of the new integrated PET/CT system has been performed [6]. L R MacDonald et al. have measured count rates and scatter fraction on the dis-covery STE PET/CT scanner in different acquisition modes [7].
Count rate performance is evaluated by calculating the noise equivalent count rate (NECR). Due to scatter and randoms in the measured PET data, it is difficult to compare different scanners or the same system operating under different acquisition modes. The noise equivalent count rate is defined as the rate of true coincidences which would (in the absence of randoms and scatters) give rise to the same noise level in the data. Before the optimum use of a new system it is necessary to measure the scanner characteristics as a function of count rate. The general formula [8] [9] to calculate the NEC rate is,
2 T NEC
T S kR
=
+ + (1)
where T, S and R are the true, scatter and random rates respectively. The parameter k is the randoms correction factor with a value of 1 or 2 depending on the randoms correction method. The value k = 1 is used when the randoms contribution is estimated from the singles count rates. A value of 2 is used when randoms are measured using a delayed coincidence window, as in the present work, to account for the additional noise due to the sub-traction. In the work, true, scatter and random events were measured aiming to test the camera NECR characte-ristics by taking into account the statistical noise. After designing a PET camera, it is necessary to measure its various characteristics performance.
2. Materials and Method
A miniPET camera with a field of view (FOV) of 20 cm was constructed using 16 BGO detector modules (“buckets”) arranged in two rings. Four blocks, each block (4 PMTs plus crystal matrix) having 64 distinct crys-tal elements, together with the associated readout electronics comprise one detector module. The camera, a 16 ring tomography having 4096 individual crystal detectors, was operated in 2D mode with maximum ring differ-ence 3 but without septa [10]. All data were acquired in 2D mode (ring difference ≤ 3) but without septa. To
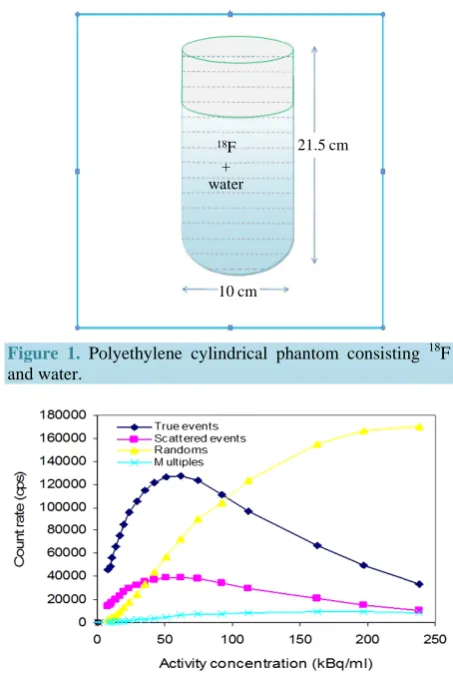
measure the noise equivalent count rate of the system, a 10 cm diameter polyethylene cylindrical phantom was considered shown in Figure 1. The phantom was filled with 1000 ml water and mixed with 18F having radioac-tivity 240 MBq. The cylinder was shaken to uniformly mix the 18F radio isotope into the water. Then the phan-tom placed at the centre of the scanner. A set of 300 seconds scans was acquired every half hour. These scans were continued for almost 16 hrs.
3. Results
The various components of the count rate (true, scatter, random and multiple events) obtained using the 10 cm diameter cylindrical phantoms are shown inFigure 2.
[image:3.595.198.425.182.524.2]Figure 3shows the Noise Equivalent Count (NEC) curves for the camera. The NEC peaks at about 60.5 kcps at 35 kBq/ml. Our NEC values are significantly lower than those of [13], who obtained NEC values for their small ring system which peaked at about 180 kcps. In 3D mode the peak value occurred at around 25 kBq/ml, whereas in 2D (high sensitivity) mode the peak occurred at 200 kBq/ml.
[image:3.595.204.424.568.695.2]Figure 1. Polyethylene cylindrical phantom consisting 18F and water.
Figure 2. The behavior of various components of the count rate performance for a 10 cm diameter phantom filled with 1000 ml water containing an initial activity 240 MBq of 18F.
Figure 3. NEC rate for a 10 cm diameter phantom filled with 1000 ml Water containing an initial activity 240 MBq of 18F.
21.5 cm
10 cm water
18F
Comparing the individual components of the count rate, the major difference between the camera results and those described by [13] is that a much higher randoms rate is observed for the PET system. This is due to the absence of any side shielding in the miniPET geometry, so that out of field activity contributes significantly to the randoms rate and hence reduces the NEC rate.
4. Discussion
Noise equivalent count rate is the most important characteristics of a PET machine to determine the PET scanner quality. It is common metric to evaluate the count rate performance of a PET system. It was not clear whether there is a direct correlation between the NEC and the image noise and image quality, especially in situations where there is a significant contribution of scatter and randoms, originating from activity outside the scanner FOV. This study was therefore to investigate the correlation between NEC and activity under a variety of scan-ning conditions.
The measured scattered fraction is 20.6% [12] of a 10 cm diameter phantom which is slightly lower than re-ported for a scanner of similar geometry operating in 3D mode without septa. The NEC peak rate is 60.5 kcps at 35 kBq/ml. This is significantly lower than reported for a similar scanner, principally because the lack of side shielding results in a very large contribution of randoms due to out of field activity. The scatter fraction is not representative of a realistic body size. However, it is useful for standard evaluations among scanners of different configurations.
It is important in comparing performance between scanners to look both at the peak true and NEC counting rates and at the activity levels where these peak rates occur. A highly sensitive system may saturate at a rela-tively low activity level, but the counting rate at this level may be higher than that of a system with lower sensi-tivity at a higher acsensi-tivity level.
Activity outside the field of view was greatly affects the count rate performance, especially the scatter com-ponent, of the scanner as well as the spatial resolution. The random coincidence counts were mostly affected by the dead time of the system detector. However, the calculated random events continued to increase then their in-crease slows. This is due to the inin-creased dead time of the system detector because of the more activity, and hence more counts, introduced. Each undetected event will only increase the dead time and therefore, some random counts will be lost.
The peak NEC value is a strong function of scanner geometry and scintillator material, scatter fraction, sys-tem dead time and random coincidence fraction. The scatter fraction depends mainly on the low level discrimi-nator setting of the system and size of the imaging object. Access to time-of-flight information may have a strong impact on the signal-to-noise properties and hence on the NEC performance.
The method under the NECR experiment can be used for analyzing clinical positron emission tomography (PET) count rate performance that involves matching net trues (prompts—delayeds) and randoms (delayeds) count rate responses measured on a reference phantom to the actual patient data. We employ these estimated re-sponse curves to compute a performance metric closely related to the noise equivalent count rate, as a function of the singles rate in the system. From this we can determine the peak performance value relative to the meas-ured performance for any individual coincidence event.
The experiments presented in this study indicate that the NEC as defined in Equation (1) is closely correlated to the radioactivity. This implies that the use of NEC is not only a measure to compare the count rate perfor-mance of imaging systems, but this measure also translate into a measure for comparing image noise, provided the same reconstruction parameters are used. Noise equivalent count rate is the most important characteristics of a PET machine to determine the PET scanner quality.
5. Conclusion
References
[1] Das, C., Kumar, R., Balakrishnan, V.B., Chawla, M. and Malhotra, A. (2008) Disseminated Tuberculosis Masquerad-ing as Metastatic Breast Carcinoma on PET-CT. Clinical Nuclear Medicine, 33, 359-361.
http://dx.doi.org/10.1097/RLU.0b013e31816a858e
[2] Parker, D.J. and McNeil, P.A. (1996) Positron Emission Tomography for Process Applications. Measurement Science and Technology, 7, 287-296. http://dx.doi.org/10.1088/0957-0233/7/3/009
[3] Smith, R.J. and Karp, J.S. (1996) A Practical Method for Randoms Subtractions in Volume Imaging PET from Detec-tor Singles Count Rate Measurements. IEEE Transactions on Nuclear Science, 43, 1981-1987.
http://dx.doi.org/10.1109/23.507257
[4] Humm, J.L., Rosenfeld, A. and Del Guerra, A. (2003) From PET Detectors to PET Scanners. European Journal of Nuclear Medicine and Molecular Imaging, 30, 1574-1597. http://dx.doi.org/10.1007/s00259-003-1266-2
[5] Jerusalem, G., Hustinx, R., Beguin, Y. and Fillet, G. (2003) PET Scan Imaging in Oncology. European Journal of Cancer, 39, 1525-1534. http://dx.doi.org/10.1016/S0959-8049(03)00374-5
[6] Bettinardi, V., Danna, M., Savi, A., Lecchi, M., Castiglioni, I., Gilardi, M.C., Bammer, H., Lucignani, G. and Fazio, F. (2004) Performance Evaluation of the New Whole-Body PET/CT Scanner: Discovery ST. European Journal of Nuc-lear Medicine and Molecular Imaging, 31, 867-881. http://dx.doi.org/10.1007/s00259-003-1444-2
[7] MacDonald, L.R., Schmitz, R.E., Alessio, A.M., Wollenweber, S.D., Stearns, C.W., Ganin, A., Harrison, R.L., Lewel-len, T.K. and Kinahan, P.E. (2008) Measured Count Rate Performance of the Discovery STE PET/CT Scanner in 2D, 3D and Partial Collimation Acquisition Modes. Physics in Medicine and Biology, 53, 3723-3738.
http://dx.doi.org/10.1088/0031-9155/53/14/002
[8] Strother, S.C., Casey, M.E. and Hoffmann, E.J. (1990) Measuring PET Scanner Sensitivity: Relating Count Rates to Image Signal-to-Noise Ratios Using Noise Equivalent Counts.IEEE Transactions on Nuclear Science, 37, 783-788.
http://dx.doi.org/10.1109/23.106715
[9] Schulthess, G.K.V. (2006) Molecular Anatomic Imaging: PET-CT and SPECT-CT Integrating Modality Imaging. 2nd Edition, Lippincott Williams & Wilkins,Philadelphia, Ch. 5, 41.
[10] Turkington, T.G. (2001) Introduction to PET Instrumentation. Journal of Nuclear Medicine Technology, 29, 4-11.
[11] Ahasan, M.M. (2009) Design and Initial Performance Absent of a Prototype Large Ring PET Scanner (macroPET). Ph.D. Thesis, The University of Birmingham, Birmingham.
[12] Ahasan, M.M. (2011) Evaluation of Scatter Fraction (SF) of a 16-Ring Positron Emission Tomography (PET) System. Bangladesh Journal of Medical Physics, 4, 81-86.