© 2017, IRJET | Impact Factor value: 5.181 | ISO 9001:2008 Certified Journal | Page 970
Implementation of Enhanced New Stable Election Protocol- ENHSEP in
NS2 Platform
Ananda M P
1, Dr. Devaraju R
21
PG student, Department of telecommunication, DSCE, Karnataka, India
2
Associate professor, Department of telecommunication, DSCE, Karnataka, India
---***---Abstract -
Among many wireless technology
wireless sensor network place a prominent place
in the present world and also in future because of
its application in almost all the fields. In order to
achieve a network with better efficiency many
routing protocols are proposed for the
communication among cluster node in WSN. The
protocols are proposed in such a way that it has to
satisfy all the aims of the design of the protocol
such as energy efficiency, minimum energy
consumption, increase of network lifetime,
reducing packet drop, increase in throughput and
etc. the existing routing algorithm such as LEACH,
SEP has their own disadvantages especially in
terms of energy consumption and network
lifetime. Exploration of existing routing protocols
may leads to the development of new protocols
which are there for improving the existing
wireless sensor network. This paper particularly
contains the exploration of new hierarchical stable
election protocol and development of new routing
protocol called ENHSEP. The results obtained from
NS2 are shown in this paper and those results are
compared with the results of LEACH and NHSEP.
The comparison is done in terms of their
performances such as throughput, energy and
packet delivery ratio and packet drop. The graphs
of comparison show that the performance of
ENHSEP is far better than that of NHSEP. This
paper describes the development methodology of
the ENHSEP and further enhancement of this
protocol.
Key Words:
WSN, LEACH, SEP, Clustering, Cluster
head.
1.
INTRODUCTION
1A wireless sensor network is a wireless network which consists of spatially distributed sensors over a large field in order to monitor the environmental conditions such as temperature, humidity, moisture content, vehicular movement and so on. All the wireless sensor networks have a certain lifetime during which nodes have limited energy, by using that energy the nodes collect the information from different nodes of the network, process it and transmit to the destination. Hence the network should be built in such a way that it is extremely energy efficient. The life time of network depends on the energy usage by all the nodes in a network. The network should reduce the energy dissipation and it should be resistive to the node failures, fault tolerant and scalable in order to maximize system lifetime.
© 2017, IRJET | Impact Factor value: 5.181 | ISO 9001:2008 Certified Journal | Page 971
WSN the sensors are organized clusters by themselves andeach cluster consist of header. The main function of cluster head is to provide data communication between sensor nodes and the base station efficiently. The heterogeneous nature of WSN increases the lifetime of WSN where heterogeneous nature refers to a network consists of sensor nodes with different characteristics such as sensing range, power consumption, data transmission and so on. There are two types of clustering techniques such as homogeneous clustering and heterogeneous clustering. Heterogeneous clustering is the type of clustering performed in heterogeneous network whereas homogeneous clustering is the clustering performed in homogeneous network.
The sensors in the network are classified into 3 categories such as physical sensor, chemical sensor and biological sensor. The sensors used for temperature, moisture content, flow rate, flow velocity, pressure and light transmission are categorized into physical sensor. The sensors used to sense dissolved oxygen, electrical conductivity, pH, oxidation reduction potential, major ionic species, nutrientsa, heavy metals, small organic compounds, large organic compounds are categorized into chemical sensors. Sensors used to sense microorganisms, biologically active contaminants are categorized into biological sensor.
Following are the characteristics of sensor node which is used to evaluate the performance of wireless sensor network.
1. Fault tolerance: Usually break occurs in WSN due to sensor node failures. Fault tolerance is the ability to keep the functionalities of wireless sensor network working correctly without any break.
2. Mobility of nodes: It refers to the movement of the nodes within the field of network which will increase the efficiency of communication.
3. Dynamic network topology: There are some standard topologies for the connection between sensor nodes in the network. The WSN must be in a position of working in dynamic topology.
4. Communication failures: whenever there is a failure in communication between the nodes in the network, the failure should be informed to the base station or gateway immediately without any delay.
5. Heterogeneity of nodes: When the characteristics of sensor nodes are heterogeneous in nature then these sensor nodes are required to work in a cooperative manner.
6. Scalability: In WSN the number of sensor nodes used in the network should be countable that is they can be in the order of hundreds or thousands. Hence WSN is designed in such a way that it should be highly scalable.
7. Independency: The capacity of WSN to work without depending on any central control point is considered while evaluating the performance of WSN.
8. Programmability: Reprogramming or reconfiguring of WSN to make it adaptive for the dynamic changes in the network is one of the essential features of WSN.
9. Utilization of sensors: The efficient use of sensor nodes in order to make network performance more efficient with less energy.
Network coverage, efficiency in terms of system lifetime, node coverage, effortless deployment, data accuracy, system response time, fault tolerance, scalability, network throughput, sample rate, security, the cost of the network and network architecture used are the matrices used to measure the performance of WSN . The evaluation of each sensor node in WSN is done using its flexibility, robustness, computation, communication, security, synchronization, node size and cost.
1.
BASIC STRUCTURE OF WSN
Figure1: Basic structure of WSN
Following are the components of WSN explained below.
© 2017, IRJET | Impact Factor value: 5.181 | ISO 9001:2008 Certified Journal | Page 972
Relay node: A relay node is the node which is intended toincrease the reliability of the network. It can be considered as the mediator between the two communicating nodes in the network. It is a special type device which does not contain any processor or control equipment and does not interfere with process itself.
Actor node: According to the requirement of application actor nodes takes decision. It is the node at higher end with better characteristics such as better processing capabilities, greater transmission power and high battery life hence they can be called as resource rich devices.
Cluster head: It is a special node performing data collection from different cluster node and aggregating them into meaningful information. Then the aggregated information is send to the destination that is base station. This node is considered as highly reliable and secure node in the cluster. This node is trusted by all the cluster nodes for its security.
Gateway: The interface between the WSN and the outside network is called gateway. Compared to other sensor nodes in the network gateway node is the most powerful node in terms of programming, data memory, processor, expansion of memory.
Base station: An extraordinary node in the network which is the destination of the WSN having high computational energy and processing capacity.
2.
PROBLEM FORMULATION
In hierarchical networks, protocol like Low-energy Adaptive Clustering Hierarchy (LEACH) and Stable Election Protocol (SEP) choose a cluster heads in random manner, as a result of random selection of cluster head, the probability of selecting a node with lower energy as a cluster head is more. When these networks chooses the lower energy node as cluster head the faults will be higher and these network divide the cluster in non symmetric manner. This leads to a Problem where the distribution of nodes among the clusters will be uneven that is nodes in some cluster will be high and in some cluster will have less. This problem leads to the development of efficient protocols.
3.
OBJECTIVE AND MOTIVATION
The main objective of this project is to enhance the existing routing protocol like LEACH, SEP so as to obtain an efficient protocol for routing the signal to
increase the lifetime of the sensor network and a less energy consumption. The developed protocol in this project is enhanced homogeneous new hierarchical stable election protocol.
When one look at the existing system of wireless sensor network, the existing routing protocols such as LEACH and SEP their disadvantages such as hacking of network, comparatively low speed of communication, distraction by various elements, costlier when the area is large, lifetime of nodes is relatively less, not energy efficient. These are the disadvantages which are motivated for the development of new routing protocols which are energy efficient and overcome from the disadvantages mentioned above.
4.
SCOPE OF THE PROJECT
Wireless sensor network is very interesting and multidisciplinary system which can be applicable for almost all the fields. It produces powerful and cost effective device which can be used in many applications such as under water or acoustic sensor system, cyber physical system, healthcare and many other area where the monitoring is the main concern. The routing protocol developed in this project has its scope in many fields at present world and also in future.
Following are some of the fields where the project places a vital role in present and future world.
5.
PROPOSED SYSTEM
© 2017, IRJET | Impact Factor value: 5.181 | ISO 9001:2008 Certified Journal | Page 973
To determine characteristic of all the nodes in the networkFor example to calculate characteristic (coordinates) of node D, Assume that characteristic of sink=(X1 ,Y1), Node
A=(X2,Y2 ) and Node B =(X3,Y3)
To calculate the distance of node D that has distance from sink, Node A, Node B are certain quantities respectively as a, b, c.
Assume characteristic of node D is D = (X4 ,Y4). The
distance of node D from sink, Node A and Node B are given by equation 1,equation 2 and equation 3 respectively.
|D-Sink|2 = (X4 –X1)2 + (Y4 –Y1)2 = a2………….(1)
(X4 –X2)2 + (Y4 –Y2)2 = b………….(2)
(X4 –X3)2 + (Y4 –Y3)2 = c2 ………….(3)
X4Ꞌ= …….(4)
Y4Ꞌ= …….(5)
By putting value of X4 in equation 1 and setting value of Y4 results in a second degree equation, solving that equation creates two points, by substituting those two points in equation1 gives two correct Points as an answer. The same calculation will be repeated for all the nodes in a sink and the results will be stored in table. By using these information the distance of every node from each other in the cluster will be calculated and saved to the same table. Considering the area and number of sensors the network is divided into two equal parts each part forms a cluster. When a node lies in both clusters, some conditions has to be assumed to bring a node to a any one of the clusters. And the three conditions assumed are: I-If sensor is coming in horizontal line, assumed it member of bottom square. 2-If it coming in vertical line, we assumed it member of left square. 3-If it coming in both vertical and horizontal lines it member of left bottom square. All the available sensors will be part of either of any squares (clusters) and for each square the cluster head will be selected.
Probability of cluster head = …………. (5)
Where =
Where n = number of cluster node
= Node.
= average distance with other cluster nodes.
=Remaining energy.
6.
DESIGN PROCEDURE
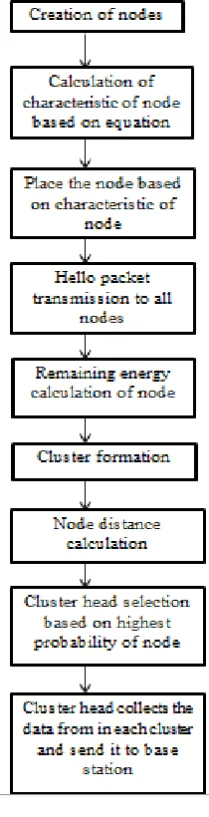
Following are the steps to be .followed in the development of energy efficient routing protocol
Step 1: Creation of nodes: Involves the creation of 50 nodes to form a wireless sensor network.
Step 2: Calculation of characteristic of node based on the equation given above.
Step 3: Place the node based on characteristic of node. Nodes with similar character place to same cluster.
Step 4: Hello packet transmission to all the nodes.
Step 5: Calculation of remaining energy of all the nodes.
Step 6: Cluster formation
Step 7: Node distance calculation
Step 8: Cluster head selection based on remaining energy and highest probability of node.
Step 9: Cluster head collects information from different nodes of the network.
Step 10: sending the collected information to the base station.
7.1 FLOW DIAGRAM
© 2017, IRJET | Impact Factor value: 5.181 | ISO 9001:2008 Certified Journal | Page 974
Figure 2: Flow diagram7.
EXISTING ROUTING PROTOCOLS
This section describes the existing routing protocols such as LEACH and SEP
8.1 LEACH
LEACH stands for low energy adaptive clustering hierarchy. Low Energy Adaptive Clustering Hierarchical Protocol is the primitive protocol that uses the hierarchical routing for WSN to increase the life time of network. The main concept is that data to be sent from all nodes in the network to destination node. The nodes in the network are grouped to form a cluster. Data can be sent by selecting one node as a cluster head it receives the cluster information from all nodes, signal process all the data and send it to remote base station. Being a Cluster head it has to be more energy efficient than all other non-cluster head
nodes. When Cluster head dies the communication will break down. So the selection of cluster head is more important [1].
LEACH incorporates the round robin condition that select the Cluster head in randomized rotation of nodes and Cluster head selection will be continuously changing in a cluster. The energy is evenly assigned to all the nodes in the network. Since the Cluster-head node knows all the information about all cluster members in the cluster. It can create a TDMA (Time Division Multiple Access) schedule, that tells each node exactly when to transmit its data.
8.2 SEP
SEP protocol mainly defined for Heterogeneous Network. In Heterogeneous network, two different energy levels are assigned to the nodes. So the Probability of choosing Cluster head with higher energy level is selected in all the rotations again and again which causes the failure of that higher energy level node in the network. To become Cluster head in SEP Protocol it uses weighted election probabilities of each node according to that it calculates the remaining energy of each node in the network. In Heterogeneous wireless sensor networks researchers found many challenging issues including the limited energy, efficient usage of the energy and the problem with hierarchy of the network as imbalance network [2].
The SEP protocol was improved version of LEACH protocol. The operation of SEP and LEACH Protocols is similar, the only difference is that in SEP protocol sensors have two different energy level.[3] Hence SEP protocol is not homogeneous while the NHSEP Protocol mainly defined for the homogeneous network where all the nodes in the network are assigned with same energy level. In SEP protocol some sensors have high energy therefore probability of these sensors as cluster head will be high. Position and base energy level are not chosen in the SEP and LEACH. This is major problem in these two protocols so they have static operation [4].
© 2017, IRJET | Impact Factor value: 5.181 | ISO 9001:2008 Certified Journal | Page 975
8.
HOMOGENEOUS NEW HIERARCHICAL STABLE
ELECTION PROTOCOL
• The base station (BS) is located far from the sensors and immobile.
• All nodes in the network are homogenous and energy-constrained.
• All nodes are able to send data to BS.
• The BS has the information about the location of each node.
• Cluster-heads (CHs) perform data reception, compression and transmission.
• At the start energy of all nodes is at the maximum level. • In the first round, each node has a probability p of becoming the cluster head.
• A node which has become cluster head shall be eligible to become cluster head after 1/p rounds.
• Assume 65 nodes in the network.
• Each node has same energy Emax and consumes equal energy for transmission and reception.
• Nodes in the network are not dynamic while the Cluster Heads (CHs) are being selected.
9.
RESULTS
[image:6.595.308.564.203.396.2]The results are obtained in NAM window using NS2 simulator. The design procedure of the project is discussed in the previous chapters. The results obtained after and before enhancement is shown as follows
Figure 3: Clustering in SEP and LEACH protocol
The above Figure 3 shows the clustering in SEP and LEACH protocol, where the clustering is done randomly which gives rise to disadvantages such as improper formation of cluster, choosing a false node as a cluster head and some of the nodes fall under two or more clusters which results in more power consumption intern reduces the lifetime of the network.
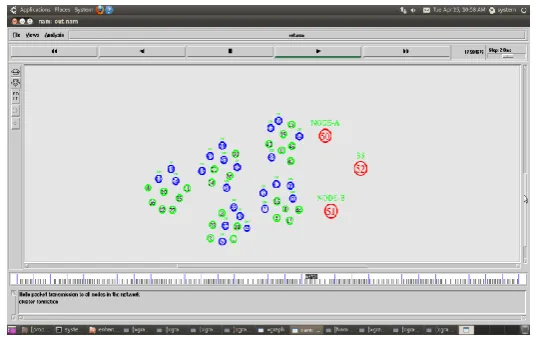
[image:6.595.204.551.533.712.2]10.1
SIMULATION RESULTS OF NHSEP
Figure 4: Clustering in NHSEP
[image:6.595.51.458.550.728.2]The above Figure 4 represents the clustering in NHSEP where the inclusion of nodes into cluster follows a different idea. Whenever the node lies in a horizontal line that node will included to the bottom square, when the node lies in a vertical line that node will included to left square and when the node lies in both vertical and horizontal line the node will put into left bottom square.
Figure 5: Cluster head formation in NHSEP
© 2017, IRJET | Impact Factor value: 5.181 | ISO 9001:2008 Certified Journal | Page 976
cluster is compared and the node with highest energy is [image:7.595.36.295.136.297.2]chosen as a cluster head.
Figure 6: Packet transmission from cluster members to cluster head in NHSEP
The simulation results of NHSEP are as shown in the above figures. Figure 3, Figure 4, Figure 5 represents clustering, cluster head formation and cluster communication in NHSEP respectively.
The communication among the nodes within the cluster is called intra cluster communication and the communication between cluster head and the base station is called intra cluster communication.
The disadvantages of NHSEP such as more packet drop, poor throughput and delay can be resolved in ENHSEP which is the enhancement of NHSEP implemented in homogeneous network.
10.2
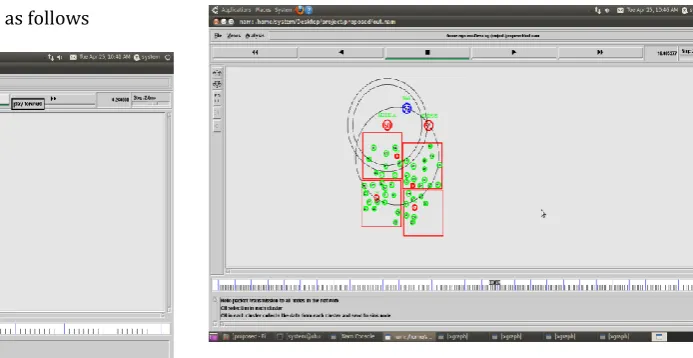
SIMULATION RESULTS OF ENHSEP
Figure 7: Clustering in ENHSEP
[image:7.595.305.572.201.370.2]The above Figure 7 represents clustering in ENHSEP where the clustering is done by considering the distance of sensor nodes from the base station. In ENHSEP the nodes which are near to the base station put into the cluster near to the base station and the nodes which are far away from the cluster put into the cluster which is far away from the base station.
Figure 8: Formation of active nodes
[image:7.595.35.571.545.733.2]The above Figure 8 represents formation of active nodes in the cluster. Average energy of all the nodes in the network is calculated. After that hello packet is transmitted from each node to the base station. After the transmission is completed energy of the entire node in the network is recalculated. The nodes having energy more than the average energy is selected as a active nodes. Nodes in blue colour represent the active node. Not all the nodes in a cluster involved in communication but the active nodes.
© 2017, IRJET | Impact Factor value: 5.181 | ISO 9001:2008 Certified Journal | Page 977
The above Figure 9 represents the formation of [image:8.595.36.298.201.377.2]cluster head in ENHSEP. The energy of all the nodes in the cluster compared and the node with highest energy among the active nodes is selected as a cluster head. This cluster head is responsible for the transmission of collected information to the base station. The nodes in red colour represent cluster head.
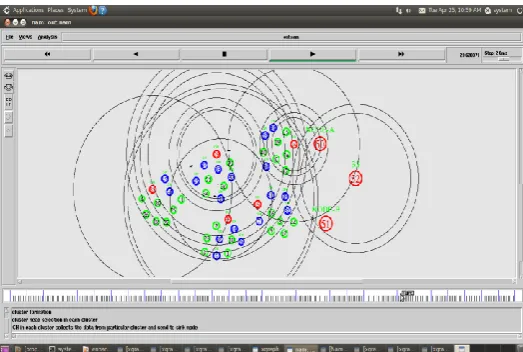
Figure 10: Intra cluster and Inter cluster communication
The above Figure 10 represents the communication in the network. The communication occurs between the clusters and also within the clusters called as inter cluster communication and intra cluster communication respectively. Whenever the distance of the cluster head is too far from the base station in order minimize the energy utilization it communicate and forward the collected information to the cluster haed nearer to the base station which take care of that information and transmit to the base station. Hence the chances of packet drop reduces which reduces the time requirement for transmission which inturn reduces the energy consumption. Hence the protocol became energy efficient.
10.
PERFORMANCE AND COMPARISON OF NHSEP
AND ENHSEP
The performance parameters such as energy, packet drop, throughput, packet delivery ratio is done in NS2 and are represented in graph shown below. Comparison between NHSEP and ENHSEP is done by considering the above mentioned parameters. This chapter contains performance of NHSEP and ENHSEP and their performance is compared then represented in graph.
11.1 THROUGHPUT
Generally throughput is defined as the maximum rate at which anything can be processed. With respect to communication throughput ids defined as the rate of delivery of messages to the destination successfully over a communication channel. Throughput is generally measured as bits per second and some times it is represented as packets per second. More the throughput more will be efficiency in the network.
Throughput = number of successful delivery of packets/sec
11.2 ENERGY
In wireless sensor network energy is the most prominent factor. To carry out any function in WSN energy is utilized. As time goes the energy will decrease. Once the energy is exhausted network will fail. Retaining of energy for long period of time is the challenge in WSN. The energy retained with respect to time is measured and represented as graph. The energy retained in NHSEP and ENHSEP with respect to time is described in this chapter as a graph.
11.3 PACKET DELIVERY RATIO
It is defined as the ratio of received packets in the destination to the generated packets at the source. For ideal WSN PDR is equal to 1. In practice an efficient WSN should have PDR very much equal to 1. Whenever the packet drop in the network is high, the packet delivery ration decreases and becomes very much less than 1. Hence packet drop should be as less as possible.
Packet delivery ratio=
11.4 PACKET DROP
© 2017, IRJET | Impact Factor value: 5.181 | ISO 9001:2008 Certified Journal | Page 978
12. COMPARISON BETWEEN NHSEP AND ENHSEP
Figure 11: Comparison of throughput
The above Figure 11 shows the comparison of the throughput between NHSEP and ENHSEP where the Y-axis represents the successful delivery of packets in Kb/s and X-axis represents the time. The performance throughput value for ENHSEP is greater than the NHSEP.
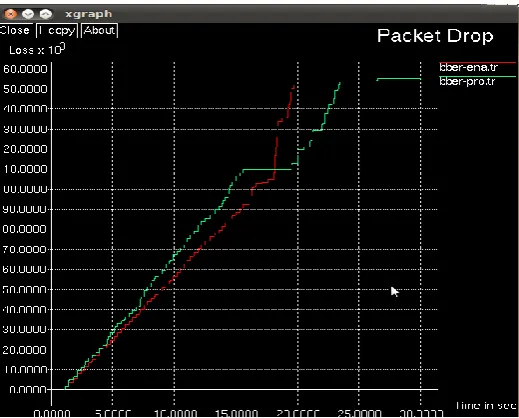
Figure 12: Comparison of packet drop.
The above Figure 12 shows the comparison of the Packet drop between ENHSEP and NHSEP. Where the Y-axis represents the packet drop in Loss x 103 and X-axis
[image:9.595.36.296.123.329.2]represents the time in sec. the packet drop of the ENHSEP is less when compare to the NHSEP will be shown in graph.
Figure 13: Comparison of packet delivery ratio
The above Figure 13 shows the comparison packet delivery ratio between the ENHSEP and NHSEP. Where the Y-axis represents the value of packet delivery ratio in PDR x 10-3 and X-axis represents the time in sec. We can see
that at the end of the time factor the PDR value of ENHSEP is higher than the NHSEP.
13.
CONCLUSION AND FUTURE SCOPE
In this project the clustering is done symmetrically using distance criteria which gives better results compare to NHSEP and simulation of New Hierarchical Stable Election Protocol (NHSEP) and Enhanced-NHSEP protocols is carried out using NS2. Result shows that Enhanced-NHSEP protocol has better performance in the parameters Energy Consumed, Energy Remaining, Packet Delivery Fraction, End to End Delay and Dead Nodes comparison with NHSEP protocol. The average energy of the cluster is calculated and after defining the active nodes the node having higher energy is selected as CH. The speed of communication increases because of inter and intra cluster communication. Enhanced-NHSEP Protocol gives better performance compare with NHSEP protocol. SEP and LEACH protocol creates non uniform cluster area they does not define how cluster head is chosen and how clusters are formed. By considering all the parameters the NHSEP protocol is enhanced and develops a protocol in homogeneous network results are compared with NHSEP.
[image:9.595.39.299.439.648.2]© 2017, IRJET | Impact Factor value: 5.181 | ISO 9001:2008 Certified Journal | Page 979
have packet drops while transmission of data, Packetdrops are still reducible.
In this project simulation of Low Energy Adaptive Clustering Hierarchy (LEACH), Stable Election Protocol (SEP) and New Hierarchical Stable Election Protocol (NHSEP) protocols is simulated using NS2. Result shows that NHSEP protocol has better performance in the parameters Energy Consumed, Energy Remaining, Packet Delivery Fraction, End to End Delay and Dead Nodes comparison with LEACH and SEP protocol. The number of nodes and speed increases. NHSEP Protocol gives better performance compare with LEACH and SEP protocols. SEP and NHSEP protocol creates non uniform cluster area. By considering all the parameters the NHSEP protocol is enhanced and develops a protocol in homogeneous network results are compared with NHSEP.
REFERENCE
[1] Laveena Mahajan,Narinder Sharma "Improving the
Stable Period of WSN using Dynamic Stable Leach Election Protocol" 2014.[2] Shio Kumar Singh , M P Singh , and D K Singh “Energy Efficient Homogenous Clustering Algorithm for Wireless Sensor Networks” 2010
[3]Arafat Abu Malluh, Khaled M. Elleithy, ZakariyaQawaqneh, Ramadhan J. Mstafa, AdwanAlanazi "EM-SEP: An Efficient Modified Stable Election Protocol", Proceedings of 2014.
[4]Dahlila P. Dahnil,Yaswant P. Singh, Chin Kuan Ho "Energy-Efficient Cluster Formation in Heterogeneous Wireless Sensor Networks: A Comparative Study" ICACT2011, pp no. 746-751, Feb. 13-16,2011.
[5] Simranjit Singh, Kanwaljit Singh, "Energy Efficient Election Probability and Cluster Head Selection for Enhancement of SEP-E in Wireless Sensor Networks", 2013.
[6]D.P.Dahnil, Y.P.Singh, C.K.Ho, "Analysis of adaptive clustering algorithms in Wireless Sensor Networks", IEEE Conference on Communication Systems, Nov 20l0.
[7] Laveena Mahajan,Narinder Sharma "Improving the Stable Period of WSN using Dynamic Stable Leach Election Protocol" 2014.
[8] Arafat Abu Malluh, Khaled M. Elleithy, ZakariyaQawaqneh, Ramadhan J. Mstafa, Adwan Alanazi "EM-SEP: An Efficient Modified Stable Election Protocol", Proceedings of 2014.
[9]Dahlila P. Dahnil,Yaswant P. Singh, Chin Kuan Ho "Energy-Efficient Cluster Formation in Heterogeneous Wireless Sensor Networks: A Comparative Study" ICACT2011, pp no. 746-751, Feb. 13-16,2011.
[10] Simranjit Singh, Kanwaljit Singh, "Energy Efficient Election Probability and Cluster Head Selection for Enhancement of SEP-E in Wireless Sensor Networks", 2013.
[11]D.P.Dahnil, Y.P.Singh, C.K.Ho, "Analysis of adaptive clustering algorithms in Wireless Sensor Networks", IEEE Conference on Communication Systems, Nov 20l0.
[12] Laveena Mahajan, Narinder Sharma "Improving the Stable Period of WSN using Dynamic Stable Leach Election Protocol" 2014.
[13] Arafat Abu Malluh, Khaled M. Elleithy,
ZakariyaQawaqneh, Ramadhan J. Mstafa, Adwan Alanazi "EM-SEP: An Efficient Modified Stable Election Protocol", Proceedings of 2014.
[14]Dahlila P. Dahnil, Yaswant P. Singh, Chin Kuan Ho "Energy-Efficient Cluster Formation in Heterogeneous Wireless Sensor Networks: A Comparative Study" ICACT2011, pp no. 746-751, Feb. 13-16, 2011.
[15] Simranjit Singh, Kanwaljit Singh, "Energy Efficient Election Probability and Cluster Head Selection for Enhancement of SEP-E in Wireless Sensor Networks", 2013.