FEATURE SELECTION FOR EFFICIENT ECONOMIC DATA ANALYTICS
Prof. Priyadarshani kalokhe
1Ms.Deepthi Mogaparthi
2Ms.Pooja Shedutkar
3Ms.Poonam Patil
4Ms.Sharda Tenginkai
51
Professor,Dept. Of computer Engineering, Alard College Of Engineering, Maharashtra, India
2,3,4,5
Student,Dept. Of computer Engineering, Alard College Of Engineering, Maharashtra, India
---***---
Abstract
-
With the expeditiously increasing popularity ofeconomic activities, a enormous amount of economic data is being collected. Although such data offers excellent opportunities for economic analysis, its low quality ,great volume and high dimensionality pose great challenges on efficient analysis of economic big data. The existing techniques have basically analyzed economic data from the viewpoint of econometrics, which contains limited indicators and requires prior knowledge of economists. When considering large varieties of economic factors, these techniques yield unsatisfactory performance. To tackle the challenges, this paper presents a new framework for proficient analysis of high dimensional economic big data based on innovatory distributed feature selection, here we have considered E-commerce web portal sales order data. The framework combines the methods of econometric model construction and economic feature selection to reveal the hidden patterns for economic growth analysis of E-commerce Portal.
Keywords-feature selection, subtractive clustering, Urbanisation, economy
1. INTRODUCTION
Econometrics is a field of economics based on approximate relationships between economic variables. It make use of statistical methods, areas of mathematic such as linear algebra and calculus, and even in computer science to theoretically test economic theory versus real world data. Up until relatively recently, datasets were little enough it was easy to gather and form the data without the use of advanced computational methods, but with the accessibility of big data sets, opportunities have arisen to test some really specific theories against large data sets in one go, which is useful. Feature selection is one of the main techniques used in data mining. In rebelliousness of its results, most learning of feature selection is small to batch learning. Unalike to existing batch learning methods, online learning can be elected by an encouraging family of well-organized and scalable machine learning algorithms for huge-scale approach.
The greatest amount of online learning need to regain all the assign features of concurrent. Such a simple circumferential are not changeless for real-world applications when statistics legend is of high-dimensionality. The problem of Online Feature Selection (OFS) is that online learner is permit to maintain a classifier which concerned only a little and fixed number of features. Online feature selection is to make exact prevision for an object using a very small number of active features. Feature selection is usually a divide procedure which cannot benefit from result of the data exploration. In this paper, we suggest a unsupervised feature selection method which could reprocess a specific data exploration result. Furthermore, our algorithm precede the thought of clustering attributes and unite two state-of-art data analyzing methods, that’s maximal information coefficient and affinity extension. There are different existing methods identify the response factors related to economic development having a base on past experience and directly embody them into function to build the correlations with economic growth, overlooking the indirect event caused by other factors related to them. Besides, the existing methods depend so much on the knowledge of economists and encompass limited indicators and records for analysis, without fully viewing the essential characteristics of high-dimensional economic data. Therefore, they cannot effectively reveal the wallop of response indictors on economic development. Background And Challenges- To design a novel framework, which will search the hidden relations between economy and indicators from a new angle and extract the useful knowledge from economic big data to derive right insights and results based on an innovative distributed feature selection framework that integrates advanced feature selection methods and econometric methods.
Challenges:
1. Feature selection algorithm implementation help of weight analysis and Pairing of Features,
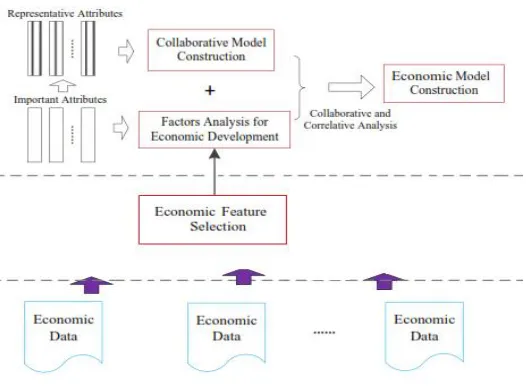
Fig 1.Architecture of proposed system
2. PROBLEM STATEMENT AND SCOPE:
The increasing economy related activities provide a wide range of indicators and records for economic analysis. Facing such large amount of data, how to detect useful information from it has drawn extensive attention in academia and industry. We aim to provide an efficient way to bridge the gap between data analysis methods and economic big data in real word. Specifically, it consists of two major tasks:
Task 1 : Feature Selection. Let A = a1, a2, ..., am be a corpus of m economic indicators. Among these m indicators, there are m features more relevant to economic development than others. And they can be grouped into k clusters according to their internal relevance. We aim to select the m features and partition them to k groups c1, c2 ...ck with the representative features as centroids.
Task 2 : Econometric Model Construction. For each cluster ci, we aim to conduct III correlative analysis between the representative feature and other related ones to generate relational model. By combining all the models based on collaborative analysis, we can establish the economic prediction model. The framework will certainly be extended to incorporate future purposes of recommender programs. For implementers, the paper presents a technique of creating picks among the many to be had purposes and technologies. An implementer can opt
for a moneymaking goal, opt for the interfaces to be able to aid reap that purpose, and pick an implementation technique that supports the purpose inside the interface. Scope :
1. Instance specific Attribute Values Prediction System 2.Recommender System in E commerce Application. 2.1Problem solving approach :
This integration effectively solves the several major problems associated with recommendation of data mining tools including the enormous effort required in pre- processing of the data before it can be used for mining, and making the results of mining in the actionable form. The tight integration between the three components of the architecture allows us for the automated construction of a data warehouse within the Analysis component. The shared meta- data across the three components is further solves this construction, and coupled it with the huge set of mining algorithms and analysis tools (like visualization, reporting and OLAP) also it increases the efficiency of the knowledge discovery process in the world. The tight integration and shared metadata also make it easy to deploy results and effectively closing the loop. So finally we presented several challenging problems which are useful for further enhancement.
3. RELATED WORK:
3.1 Implementation status
3.2 Performance measures
There are a total of 150 data entries. Data is divided into the following types: 60%-20%-20%, 90 training entries, 30 test entries and 30 validation entries. The data records the characteristics of iris flowers .There are 4 attributes .These 4 attributes are used to predict features more relevant to economic development than others. After searching for the best parameters, as described above, this study uses two performance indicators, mean square error (MSE) and CPU time, to verify the performances of the BPLA and SVM. In terms of CPU time required, the BPLA yields better results than the SVM. As shown in below graph.
4. ALGORITHM & TECHNIQUE
The attributes with the higher-ranking value contain more information of clusters than others, namely they have powerful impacts on typical economic phenomena analysis. The detailed algorithm to select the important attributes from a data set is summarized in Algorithm 1. In Algorithm 1, the neighborhood radius is initialized. Then the representative economic records named as cluster centers are selected. Then calculate the importance of attributes for preserving the correlations among records in clustering.
Algorithm 1 : Important attribute selection Input: Data matrix X ∈ℜn×m, and parameter ε , σ. Output: Important attributes and cluster centers for X. 1: Initialize the neighborhood radius r =
√ nj 1 || – j ||
( – ), and Euclidean
distance matrix G between data points; 2: for each data point xi∈ X, i = 1...n do
3: Calculate the density Di as Eq. (1);
4: end for
5: The point with the highest density Dc1 is selected as the first center. Set k = 1;
6: while Dck/Dc1> ε do
7: for each point xi∈ X, i = 1...n−k, except the chosen
centers do
8: Update the density Dias Eq. (2);
9: end for
10: The new center with the highest density Dckis selected.
Set k = k + 1;
11: for attribute a ∈ A, A is the attribute set of X do 12: for each data point xi∈ X, i = 1...n do
13: Calculate the effect of attribute a to sample i in clustering as Eq. (3);
14: end for
15: Sum the effects of attribute a to all samples in clustering as Eq. (7); // The importance of the ath attribute to select the k-th representative record is obtained.
16: end for 17: end while
18: The attributes with I =∑ ( ) / (k − 1) > σ
Are selected; // I is the importance of the a-th attribute for clustering.
A frequent item set is an item set whose support is greater than some user-specified minimum support (denoted Lk, where k is the size of the item set)
A candidate item set is a potentially frequent item set (denoted Ck, where k is the size of the item set)
Apriori Algorithm: to generate all frequent item set
Pass 1
Generate the candidate item sets in C1
Save the frequent item sets in L1
Pass k
1. Generate the candidate item sets in Ck from the frequent
item sets in Lk-1
i. Join Lk-1 p with Lk-1q, as follows: insert into Ck
select p.item1, p.item2, . . . , p.itemk-1, q.itemk-1 from Lk-1 p, Lk-1q
where p.item1 = q.item1, . . . p.itemk-2 = q.itemk-2, p.itemk-1 < q.itemk-1
iii. Prune all candidate item sets from Ck where some (k-1)-subset of the candidate item set is not in the frequent item set Lk-1
2. Scan the transaction database to determine the support for each candidate item set in Ck
3. Save the frequent item sets in Lk.
4.1 Mathematical Model
S:System;A system is defined as a set such that:S=I,P,O. Where,
U:Set of users
=UR:Set of Registered Users,UN:Set of UN-Registered Users
I:Set of Input. O:Set of output. P:Set of Processes. INPUT SET DETAILS:
1.PHASE1:REGISTRA TION.
Ir=username:ir1, Address:ir2, Pincode:ir3, Mobileno:ir4, Email:ir5
OUTPUTSETDETAILS:
1.PHASE1: REGISTRATION.O1=userid:o11 Password:o12
2.PHASE2: Data Processing O2=Feature Data:o21 3.PHASE3: Result
O3= extracted feature set:o31,
Feature Classification:o32
Success Conditions: Proper Network communication
Failure Conditions: Network failure Authentication failure
5. RESULT
Below is the tabular result Table.1 generated which shows the time complexity of both existing and proposed system. The graph.1 depicts Data In KB Vs. Time Complexity.
Data in KB
time complexity for Feature Extraction [Proposed system] in second
time complexity for Feature Extraction [Exisitng system] in second
128 0.51 1
256 0.63 1.2
384 0.76 1.42
512 0.91 1.6
640 1 1.79
Table.1: Comparison of existing and proposed system
Graph.1: Graphical representation
6. CONCLUSION
mechanism as well as the huge effort required in pre-processing of the data ahead it can be used for mining and generating the results of mining actionable. [9]The strong assimilation among the three components of the architecture permits for automated development of a data warehouse within the Analysis component. The mutual metadata beyond the three components more simplifies this construction and couple with the rich set of mining algorithms and analysis tools also increases the efficiency of the knowledge discovery process. The mutual metadata and strong assimilation also make it easy to deploy results, effectively terminating the loop. Finally we presented several challenging problems that need to be addressed for extra improvement of this architecture. In future we need to focus on parallel data crawling from different domains to get economical improvised growth details.
7. REFERENCES
[1] A. Sheth, Transforming Big Data into Smart Data: Deriving Value via Harnessing Volume, Variety, and Velocity Using Semantic Techniques and Technologies, in Proc. 30th IEEE Int. Conf. on Data Engineering, 2014, pp.2.
[2] World Economic Forum, Big Data, Big Impact New Possibilities for Inter-national Development, http : ==www3:weforum:org=docs= WEF TC MFS Big Data Big Impact Brie ng 2012:pdf, 2012.
[3] Big Data across the Federal Government, http : ==www:whitehouse: gov=sites=default= le big data fact sheet nal 1:pdf, 2014. H. Giersch, Urban Agglomeration
and Economic Growth, Springer Science & Business Media, 2012.
[4] B. Liddle, The Energy, Economic Growth, Urbanization Nexus across De-velopment: Evidence from Heterogeneous Panel Estimates Robust to Cross-sectional Dependence, The Energy Journal, vol.34, no.2, pp.223-244, 2013.
[5] S. Ghosh and K. Kanjilal, Long-term Equilibrium Relationship between Ur- banization, Energy Consumption and Economic Activity: Empirical Ev-idence from India, Energy, vol.66, no.3, pp.24-331, 2014.
[6]S. H. Law and N. Singh, Does Too Much Finance Harm Economic Growth?, Journal of Banking & Finance, vol.41, no.4, pp.36-44, 2014
[7]D. Baglan and E. Yoldas, Non-linearity in the Ination-growth Relationship in Developing Economies: Evidence from a Semiparametric Panel Model, Economics Letters, vol.125, no.1, pp.93-96, 2014.
[8]Q. Ashraf and O. Galor, The Out of Africa Hypothesis, Human Genetic Diversity, and Comparative Economic Development, The American Eco-nomic Review, vol.103, no.1, pp.1-46, 2013.
[9]V. Boln-Canedo, N. Snchez-Marono and A. Alonso-Betanzos, A Review of Feature Selection Methods on Synthetic Data, Knowledge and Information Systems, vol.34, no.3, pp.483-519, 2013.