http://dx.doi.org/10.4236/ajibm.2015.52008
Study on the Comprehensive Financial
Performance and Provincial Difference of
Travel Agency Industry of China—Based on
Catastrophe Progression Theory and
Entropy Method
Yunxin Fu, Qiong Li, Haiyan FengSchool of Management, Jinan University, Guangzhou, China Email: [email protected], [email protected]
Received 8 January 2015; accepted 25 February 2015; published 28 February 2015
Copyright © 2015 by authors and Scientific Research Publishing Inc.
This work is licensed under the Creative Commons Attribution International License (CC BY). http://creativecommons.org/licenses/by/4.0/
Abstract
The performance of travel agencies has always been the focus and its quantitative evaluation is also an important study field. From financial view, the catastrophe progression method and the entropy method are used to build a evaluation indicator system of comprehensive financial per-formance for travel agency industry applying statistical data of the major financial indicator of travel agency from 2005 to 2012, and then empirical research on comprehensive financial per-formance of travel agencies from 30 different provinces, except Hong Kong, Macao and Taiwan re-gions and Tibet is made. The result indicates that when the financial performance of travel agency is measured, profitability is the most important indicator, followed by development, solvency and asset management capabilities; through empirical research, the financial performance of travel agencies from 30 different provinces is evaluated and ranked. Finally the reasons are discussed.
Keywords
Travel Agency Industry, Comprehensive Financial Performance, Catastrophe Progression Method, Entropy Method
1. Introduction
tour-ism development. The travel agency industry has continuously expanded since reform and openness as quantity and scale have been grown. While the performance of travel agency industry is disappointing, profit margin has been less than 2% for 14 years [1], leading to a name of “thin profit industry”. The bad performance of travel agency industry attaches concentration in academic field. The main cause of low performance is property rights [2] [3]; competitive efficiency is the factor to affect performance of travel agency pointed by Yang Hui [4], and he also indicated that the environment of effective market competition formed through reforming system is an essential way which can improve the performance of travel agency. Yang Danhui, Dong Hongxia and Fan Yue-feng respectively researched the relationship between performance of travel agency market and industry con-centration rate based on SCP model, and concluded that the lower the industry concon-centration rate is, the worse the performance of travel agency is. It is very common that travel agency has a low profit and heated competi-tion, and how to effectively value the performance of travel agency should be paid urgent attention [5]-[7]. Some scholars have made effort to explore the evaluation on growth of over-margin profit [8], a system of per-formance evaluation of travel agency in China based on entropy method [9]; Yang Yan did empirical study on outbound travel of 16 travel agencies in Nanjing via linear weighting method and DuPont analysis [10].
Although research on performance of travel agency has made some progress, quantitative evaluation and em-pirical study on it are relatively lacking, and moreover existing methods to measure the performance of travel agency are limited, which have difficulty to collect data, and can be affected subjectively, so the methods can’t be applied widely in the whole industry. Regional performance of travel agency can’t be judged by a special fi-nancial indicator, and integrated estimation needs to create a reasonable evaluation system. With incessant inte-gration of domestic accounting system, financial statistics can reflect synthetically operating situation, and are objective, successive and accessible; it is a feasible way to weigh market performance and operate future. The target is to establish an evaluation indicator system of comprehensive financial performance for travel agency industry which is universally applicable, calculating financial performance of provincial travel agency and ana-lyzing the difference of comprehensive financial performance from 30 different provinces.
2. Research Methodology
2.1. Catastrophe Progression Method
Catastrophe progression method is derived from catastrophe model of catastrophe theory, which is a multi-level factorization of evaluation target, catastrophe fuzzy subordinate function is obtained through combination catas-trophe method and fuzzy mathematic, comprehensive quantitative computation is done via formula, finally they are unified into one parameter to get a general subordinate function, sorting the indicator of evaluation target. Although weight of indicator is not applied in Catastrophe progression method, it contains relative importance of each indicator which has attribution to easy calculation and widely application, so that it properly avoids sub-jectivity, unreason and false science, it has been applied to research on competition of tourism industry, market performance and growth of listed tourism company [11]-[13].
2.2. Entropy Method
Entropy is one of reference variables representing state of motion substance in thermodynamics, indicating the degree of chaos during microscopic thermal motion. Entropy has varied meanings in different field and is a measurement to system degree of disorder. If the smaller information entropy of an index is, the lower degree of disorder is, otherwise, the bigger information entropy is, the higher degree of disorder is, which pay less role and lower weigh. Entropy is an objective and precise way, which avoids subjective judge in the process of distribut-ing indicator weight and guarantees the consistence between order of index and relative degree of importance. Entropy is widely applied to confirm the indicators weight [14]-[16].
2.3. The Evaluation Index System of Comprehensive Financial Performance for Travel Agency Industry—Based on Catastrophe Progression Method and Entropy Method
2.3.1. The Selection of Evaluation Index of Comprehensive Financial Performance for Travel Agency
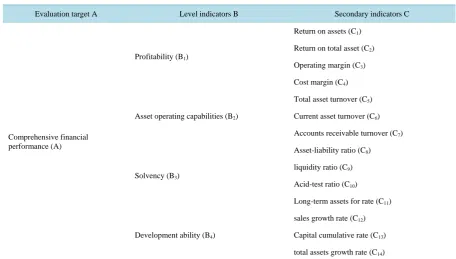
stock turnover rate is missing, intangibility of product or service offered by travel agency decides that the stock only meets need to routine management and operation, which has no direct relationship with major business and the quantity and value ratio of stock is relatively small [9], the index of stock turnover rate should be removed, The evaluation indicator system of comprehensive financial performance of travel agency is showed as Table 1.
2.3.2. Calculating Comprehensive Financial Performance for Travel Agency Industry
According to the catastrophe progression method, evaluation target should be divided into some level indicators, each secondary indicator attached to level indicator is ordered from left to right on degree of importance, when same layer indicators are appraised, degree of importance is ranked relying on its weight. Entropy method counts weight of each indicator to avoid ordering subjectively, and ranks in descending order. This result sorts the important degree of the secondary indicators based on the entropy method, and then calculates the indicators of comprehensive financial performance in the light of catastrophe progression method.
3. Empirical Research
3.1. Data ResourceStatistical data of major financial indicator of travel agency industry of China ranging 2005 from 2012 and sta-tistical data of major financial index of travel agency of 30 different regions is used, except Hong Kong, Macao and Taiwan regions and Tibet, for which statistical data of these is missing. All statistical data come from Year-bookofChineseTourismFinancialInformation.
3.2. Calculation of Indicators Weights Based on Entropy
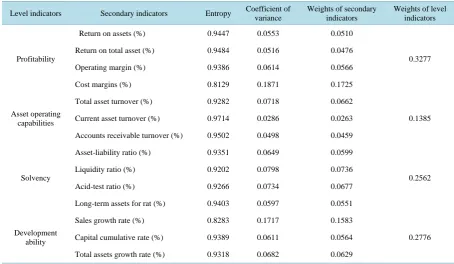
According to YearbookofChineseTourismFinancialInformation of China from 2005 to 2012, author arranged statistical data (exclude stock turnover rate) of major financial indicators of travel agency industry of 30 differ-ent provinces, and founded matrix of original statistical data, calculated differ-entropy and indicator weights of com-prehensive financial performance of travel agency industry on the basis of step to valuation of entropy method showed in Table 2.
[image:3.595.83.540.461.720.2]Conclusion made from important degree of level indicators is ranked in descending sequent as profitability, asset operating capabilities, solvency, development ability, in which important degree of secondary indicators
Table 1. The evaluation indicators system of comprehensive financial performance for travel agency industry.
Evaluation target A Level indicators B Secondary indicators C
Comprehensive financial performance (A)
Profitability (B1)
Return on assets (C1)
Return on total asset (C2)
Operating margin (C3)
Cost margin (C4)
Asset operating capabilities (B2)
Total asset turnover (C5)
Current asset turnover (C6)
Accounts receivable turnover (C7)
Solvency (B3)
Asset-liability ratio (C8)
liquidity ratio (C9)
Acid-test ratio (C10)
Long-term assets for rate (C11)
Development ability (B4)
sales growth rate (C12)
Capital cumulative rate (C13)
Table 2. Indicator weights of comprehensive financial performance of travel agency based on entropy.
Level indicators Secondary indicators Entropy Coefficient of
variance
Weights of secondary indicators
Weights of level indicators
Profitability
Return on assets (%) 0.9447 0.0553 0.0510
0.3277
Return on total asset (%) 0.9484 0.0516 0.0476
Operating margin (%) 0.9386 0.0614 0.0566
Cost margins (%) 0.8129 0.1871 0.1725
Asset operating capabilities
Total asset turnover (%) 0.9282 0.0718 0.0662
0.1385
Current asset turnover (%) 0.9714 0.0286 0.0263
Accounts receivable turnover (%) 0.9502 0.0498 0.0459
Solvency
Asset-liability ratio (%) 0.9351 0.0649 0.0599
0.2562
Liquidity ratio (%) 0.9202 0.0798 0.0736
Acid-test ratio (%) 0.9266 0.0734 0.0677
Long-term assets for rat (%) 0.9403 0.0597 0.0551
Development ability
Sales growth rate (%) 0.8283 0.1717 0.1583
0.2776
Capital cumulative rate (%) 0.9389 0.0611 0.0564
Total assets growth rate (%) 0.9318 0.0682 0.0629
reflects profitability ranging as cost margins, operating margin, return on assets, return on total asset; While de-velopment ability is reflected by important degree of secondary indicators sorting as sales growth rate, total as-sets growth rate, capital cumulative rate; Solvency is reflected by important degree of secondary indicators sort-ing as liquidity ratio, acid-test ratio, asset-liability ratio, long-term assets for rate; asset operatsort-ing capabilities is reflected by important degree of secondary indicators sorting as total asset turnover ratio, accounts receivable turnover ratio, current asset turnover ratio.
3.3. Calculating Comprehensive Financial Performance for Travel Agency Industry Based on Catastrophe Progression Method
3.3.1. Calculating Procedure of Catastrophe Progression Method
After confirming indicators system of comprehensive financial performance for travel agency industry and se-quence of relatively important degree of each layer indicators, according to requirement of catastrophe progres-sion method, author tries to handle the original data to standardization, and then calculate based on mutation system normalized formula.
A case study of Beijing travel agency industry, author calculates indicators from all layers
1) Butterfly mutation system model is consist of C1, C2, C3, C4 of secondary indicators, formula is listed as XB1 = (XC11/2 + XC21/3 + XC31/4 + XC41/5)/4 = 0.8942 in accordance to complementary principle; C5, C6, C7 of secondary indicators compose dovetail mutation system model, reaching formula XB2 = (XC51/2 + XC61/3 + XC71/4)/3 = 0.7285 based on complementary principle; C8, C9, C10, C11 of secondary indicators constitute but-terfly mutation system model, and formula is listed as XB3 = (XC81/2 + XC91/3 + XC101/4 + XC111/5)/4 = 0.8069 based on complementary principle; C12, C13, C14 of secondary indicators make up dovetail mutation sys-tem model, get a formula of XB4 = (XC121/2 + XC131/3 + XC141/4)/3 = 0.5295 according to complementary principle.
3.3.2. The Ranks of Comprehensive Financial Performance of Travel Agency from 30 Provinces According previous method and step, calculates calculation weight of comprehensive financial performance of travel agency of 30 provinces and level indicator then ranks it as Table 3.
4. Discussion
[image:5.595.90.537.239.723.2]Comprehensive financial performance of travel agency industry is the final achievement, which is affected by many factors. The factors which cause difference to comprehensive financial performance of travel agency in-dustry of different provinces are divided into two facets: uncontrollable factors and controllable factors. The uncontrollable factors mainly include distinction of economical development and resource endowment, and the controllable factors contain management ability of travel agency and market competitive degree.
Table 3.The ranks of comprehensive financial performance of travel agency of each province.
Province Profitability Rank
Asset operating capabilities
Rank Solvency Rank Development ability Rank
Comprehensive financial performance
Rank
Hunan 0.8681 5 1.0000 1 0.8302 6 0.9497 2 0.9673 1
Chongqing 0.7637 19 0.8485 2 0.8110 15 0.9645 1 0.9446 2
Shanghai 0.9294 2 0.6247 20 0.8101 16 0.7900 5 0.9369 3
Jiangsu 0.8517 6 0.7422 5 0.8084 18 0.7566 9 0.9311 4
Zhejiang 0.8336 10 0.7311 8 0.8063 21 0.7845 6 0.9305 5
Fujian 0.7986 13 0.7397 6 0.8114 14 0.7816 7 0.9263 6
Inner Mongolia 0.8243 11 0.5613 22 0.8376 4 0.7948 4 0.9205 7
Guangdong 0.8486 7 0.6760 16 0.7996 23 0.6961 18 0.9194 8
Beijing 0.8942 3 0.5295 24 0.8069 20 0.7285 15 0.9184 9
Hubei 0.7843 15 0.7060 12 0.8077 19 0.7341 13 0.9171 10
Sichuan 0.7529 20 0.7763 4 0.7336 27 0.7728 8 0.9154 11
Jiangxi 0.7344 22 0.7315 7 0.8385 3 0.7457 10 0.9150 12
Yunnan 0.7733 17 0.7100 11 0.8095 17 0.6956 19 0.9119 13
Liaoning 0.7833 16 0.7869 3 0.7855 25 0.6465 23 0.9111 14
Ningxia 0.8133 12 0.7276 9 0.6484 28 0.7316 14 0.9096 15
Anhui 0.8408 9 0.7048 13 0.6278 29 0.7063 17 0.9075 16
Shanxi 0.6829 25 0.6259 19 0.9494 1 0.7374 11 0.9069 17
Shandong 0.8439 8 0.7006 14 0.7924 24 0.5773 28 0.9065 18
Henan 0.7862 14 0.5784 21 0.8241 9 0.6379 24 0.8991 19
Hebei 0.7214 23 0.6390 18 0.8230 10 0.6552 22 0.8962 20
Shanxi 0.7421 21 0.5278 25 0.8316 5 0.6663 21 0.8925 21
Tianjin 0.6831 24 0.6530 17 0.8117 13 0.6701 20 0.8923 22
Heilongjiang 0.8771 4 0.5347 23 0.8690 2 0.4819 29 0.8921 23
Qinghai 0.9429 1 0.1573 29 0.8161 12 0.8706 3 0.8918 24
Jilin 0.6791 26 0.4404 28 0.8268 8 0.6022 26 0.8677 25
Guizhou 0.4577 29 0.6839 15 0.8283 7 0.7275 16 0.8642 26
Guangxi 0.7680 18 0.7261 10 0.8188 11 0.3164 30 0.8617 27
Hainan 0.4767 28 0.5195 27 0.8027 22 0.7357 12 0.8542 28
Xinjiang 0.6737 27 0.5195 26 0.4254 30 0.6256 25 0.8402 29
1) Differences in the level of economic development
Tourism has close relationship to the level of economic development; low level of economic development has significant influence on comprehensive financial performance of travel agency industry of each province. On one hand, people’s discretionary income is decided by level of regional economic development, which will di-rectly affect tourism demand and income of travel agency industry; on the other hand, the level of regional eco-nomic development depends on fundamental facilities, traffic condition, exploitive extent of tourism attraction, and indirectly affects financial performance of local travel agency. Regions whose comprehensive financial performance o travel agency industry ranks top ten are coastal areas possessing advanced economy or high level of economic development in the Midwest of China, such as Hunan, Hubei, Inner Mongolia.
2) Differences in the resource endowment
China is so vast in territory that there exist obvious diversity and difference in nature ecological environment, social culture, resource endowment of each province. Differences in the resource endowment determine that tourism resource attraction, total number and days of tourist reception, income of travel agency, different influ-ent on comprehensive financial performance.
3) Management level of travel agency
Financial performance of local travel agency is related to management level. For example, asset operating capability that is one of level evaluation indicators of comprehensive financial performance for travel agency industry reflects management level, strategy of product, promotion, price can attach impact on income, cost and development potentiality, further, and financial performance of travel agency is affected by them.
4) Market structure of travel agency industry
According to SCP (market structure—market conduct—market performance) conceptual model [17], market structure of travel agency industry has impact on market conduct and market performance, there may be exist some distinction on quantity and scale of travel agency to different provinces, and displaying divergence of market structure, then affecting market conduct and market performance. Provincial differences of comprehen-sive financial performance have relationship to different market structure to a certain degree.
There are many collective factors to cause the provincial difference of financial performance; they are not mutually independent but interactive with each other. Only the managers and scholars should try their best find out main cause to financial performance relying on actual condition of each province and analyzing specific de-tails of travel agency, and make some targeted improvement, the comprehensive financial performance of China can be truly enhanced.
5. Conclusions
The author creates a evaluation indicator system of comprehensive financial performance for travel agency in-dustry, through analyzing statistical data from tourism financial information yearbook of China, calculates com-prehensive financial performance of travel agency industry from 30 different provinces, except Hong Kong, Macao and Taiwan regions and Tibet based on catastrophe progression theory and entropy method and ranks the comprehensive financial performance. Author makes some conclusions as below:
1) Four level indicators weights of travel agency financial performance are evaluated through entropy, and the important degree is ranked descending as profitability, development ability, solvency and asset operating capa-bility, whose result is consistent to indicators sequence ranked as operating performance, when Weng Gangmin was evaluating thoroughly on listed tourism companies [12]. The most important indicator, which is related to the feature of travel agency industry, is operating margin among the secondary indicators.
2) There is apparent regional difference on comprehensive financial performance of China travel agency in-dustry. Hunan is the best while Gansu is the worst; the top ten regions of comprehensive financial performance are Hunan, Chongqing, Shanghai, Jiangsu, Zhenjiang, Fujian, Inner Mongolia, Guangdong, Beijing and Hubei, where economy is relatively advanced. The last ten regions are Tianjin, Heilongjiang, Qinghai, Jilin, Guizhou, Guangxi, Hainan, Xinjiang and Gansu, where economical development is relatively defective.
References
[1] Zhai, X.K. and Huang, S.M. (2012) Market Performance and Affecting Factors of China Travel Agency Industry.
TourismEconomic, 379, 137-140.
[2] Zhang, H. and Wei, X. (2004) Economical Analyses and Relocation to Travel Agency Industry of China. Tourism Tri-bune, 19, 71-76.
[3] Song, Z.C. and Ma, Y.G. (2005).Think Property Reform and Scale Operation of Travel Agency Industry—Discussion with Zhanghui and Weixiang. TourismTribune, 20, 29-32.
[4] Yang, J. (2006) Analyze Further Cause to Performance of Ravel Agency Industry—Discussion with Zhanghui and Song Zhenchun. TourismTribune, 21, 74-76.
[5] Yang, D.H. (2004).Empirical Research on Market Structure and Industry Performance of Ravel Agency Industry.
JournalofCapitalUniversityofEconomicsandBusiness, 4, 23-28.
[6] Dong, H.X. (2006) Analyze on Industrial Concentration and Market Performance of Ravel Agency Industry. Shandong Agriculture University, Tai’an.
[7] Fan, Y.F. (2009) Analyze on Affecting Factors to Market Performance of Travel Agency Industry—Based on Modified SCP Model. JournaloftheYinchuanMunicipalPartyCollegeofC.P.C., 11, 88-90.
[8] Zhang, X.M. and He, Y. (2003) Exploitation on the Method of Performance Evaluation of Domestic Travel Agency Industry. JournalofNorthwestUniversity, 33, 72-76.
[9] Shen, F.P. and Ma, Y.F. (2008) Research on Evaluation Indicators of Financial Performance of Domestic Travel Agency Industry. EconomicsandManagement, 22, 81-84.
[10] Yang, Y. (2011) Research on Financial Performance Evaluation of Domestic Travel Agency Industry Based on Linear Weighting Method and DuPont Analysis—A Case Study of Outbound Travel Agency of Nanjing. Nanjing Normal University, Nanjing.
[11] Weng, G.M. and Ru, C. (2009) Research on Competition of Tourism Industry Based on Catastrophe Progression Theory—A Case Study of Five Provinces from Northwest. SoftScience, 23, 57-61.
[12] Weng, G.M. and Ru, C. (2010) Comprehensive Assessment on Operation Performance of Listed Tourism Companies Based on Catastrophe Progression Theory. StatisticsandDecision, 309, 56-59.
[13] Zhang, C.H. and Zhang, H. (2010) Research on Growth Evaluation of Domestic Listed Tourism Companies Based on Catastrophe Progression Theory. TourismTribune, 25, 19-27.
[14] Yang, F.W. and Li, X. Application of Financial Indicators Weight of Entropy Method of Peanuts. Communicationof FinanceandAccounting, 5, 54-55.
[15] Meng, F.S. and Li, M.Y. (2012) Research on Affecting Factors to Energy Consumption—Based on Catastrophe Pro-gression Theory and Improved Entropy Method. JournalofSystemsEngineering, 224, 10-15.
[16] Chen, H. (2012) Comprehensive Assessment on Profitability of Pharmaceutical Company Based on Entropy Me-thod—Case Study of Eight Pharmaceutical Companies. JournalofEconomicTradeUpdate, 244, 94.
[17] Zhang, A.M. and Li, Y.W. (2007) Management Measure of Travel Agency Industry of China Based on SCP Model.