http://dx.doi.org/10.4236/ojee.2014.34012
How to cite this paper: Ramesh, T., Prakash, R. and Shukla, K.K. (2014) Life Cycle Energy of Low Rise Residential Buildings in Indian Context. Open Journal of Energy Efficiency, 3, 108-118. http://dx.doi.org/10.4236/ojee.2014.34012
Life Cycle Energy of Low Rise Residential
Buildings in Indian Context
Talakonukula Ramesh
1*, Ravi Prakash
2, Karunesh Kumar Shukla
3 1Government Polytechnic, Nirmal, India2Department of Mechanical Engineering, Motilal Nehru National Institute of Technology, Allahabad, India 3Department of Applied Mechanics, Motilal Nehru National Institute of Technology, Allahabad, India
Email: *rams2dg@gmail.com
Received 6 October 2014; revised 6 November 2014; accepted 23 November 2014
Copyright © 2014 by authors and Scientific Research Publishing Inc.
This work is licensed under the Creative Commons Attribution International License (CC BY).
http://creativecommons.org/licenses/by/4.0/
Abstract
Life cycle energy of the building accounts for all energy inputs to the buildings during their in- tended service life. Buildings need to be constructed in such a way that energy consumption in their life cycle is minimal. Life Cycle Energy (LCE) consumption data of buildings is not available in public domain which is essentially required for building designers and policy makers to formulate strategies for reduction in LCE of buildings. The paper presents LCE of twenty (20) low rise resi- dential buildings in Indian context. LCE of the studied buildings is varying from 160 - 380 kWh/m2 year (Primary). Based on the LCE data of studied buildings, an equation is proposed to readily reckon LCE of a new building.
Keywords
Life Cycle Energy, Residential Buildings, Embodied Energy, Operating Energy
1. Introduction
Building construction sector is experiencing a fast-paced growth in developing countries, like India, due to growth of economy and rapid urbanization. A large number of buildings are being built for residential, commer- cial and office purposes every year. In India, 24% of primary energy and 30% of electrical energy is consumed in buildings [1]. The use of electricity in this sector is growing at the rate of 11% - 12% annually, which is 100% more than the average growth rate of 5% - 6% in the economy [2]. Besides the depletion of non-renewable energy sources, this energy use contributes greenhouse gases to the atmosphere, with consequent detrimental effects. In order to reduce the detrimental environment impacts of the buildings, new buildings need to be planned in such a way that energy consumption in their life cycle is minimal. In spite of the fast-paced growth of
the building sector in India, Life Cycle Energy (LCE) consumption data for this sector is not available in the public domain; whereas a lot of work has been done in cold and western countries. Absence of macro-level data has been a barrier for the government to formulate effective policies to make the buildings energy-efficient.
Life cycle energy of the building accounts for all energy inputs to the buildings during their intended service life. It includes direct energy inputs during construction, operation and demolition phases of the buildings, and indirect energy inputs through the production of components and materials used in construction (embodied energy). If LCE is expressed in primary energy terms, it also gives a useful indication of environmental impacts attributable to buildings as primary energy consumption and associated emissions are proportional [3]-[5]. Life cycle energy evaluation of buildings becomes necessary not only for evaluating energy performance of the existing buildings but also to set a meaningful target for construction industry to construct new buildings with reduced energy de- mand, i.e. low energy buildings.
Low Energy Buildings
It is reported in different case studies available in the literature that operating energy of the buildings has largest share (80% - 90%) and embodied energy constitutes 10% - 20% in its life cycle energy distribution. Thus, the most important aspect for the design of buildings which demand less energy throughout their life cycle (low energy buildings) is the reduction in operating energy [6]-[8]. In order to reduce operational energy demand of the buildings, passive and active measures such as providing higher insulation on external walls and roof, using gas filled multiple pane windows with low emissivity coatings, ventilation air heat recovery from exhaust air, heat pumps coupled with air or ground/water heat sources, solar thermal collectors and building integrated solar photovoltaic modules, etc. can be used. But, reduction in operating energy is generally accompanied by increase in embodied energy of the buildings due to energy intensive materials used in the energy saving measures and on-site power generating equipment integrated with building.
Though embodied energy constitutes only 10% - 20% to life cycle energy, opportunity for its reduction should not be ignored. There is a potential for reducing embodied energy requirements through use of materials in the construction that requires less energy during manufacturing [9]. While using low energy materials, atten- tion must be focused on their thermal properties and longevity as they have impact on energy use in operating phase of a building’s life cycle. Thus, energy saving measures aimed at reducing one phase of energy use (oper- ating) has impact on other phase of energy use (embodied energy) of the building. Hence, holistic evaluation of the buildings covering all phases of energy use is required to assess energy performance of the buildings. Ano- ther opportunity for reducing embodied energy is through use of recycled materials in the construction.
The present paper focuses on evaluation and presentation of LCE data of low rise residential buildings in In- dian context. LCE of the buildings was evaluated for existing (conventional) and modified designs. Building de- signs are modified by applying energy saving measures viz. thermal insulation on wall and roof, double pane glass for windows and with on-site power generation equipment (PV modules). Such a study is expected to be useful for building designers and policy makers for holistic evaluation of buildings from life cycle perspective.
2. Methodology
A total of 20 house designs (Table 1) are obtained from house builders, consultants and owners of the buildings. All buildings are conventional houses with RCC frame work, walls filled with fired clay bricks, and RCC roof. The buildings are categorized by number of floors they have viz. one storey, two storey, and multi storey. Each floor contains one or more family portions consisting of bed rooms, drawing room, living room, and a kitchen. Bedrooms and living hall are air conditioned. The information of buildings such as usable floor area, conditioned area, number of families living, operating hours, etc have been collected.
EBE) and operation phases of the buildings from a primary energy perspective is being considered. LCE of the buildings are evaluated for different locations (Allahabad, Ahmedabad, Hyderabad, Chennai and Bangalore) under different climatic zones of India viz: hot and dry, warm and humid, moderate, and composite (Figure 1).
Table 1.Details of the buildings studied.
BIN Name Category Floor Area (m2)
Conditioned
area (m2) Description Location
1 Resha One storey 80 36 Single family, 3 BR house Hyderabad
2 Harish One storey 90 42 Single family, 2 BR house Hyderabad
3 Janardhan One storey 102 55 Single family, 2 BR house Hyderabad
4 Goud One storey 86 47 Single family, 2 BR house Hyderabad
5 Eashwer One storey 185 104 Two families, 2BR portion-1,
1BR portion-1 Hyderabad
6 Srinivas One storey 155 102 Two families, single BR portions-2 Hyderabad
7 Ravindra One storey 107 71 Single family, 2BR house Hyderabad
8 Adil One storey 62 46 Two families, single BR portions-2 Hyderabad
9 Keerthi One storey 104 86 Single family, 3BR house Hyderabad
10 Abhishek Two storey 256 136 Two families, 3BR portions-2 Hyderabad
11 Alwal Two storey 135 80 Two families, single BR portions-2 Hyderabad
12 Nirmal Two storey 235 155 Two families, 3BR portions-2 Hyderabad
13 Mahipal Two storey 268 180 Multy families, single BR flats-8 Hyderabad
14 Anand Duplex 183 100 Single family, 4BR house Hyderabad
15 RG Duplex 175 120 Single family, 4BR house Hyderabad
16 Mahendra Duplex 450 340 Single family, 4BR house Ahmedabad
17 Kiran Arcade Multi storey 1286 600 Multy families, single BR flats-15 Hyderabad
18 Renuka Multi storey 590 350 Multy families, two BR flats-12 Hyderabad
19 Pradeep Multi storey 854 430 Multy families, single BR flats-12 Hyderabad
20 Rock town Multi storey 1280 1024 Multy families, 3BR flats-4, 2BR flats-8 Hyderabad
BIN: Building Identification Number.
[image:3.595.198.429.482.693.2]Life Cycle Energy
LCE demand of the building is taken as the sum of the embodied energy of materials used in the construction (EBE) and operating energy (OPE) on an assumed lifespan of 75 years using following relation [10] [11]:
LCE=
∑
m Mi i+E LA b (1) wheremi= Quantity of building material (i),
Mi= Embodied energy of material (i) per unit quantity
(
Table 2),EA= Annual Operating Energy (primary), Lb= Lifespan of the building (75 years).
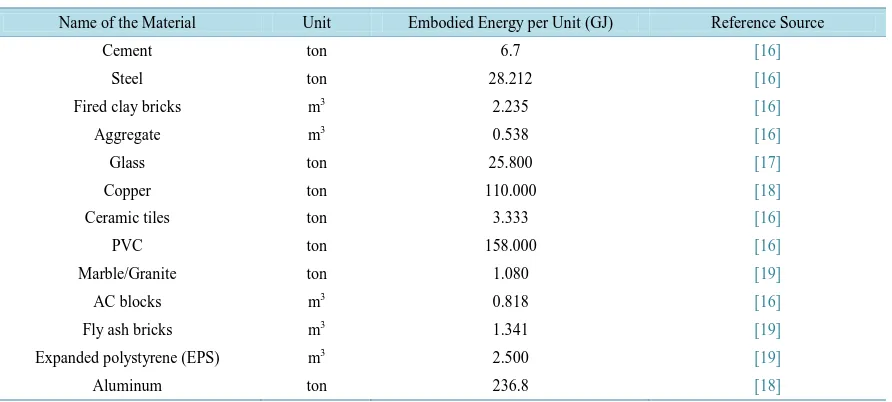
Energy used for on-site construction and demolition at the end of its service life are ignored in the study as they contribute little (1%) to LCE [10]-[14]. Unit for LCE is chosen as kWh (thermal). However, normalized LCE per unit floor area and per year is useful for quick comparison of energy performance of buildings of dif- ferent sizes or different design versions of a building. Hence, LCE and other energy entities (OPE and EBE) of the building are normalized to kWh/m2 year based on their floor area and assumed lifespan of 75 years. Quantity of materials is estimated from the technical drawings of the buildings using QE-Pro software [15]. Embodied energy per unit quantity of building materials are compiled from literature [16]-[19].
The energy used for the renovation of buildings is included in EBE of the building. Annual electricity demand of the building is estimated by energy simulation of the building using dynamic energy simulation tool design builder [20]. The evaluated energy (electricity) demand of the buildings is then converted into primary energy using a conversion factor of 3.4 [21] for the Indian context and is termed as annual operating energy (EA). An-
nual operating energy of the building is assumed to be same in future throughout its life span.
LCE demand is estimated for existing (conventional-Case A) and modified designs of the buildings for differ- ent climatic conditions of India. Building designs are modified by applying energy saving measures: adding 5 cm thick thermal insulation to wall and roof, and double pane glass for windows (Case B). LCE demand of the conventional building under particular climatic condition is taken as the base case for calculating energy savings. Further, LCE of the buildings is also evaluated with on-site power generating equipment (PV system). The em- bodied energy of PV modules, for initial installation and replacement, is included in calculation of EBE of the building. Number of times the PV modules are replaced is calculated using following relation:
(
b i 1)
N= L L − (2)
where
N = No of times the PV modules are replaced in life span of building, Lb= Lifespan of the building,
[image:4.595.90.536.522.723.2]Li= Lifespan of PV modules (Table 3).
Table 2. Embodied energy of building materials.
Name of the Material Unit Embodied Energy per Unit (GJ) Reference Source
Cement ton 6.7 [16]
Steel ton 28.212 [16]
Fired clay bricks m3 2.235 [16]
Aggregate m3 0.538 [16]
Glass ton 25.800 [17]
Copper ton 110.000 [18]
Ceramic tiles ton 3.333 [16]
PVC ton 158.000 [16]
Marble/Granite ton 1.080 [19]
AC blocks m3 0.818 [16]
Fly ash bricks m3 1.341 [19]
Expanded polystyrene (EPS) m3 2.500 [19]
Table 3. Particulars of PV modules.
Parameter Value
Wattage per module 75 Wp
Short circuit current Isc 4.8 A
Open circuit voltage Voc 21 V
Maximum current Imax 4.5 A
Maximum voltage Vmax 16.5 V
Area of single module 0.6 m2
Type of cell Single crystalline silicon
Number of cells in a module 36
Life span 30 years
Embodied energy of PV system (primary) 1710 kWh/m2
Electricity generated from PV modules is simulated using e-Quest software [22] for different climatic condi- tions of India. PV modules and storage devices (batteries) are designed as explained in the reference [23]. Speci- fications and other particulars of PV modules are shown in Table 3.
3. Results and Discussion
The results obtained from the life cycle energy analysis of the buildings under different conditions are presented herein. Table 4 presents the life cycle energy (LCE) demand of the conventional buildings studied under differ- ent geographical locations of India. LCE of the buildings is varying from about 160 - 380 kWh/m2 year. There is wide variation in LCE demand of the buildings. The reasons for this variation could be attributed to differences in climatic conditions, conditioned floor area and layout of the buildings. However, LCE range of buildings for composite, hot and dry, warm and humid climates is almost same and it is about 200 - 380 kWh/m2 year whe- reas for moderate climate it is 160 - 270 kWh/m2 year. Single storey houses require higher LCE than two and multi-storey house under similar operating and climatic conditions. This is due to the fact that, single storey houses require higher operating energy than two and multi-storey houses as they have higher external surface area per m2 of usable floor area which results in higher thermal load and energy consumption by cooling and heating equipment. Besides this, embodied energy of single storey houses is also higher than two and multi- storey houses. With increase in number of floors, external surface area per usable floor area comes down and hence multi-storey houses show better energy performance among the three.
Figures 2-4 show the variation of annual operating (electrical) energy demand of the buildings with condi- tioned floor area for different locations. It is observed that annual operating energy demand of the building is in- creasing with increase in conditioned floor area. Regression analysis is performed to obtain a relation between annual operating energy (electrical energy) and conditioned floor area of the buildings. A second order poly- nomial equation (R2 = 0.98) can be best fit curve among the others-linear (R2 = 0.97) and exponential (R2 = 0.8). The relation between conditioned floor area and annual operating energy cannot be linear at higher conditioned floor areas. The reason is generally higher conditioned floor areas exist in multi-floor buildings; with increase in number of floors, external surface area per unit floor area of the building comes down thereby reducing the rate of increase in air conditioning load and corresponding operating energy of the building. Hence, the relation be- tween conditioned floor area and annual operating energy becomes non linear with increase in conditioned floor area.
Hence, second order polynomial equation can be chosen to estimate annual operating primary energy (EA) of
the buildings.
(
2)
3.4
A
E = AX +BX+C (3)
where
X = Conditioned floor area of the building (m2),
Further, it is observed that embodied energy of the buildings for single storey buildings is varying from 25 to 30 kWh/m2 year (average 27.5 kWh/m2 year) and for two and multi storey houses it is varying from 18 to 25 kWh/m2 year (average 22 kWh/m2 year) As variation in embodied energy of the buildings is not high, the aver- age of the above values are taken as standard to represent embodied energy of single, two and multy-storey houses respectively.
Table 4.LCE demand of the residential buildings for different locations.
BIN Name Embodied energy kWh/m2 year
Life cycle energy kWh/m2 year
Hyderabad Ahmedabad Allahabad Chennai Bangalore
1 Resha 29.4 265 276 304 313 226
2 Harish 27.6 232 269 270 274 198
3 Janardhan 29 193 218 219 209 165
4 Goud 28 203 242 243 235 164
5 Eashwer 21 267 293 288 300 247
6 Srinivas 25 259 298 297 301 223
7 Ravindra 25.2 269 304 309 310 230
8 Adil 27.4 294 330 346 335 249
9 Keerthi 28 327 376 368 357 254
10 Abhishek 24.2 246 280 280 288 201
11 Alwal 18.5 266 297 291 290 197
12 Nirmal 23.5 271 305 315 300 230
13 Mahipal 18.3 278 318 325 322 225
14 Anand 21.5 255 285 288 294 207
15 RG Reddy 22 276 318 303 315 221
16 Mahendra 25 301 334 332 345 256
17 Kiran Arcade 22 247 272 276 280 210
18 Renuka 25 298 336 334 347 243
19 Pradeep 21 230 255 260 264 192
[image:6.595.88.540.176.697.2]20 Rock town 23 317 349 346 364 269
Figure 3. Variation of electrical energy demand of the buildings with conditioned floor area (Ahmedabad location).
[image:7.595.87.538.555.616.2]Figure 4. Variation of electrical energy demand of the buildings with conditioned floor area (Bangalore location).
Table 5. Regression coefficients for different locations.
Hyderabad Ahmedabad Allahabad Chennai Bangalore
A −0.043 −0.05 −0.055 −0.049 −0.035
B 157.4 177.3 182.1 182.4 129.6
C −3388 −3601 −3951 −3941 −2925
Thus, to estimate LCE of the conventional buildings (in kWh/m2 year) following equations is proposed:
LCE=EBE+EA FAR (4)
where
EBE = 27.5 for single storey houses; 22 for two and multi-storey houses, FAR = Floor area (usable) of the building.
Table 6. LCE and savings % (values shown in parenthesis) from energy saving measures (Ahmedabad location).
BIN Name Case A Case B
1 Resha 309 256 (17.2)
2 Harish 273 232 (15)
3 Janardhan 218 174 (20.2)
4 Goud 245 203 (17.1)
5 Eashwer 293 260 (11.3)
6 Srinivas 298 243 (18.5)
7 Ravindra 305 254 (16.7)
8 Adil 330 274 (17)
9 Keerthi 376 265 (29.5)
10 Abhishek 279 256 (8.2)
11 Alwal 297 240 (19.2)
12 Nirmal 304 273 (10.2)
13 Mahipal 318 282 (11.3)
14 Anand 285 257 (9.8)
15 RG Reddy 318 285 (10.4)
16 Mahendra 334 312 (6.6)
17 Kiran Arcade 271 261 (3.7)
18 Renuka 336 310 (7.7)
19 Pradeep 258 237 (8.1)
20 Rock Town 349 335 (4)
Table 7. LCE and savings % (values shown in parenthesis) from energy saving measures (Hyderabad location).
BIN Name Case A Case B
1 Resha 265 231 (12.8)
2 Harish 235 212 (9.8)
3 Janardhan 193 163 (15.5)
4 Goud 203 173 (14.8)
5 Eashwer 267 249 (6.7)
6 Srinivas 259 226 (12.7)
7 Ravindra 269 237 (11.9)
8 Adil 294 253 (13.9)
9 Keerthi 327 242 (26)
10 Abhishek 246 237 (3.7)
11 Alwal 266 220 (17.3)
12 Nirmal 271 254 (6.3)
13 Mahipal 278 257 (7.6)
14 Anand 255 238 (6.7)
15 RG Reddy 276 260 (5.8)
16 Mahendra 301 289 (4)
17 Kiran Arcade 247 244 (1.2)
18 Renuka 298 287 (3.7)
19 Pradeep 230 219 (4.8)
20 Rock Town 317 312 (1.6)
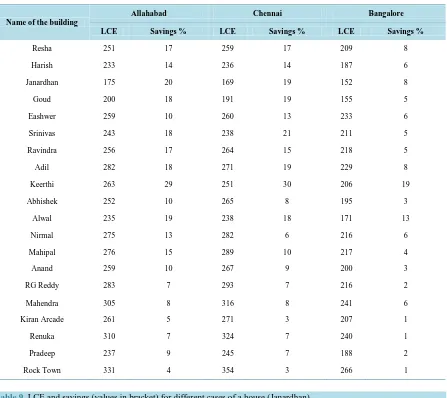
[image:8.595.89.536.416.711.2]on the type, layout, and conditioned floor area of the buildings and also climatic conditions of locality. Single storey houses have better LCE savings than two and multi-storey houses because reduction in thermal load per unit floor area, due to thermal insulation on envelope, is higher for single storey houses than two and multi-storey houses.
Table 9 presents LCE savings of a single storey house with varying number of PV modules (on-site power generation) in combination with passive features. There is 30% to 70% reduction in LCE of the building. Use of PV modules seems to be most promising for primary energy reduction of the buildings.
Table 8. LCE and savings from energy saving measures for other locations.
Name of the building
Allahabad Chennai Bangalore
LCE Savings % LCE Savings % LCE Savings %
Resha 251 17 259 17 209 8
Harish 233 14 236 14 187 6
Janardhan 175 20 169 19 152 8
Goud 200 18 191 19 155 5
Eashwer 259 10 260 13 233 6
Srinivas 243 18 238 21 211 5
Ravindra 256 17 264 15 218 5
Adil 282 18 271 19 229 8
Keerthi 263 29 251 30 206 19
Abhishek 252 10 265 8 195 3
Alwal 235 19 238 18 171 13
Nirmal 275 13 282 6 216 6
Mahipal 276 15 289 10 217 4
Anand 259 10 267 9 200 3
RG Reddy 283 7 293 7 216 2
Mahendra 305 8 316 8 241 6
Kiran Arcade 261 5 271 3 207 1
Renuka 310 7 324 7 240 1
Pradeep 237 9 245 7 188 2
[image:9.595.88.537.601.722.2]Rock Town 331 4 354 3 266 1
Table 9. LCE and savings (values in bracket) for different cases of a house (Janardhan).
Case
Cities
Ahmedabad Allahabad Chennai Bangalore Hyderabad Remarks
Case A 218 219 209 165 193 Conventional
Case B 174 (16) 175 (17) 169 (19) 152 (3) 163 (10) Passive
Case B + 20 PV modules 128 (38) 131 (38) 120 (42) 111 (29) 117.4 (35) On-site (part load)
Case B + 40 PV modules 72.4 (65) 76.8 (63) 65 (69) 62.4 (60) 62.5 (65) On-site (part load)
Case B + Y No. PV modules 56.7 (73), Y = 60
56.7 (73), Y = 60
55 (74), Y = 52
55 (65), Y = 52
55 (70), Y = 52
4. Conclusions
LCE of the buildings is varying from 160 - 380 kWh/m2 year depending on the type (geometry) of the building and climatic conditions. With insulation on wall and roof along with double pane glass for windows, reduction in LCE of the buildings is about 5% - 30%. LCE of the buildings can be further reduced by on-site power genera- tion from PV system (30 to 70%). A polynomial equation is proposed to readily reckon LCE of the new build- ings. However, such equation needs to be improved when large number of LCE data is available in future.
The results of the present study are useful for building designers involved in design and construction of the energy efficient buildings and for policy makers to set meaningful targets. Some other cooling techniques like free cooling, evaporative cooling, solar air conditioning etc., may be tested to bring down LCE of the buildings. Use of energy efficient cooling/heating equipment and appliances would also reduce LCE of the buildings con- siderably.
References
[1] Bansal, N.K. (2007) Energy Security, Climate Change and Sustainable Development. In: Mathur, J., Wagner, H.J. and Bansal, N.K., Eds., Science, Technology and Society: Energy Security for India, Anamaya Publishers, New Delhi, 15-23.
[2] Ministry of Power, Government of India (2010) Performance Based Rating and Energy Performance Benchmarking for Commercial Buildings in India. http://www.powermin.nic.in/JSP_SERVLETS/internal.jsp
[3] Adalberth, K., Almgren, A. and Petersen, E.H. (2001) Life Cycle Assessment of Four Multi-Family Buildings. Inter- national Journal of Low Energy and Sustainable Buildings, 2, 1-21.
[4] Kofoworola, O.F. and Gheewala, S.H. (2008) Environmental Life Cycle Assessment of a Commercial Office Building in Thailand. International Journal of Life Cycle Assessment, 13, 498-511.
http://dx.doi.org/10.1007/s11367-008-0012-1
[5] Junnila, S., Horvath, A. and Guggemos, A.A. (2006) Life-Cycle Assessment of Office Buildings in Europe and the United States. Journal of Infrastructure Systems, 12, 10-17.
http://dx.doi.org/10.1061/(ASCE)1076-0342(2006)12:1(10)
[6] Adalberth, K. (1999) Energy Use in Four Multi-Family Houses during Their Life Cycle. International Journal of Low Energy and Sustainable Buildings, 1, 1-20.
[7] Winther, B.N. and Hestnes, A.G. (1999) Solar Versus Green: The Analysis of a Norwegian Row House. Solar Energy,
66, 387-393. http://dx.doi.org/10.1016/S0038-092X(99)00037-7
[8] Citherlet, S. and Defaux, T. (2007) Energy and Environmental Comparison of Three Variants of a Family House dur-ing Its Whole Life Span. Building and Environment, 42, 591-598. http://dx.doi.org/10.1016/j.buildenv.2005.09.025
[9] Yohanis, Y.G. and Norton, B. (2006) Including Embodied Energy Considerations at the Conceptual Stage of Building Design. Power and Energy, 220, 271-288. http://dx.doi.org/10.1243/095765006X76009
[10] Fay, R., Treloar, G. and Iyer-Raniga, U. (2000) Life-Cycle Energy Analysis of Buildings: A Case Study. Building Re-search & Information, 28, 31-41. http://dx.doi.org/10.1080/096132100369073
[11] Utama, A. and Gheewala, S.H. (2008) Life Cycle Energy of Single Landed Houses in Indonesia. Energy and Buildings,
40, 1911-1916. http://dx.doi.org/10.1016/j.enbuild.2008.04.017
[12] Adalberth, K. (1997) Energy Use during the Life Cycle of Buildings: A Method. Building and Environment, 32, 317- 320. http://dx.doi.org/10.1016/s0360-1323(96)00068-6
[13] Adalberth, K. (1997) Energy Use during the Life Cycle of Single-Unit Dwellings: Examples. Building and Environ-ment, 32, 321-329. http://dx.doi.org/10.1016/s0360-1323(96)00069-8
[14] Treloar, G., Fay, R., Love, P.E.D. and Iyer-Raniga, U. (2000) Analysing the Life-Cycle Energy of an Australian Resi-dential Building and Its Householders. Building Research & Information, 28, 184-195.
http://dx.doi.org/10.1080/096132100368957
[15] QE-Pro (2010) Quantity Estimation & Project Management Software. www.softtech-engr.com
[16] DA (Development Alternatives) (1995) Energy Directory of Building Materials. Building Materials & Technology Promotion Council, New Delhi.
[17] Reddy, B.V.V. and Jagadish, K.S. (2003) Embodied Energy of Common and Alternative Building Materials and Tech- nologies. Energy and Buildings, 35, 129-137. http://dx.doi.org/10.1016/s0378-7788(01)00141-4
[19] Gupta, T.N. (1998) Building Materials in India. Building Materials & Technology Promotion Council, New Delhi.
[20] DesignBuilder-Building Design, Simulation and Visualization (2010) www.designbuilder.co.uk. [21] TERI Press (2007) TEDDY TERI Energy Data Directory and Year Book 2005-06. New Delhi.
[22] E-Quest (2009) The Quick Energy Simulation Tool. http://www.doe2.com/equest
[23] Arvind, Ch., Tiwari, G.N. and Chandra, A. (2009) Simplified Method of Sizing and Life Cycle Cost Assessment of Build- ing Integrated Photovoltaic System. Energy and Buildings, 41, 1172-1180.