© 2017, IRJET | Impact Factor value: 5.181 | ISO 9001:2008 Certified Journal
| Page 117
Effect of Laser Induced Tin Oxide (SnO
2) Nano particle
N. Ravi and R. Maridurai
Department of physics, St.Joseph’s College, Tiruchirappalli-620002, India.
[email protected] , [email protected]
---***---Abstract
-The study of Nano particles and its influence
with laser plays a major role in material characterisation. Particularly, metal oxide semiconducting materials are low cost and have significant properties in laser materials processing. Now in this study, we report the synthesis and influence of laser treated Nano powder SnO2. The laser
treated SnO2 samples were characterized by X-ray
diffraction, UV-Visible absorption, FTIR spectra, Dielectric studies, DLS spectra and SEM. From the X-ray analysis, we observed that the laser treated SnO2is with the structure of
tetragonal rutile crystalline and the crystalline size is in the range of 4-6nm. The UV-Vis spectrum confirms the presence of nanoparticles in the range 191-193 nm. The optical band gap values of SnO2 nanoparticles were
calculated about 3.5-3.8eV. Fourier Transform Infrared spectroscopy reveales, the presence of tin oxide (SnO2).The
dielectric studies of laser treated samples of SnO2 show
appreciable results compared to samples without laser irradiation. Dynamic light scattering (DLS) studies revealed that the particle size distribution of Tin oxide SnO2 nano-particles size in the range 8.8 nm - 62.5 nm.
The SEM analysis of Tin oxide (SnO2) nanoparticle also
shows that the structure is tetragonal rutile in shape. The particle size varies from 20 nm – 161.2 nm.
Key Words: Structural, Optical and Dielectric properties of SnO2 nanoparticles Laser irradiation.
1. INTRODUCTION
Metal oxide semiconductor SnO2 attracts greater
attention because of high conductivity, transparency and sensitivity. In recent years, influence of laser on semiconductors finds a newer dimension in material science. Particularly, selective laser melting is a powder based additive manufacturing capable of producing industrial applications. Currently there is a greater interest in industry for generating objects with high
geometrical complexity [1]SnO2 particles, yield wide
band gap and is mainly due to its chemical, electronic and optical properties[2 ] and also due its nano structured form[ 4 ].This material has a wide range of applications from gas sensors, liquid crystals, photovoltaic cells and conducting electrodes. In general, the band gap energy of semiconducting Nano crystals is
mainly dependent on particle size. With the use lasers on metal oxides give further enhancement in band gap energy and this can be achieved with the use of suitable laser processing parameters such as laser power, scan speed .,etc. This paper investigates, the effect of with and
without laser irradiation on SnO2nano particles with
different time exposures. The structural analysis of laser
treated samples of SnO2particles were studied using
x-ray diffraction as well as spectroscopic investigation such as UV and FTIR were also studied. Dielectric properties of the samples for various frequencies are also investigated. DLS spectra and SEM the particle size investigated.
2. EXPERIMENTAL PROCEDURE
Commercially available SnO2 powder
(Sigama-Aldrich,99.9% purity) is used for investigation (composition is given in Table-1).Laser treatments are carried out by using 5.0mw low power He-Ne gas laser with red light of (wavelength 633nm) and diode laser with green light of 5mw power (wave length 532nm).The structural analysis of with and without laser irradiated samples are analysed using PANalytical’s X-ray diffractometers(copper Kα radiation of wave length λ as A and A ).This system recorded the intensity as a function of Bragg’s angle While the average crystalline size of the particles can be estimated using full width at half maximum (FWHM) value of the x-ray diffraction peaks. The optical and spectroscopic investigation of the samples such as UV and FTIR studies
are performed using Perkin Elmer UV/VIS
spectrophotometer (λ ) and Perkin Elmer FT-IR spectrometer. The Dielectric studies are performed using Digital LCRZ Meter TH2816A (50Hz - 200KHz) with various frequencies. The DLS spectra (Measuring the Particle Size Distribution) recorded by Particulate system Nano plus Zeta/nano particle analyzer
instrument. SnO2 nano particles are analysed using SEM
© 2017, IRJET | Impact Factor value: 5.181 | ISO 9001:2008 Certified Journal
| Page 118
Table -1: chemical composition of SnO2 [image:2.595.51.237.238.382.2]Table -2: Laser processing parameters of samples
Table- 3: Properties of SnO2
3. RESULTS AND DISCUSSION
3.1 UV-Visible studies
The absorption of UV radiations on the nano powder
SnO2 sample with and without laser irradiation shows
appreciable results. From the data the band gap energy for the laser treated sample varies from 3.6eV to 3.8eV and the sample without laser irradiation is 3.5eV.The result proves that the laser influences the nano particle
SnO2 towards band gap energy, particularly for large
laser irradiation time for the both He-Ne and Diode lasers.Table-4 shows the band gap energy values for different laser irradiation with two different time exposures. Fig-1(a)- Fig-5(b) shows the UV-Visible spectrum of with and without laser irradiated samples.[2]
Fig-1(a) : UV-Vis Absorption spectra cutoff wavelength (sample 1)
Fig-1(b) : UV-Vis Absorption spectra band gap energy (sample 1)
Fig-2(a) : UV-Vis Absorption spectra cutoff wavelength (sample 2)
Fig-2(b): UV-Vis Absorption spectra band gap energy( sample 2)
Fig-3(a) : UV-Vis Absorption spectra cutoff wavelength (sample 3)
Element Content ( in % )
Tin 78.76
Oxygen 21.21
Sampl e Numb
er
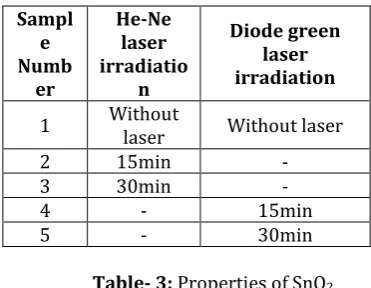
He-Ne laser irradiatio
n
Diode green laser irradiation
1 Without laser Without laser
2 15min -
3 30min -
4 - 15min
5 - 30min
Property Characteristics
Solubility acids and insoluble Soluble in alkalis, in alcohol Magnetic
susceptibility − × − cm3/mol
Density 6.95 g/cm3
[image:2.595.47.236.401.502.2]© 2017, IRJET | Impact Factor value: 5.181 | ISO 9001:2008 Certified Journal
| Page 119
Fig-3(b) :UV-Vis Absorption Spectra band gap energy(sample 3)
Fig-4(a) : UV-Vis Absorption spectra cutoff wavelength (sample 4)
Fig-4(b) :UV-Vis Absorption spectra band gap energy (sample 4)
Fig-5(a) : UV-Vis Absorption spectra cutoff wavelength (sample 5)
[image:3.595.37.556.68.799.2]Fig-5(b): UV-Vis Absorption Spectra band gap energy ( sample 5)
Table-4: Cut off wavelength and Band Gap Energy
Values For SnO2 Nanoparticles
3.2 FTIR spectral studies
The FTIR spectrum of with and without laser treated
SnO2 particles are given in Fig-6-Fig-10. [3]
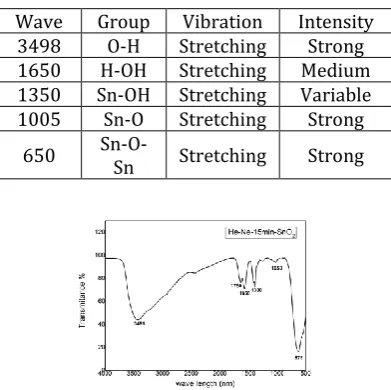
[image:3.595.352.566.173.341.2]Fig-6: FTIR spectra ( sample 1)
Table -5: FTIR functional analysis (Sample 1)
Wave Group Vibration Intensity
3498 O-H Stretching Strong
1650 H-OH Stretching Medium
1350 Sn-OH Stretching Variable
1005 Sn-O Stretching Strong
650 Sn-O-Sn Stretching Strong
Fig-7: FTIR spectra (sample 2) Sam
ple Num ber
Time duration of LASER Irradiation
(min)
Cut Off Wavelengt
h (nm)
Band gap energ
y (eV)
1 Without laser 192 3.5
2 with He-Ne laser
at 15 min 191 3.6
3 with He-Ne laser
at 30 min 191 3.8
4 with Green Diode
laser at 15 min 192.5 3.6
5 with Green Diode
[image:3.595.375.498.414.502.2] [image:3.595.340.536.548.743.2]© 2017, IRJET | Impact Factor value: 5.181 | ISO 9001:2008 Certified Journal
| Page 120
Table- 6: FTIR functional analysis (Sample 2)
Fig-8: FTIR spectra ( sample 3 ) Table-7: FTIR functional analysis (Sample 3)
Fig-9: FTIR spectra ( sample 4) Table-8: FTIR functional analysis (Sample 3)
Fig-10: FTIR spectra (sample 5 )
Table-9: FTIR functional analysis (Sample 5)
Wave Group Vibration Intensity
3499 O-H Stretching Strong
1650 H-OH Stretching Strong
1625 H-OH Stretching Strong
1450 α-CH2 Bending Strong
1100 C-N stretching Medium
675 Sn-O-Sn stretching Strong
3.3 X-Ray Diffraction Analysis
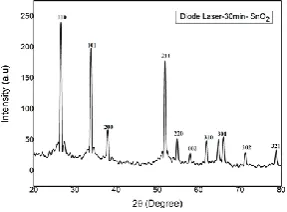
The X-ray diffraction pattern of with and without laser treated samples are shown in Fig-11 – Fig-13.
Fig- 11: XRD spectrum (sample 1)
Fig- 12: XRD spectrum (sample 3)
Wave Group Vibration Intensity
3495 O-H Stretching Strong
1750 C=O stretching Strong
1650 H-OH stretching Strong
1300 O-C stretching Medium-strong
1050 C-O stretching Strong
675 Sn-O-Sn stretching Strong
Wave Group Vibration Intensity
3498 O-H Stretching Strong
1625 H-OH stretching Strong
1600 C=C stretching Medium-weak
1000 C-N stretching Medium
700 S-OR stretching Strong
Wave Group Vibration Intensity
3498 O-H Stretching Strong
1625 H-OH stretching Strong
1600 C=C stretching Medium-weak
1000 C-N stretching Medium
© 2017, IRJET | Impact Factor value: 5.181 | ISO 9001:2008 Certified Journal
| Page 121
Fig- 13: XRD spectrum ( sample 5)From the X-ray diffraction studies, the structure of the
SnO2 nano particle observed is tetragonal rutile
structure.The average particle size (D) was determined using the Scherer’s equation [2]
D= Kλ / β COSθ,
where, D is the crystallite size, K is the shape factor, being equal to 9 , λ is the X-ray wavelength, β is the full width at half maximum of the diffraction peak, and θ is the Bragg diffraction angle in degree. The average crystallite grain size calculated using Scherrer formula of
SnO2 [4] of samples is given in Table-6
Table- 10: crystallite grain size of SnO2 samples
From Table-6 we observed that calculated grain size is 5.21nm in sample-3(He-Ne laser irteraction with time exposures of 30mins) which is slightly higher than the other samples.
3.4 Dielectric studies
The dielectric studies of laser treated nano particles
SnO2 are measured using LCRZ instrument for varies
frequency at room temperature(starting from 50Hz to 200 KHz). the corresponding effective capacitance (Cp) and effective resistance (Rp) are measured. Finally the dielectric constants, dielectric loss and ac electrical conductivity of the samples were calculated using the expression [5,6].
σac = ( f ε tan (δ) ) / (1.8 X 10¹⁰), (1)
where, f is the frequency applied field in Hz, (ε) is the dielectric constant or relative permittivity and tan(δ) is the dielectric loss tangent or loss factor.
Dielectric constant (ε)= ( Cp L ) / ( Ʃo A ), (2)
where, Cp is the measured capacitance, L is the thickness
of the sample, A is the electrode area and (ƩO) is the
permittivity of free space (8.854 X 10⁻¹² F/m).
The dielectric loss factor i e tan (δ) can be expressed by relation,
tan (δ) = ω Cp Rp , (3)
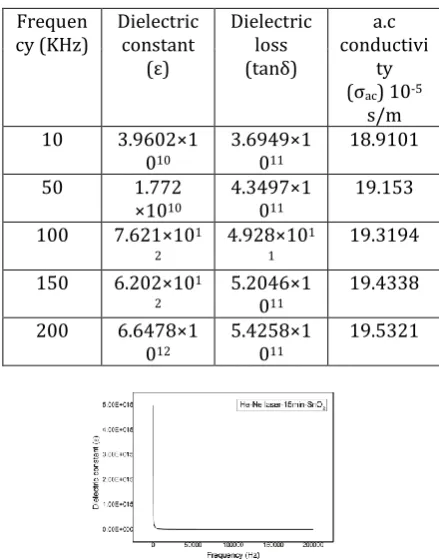
where, Cp is the measured capacitance, Rp is the measured resistance and ω is the angular frequency. From the Fig.14(a)-Fig.18(c) shows the graphical representation of dielectric constant, dielectric loss and a.c electrical conductivity.
Fig -14(a): Dieletric curve of Dielectric constant (Sample 1)
Fig -14(b): Dieletric curve of Dielectric loss (Sample - 1)
Fig -14(c): Dieletric curve of a.c electrical conductivity (Sample 1)
S.
No Sample Grain size (nm)
1 Without laser-SnO2 47.9
2 He-Ne laser-15min-SnO
2 48.2
3 He-Ne laser-30min-SnO
2 51.9
4 Diode laser-15min-SnO
2 42.1
5 Diode laser-30min-SnO
[image:5.595.46.256.459.593.2] [image:5.595.380.492.617.703.2]© 2017, IRJET | Impact Factor value: 5.181 | ISO 9001:2008 Certified Journal
| Page 122
Table -11: Dielectric studies (Sample 1)Fig-15(a): Dieletric curve of Dielectric constant (Sample 2)
Fig -16(b): Dieletric curve of Dielectric loss (Sample 3)
[image:6.595.51.271.153.433.2]Fig -16(c): Dieletric curve of a.c electrical conductivity (Sample 3)
Table-13: Dielectric studies (Sample 3)
Fig -17(a): Dieletric curve of Dielectic constant (Sample 4)
Frequen
cy (KHz) Dielectric constant (ε) Dielectric loss (tanδ) a.c conductivi ty (σac) 10-5
s/m
10 3.9602×1
010
3.6949×1 011
18.9101
50 1.772
×1010
4.3497×1 011
19.153
100 7.621×101
2
4.928×101
1
19.3194
150 6.202×101
2 5.2046×10¹¹ 19.4338
200 6.6478×1
012 5.4258×10¹¹ 19.5321
Freque ncy (KHz) Dielectric constant (ε) Dielectric loss (tanδ) a. c conductivi
ty (σac)
10-5 s/m
10 2.4496×1
013
1.5746×1 012
19.3311
50 8.1654×1
012
7.0149×1 011
19.2017
100 6.2806×1
012
5.2796×1 011
19.2653
150 5.7022×1
012
4.5827×1 011
19.338
200 5.3756×1
012 4.0719×1 011 19.386 Frequ ency (KHz) Dielectric constant (ε) Dielec tric loss (tanδ) a. c conductivity
(σac) 10-5 s/m
10 4.0827×101
3 6×102.56411 18.7647
50 1.0139×101
3 5×102.06011 18.7637
100 6.9678×101
2
2.317
2×10¹¹
18.9528
150 5.9199×101
2
2.542
9×10¹¹
19.0985
200 5.5117×101
2
2.749
4×10¹¹
19.2263 Fig-15(b): Dieletric curve of Dielectric loss (Sample 2)
[image:6.595.309.526.419.736.2] [image:6.595.92.220.467.559.2]© 2017, IRJET | Impact Factor value: 5.181 | ISO 9001:2008 Certified Journal
| Page 123
Fig -17(b): Dieletric curve of Dielectric loss(Sample 4)Fig -17(c): Dieletric curve of a.c electrical conductivity (Sample 4)
Table-14: Dielectric studies (Sample 4)
Fig -18(a): Dieletric curve of Dielectric constant (Sample 5)
Fig -18(b): Dieletric curve of Dielectric loss (Sample 5)
[image:7.595.94.223.266.370.2]Fig -18(c): Dieletric curve of a.c electrical conductivity (Sample 5)
Table-15: Dielectric studies (Sample 5)
The result shows liner decrease in dielectric constant values for increasing frequency and linear increase in
dielectric loss for laser treated SnO2 nano
particles(reverse action for without laser irradiated samples) and for a.c electrical conductivity linear increase for with and without laser irradiated samples when the frequency increases.
Freque ncy (KHz)
Dielectric constant
(Ʃ)
Dielectric loss ( tanδ)
a. c conducti
vity(σac)
10-5 s/m
10 6.6480×1
013 2.6038×10¹¹ 18.983
50 1.5446×1
013 2.3186×10¹¹ 18.9978
100 9.1181×1
012 2.4512×10¹¹ 19.094
150 7.0087×1
012 2.6512×10¹¹ 19.1899
200 6.0560×1
012 2.8531×10¹¹ 19.2833
Freq uenc y (KHz
)
Dielectric constant
(ε)
Dielectric loss (tanδ)
a.c conductivi ty (σac) 10
-5 s/m
10 2.8579×1
013
3.828×10¹⁰ 17.7838
50 9.2542×1
012
5.2574×101
0
18.1308
100 6.6412×1
012
7.1164×101
0
18.4192
150 5.8315×1
012
8.9691×101
0
18.6394
200 5.4572×1
012
1.0788×101
1
[image:7.595.362.513.282.397.2] [image:7.595.50.259.444.735.2] [image:7.595.315.527.469.676.2]© 2017, IRJET | Impact Factor value: 5.181 | ISO 9001:2008 Certified Journal
| Page 124
3.5 DLS Spectra (Measuring the Particle SizeDistribution)
The DLS spectra of with and without laser treated samples are shown in Fig-19 – Fig-21.[7]
Fig-19: DLS spectra (sample 1)
Fig-20: DLS spectra (sample 3)
Fig-21: DLS spectra (sample 5)
Dynamic light scattering (DLS) studies revealed that the
particle size distribution of Tin oxide SnO2
nano-particles are 8.8 nm(sample-1), 62.5nm(sample-3), and 59.1 nm (sample- 5).
3.6 SEM Analysis
The SEM Analysis ofwith and without laser treated samples are shown in Fig-22 – Fig-24.[4,7]
Fig-22: SEM image (sample-1)
Fig-23: SEM image (sample-3)
Fig-24: SEM image (sample-5)
SEM analysis of Tin oxide (SnO2) Nano Particle, it is
© 2017, IRJET | Impact Factor value: 5.181 | ISO 9001:2008 Certified Journal
| Page 125
observed in both SEM and XRD measurements are nearlyequal values.
Table-16: comparative study of particle size for Tin oxide (SnO2) Nanoparticle (sample 1, 3 and 5).
4. CONCLUSIONS
In this, we investigated and reported the effect of laser heat treatment (He-Ne laser and Diode laser) on nano
particles SnO2. The results observed are given below ;
i. From the UV-visible spectrum studies, we
observed thatthe band gap energy (for various laser exposures) from 3.6 eV - 3.8 eV (3.5 for sample-1 without laser irradiation).
ii. The functional groups for different peaks in
FTIR are analyzed and the type of vibration as well as intensity are studied.
iii. From the X-ray diffraction studies, the structure
of SnO2nano particle (with and without laser
irradiation) is tetragonal rutile structure.
iv. The crystallite grain size of the samples
calculated are 47.9(sample-1)
,48.5(sample-2),51.9(sample-3), 42.1(sample-4) and
43.4 nm(sample-5) were observed from the XRD studies.
v. The dielectric properties of laser treated SnO2
nano particles and their relation with frequency,dielectric constant,dielectric loss and a.c electrical conductivity are investigated.
vi. In general, when the laser power with increased
time exposure gives improved result in band gap energy and grain size structure.
vii. Dynamic light scattering (DLS) studies revealed
that the particle size distribution of Tin oxide
SnO2 nano-particles are 8.8 nm(without laser),
62.5nm(He-Ne laser treated with 30min), and 59.1 nm (Diode laser treated with30min).
viii. From SEM analysis of Tin oxide (SnO2) Nano
Particle, it is observed that the particles are in the tetragonal rutile shape within the particle
size are in the range about 20 - 161.2nm (without laser),43.91-143.9nm (He-Ne laser treated with30min), and 59.79-161.2 nm (Diode laser treatea with30min).
ix. The average particle size observed in both SEM
and XRD measurements are nearly equal values.
REFERENCES
[1] Evan T Salem “Tin Oxide Nanoparticles
Prepared Using Liquid Phase LaserAblation for
Optoelectronic Application” Nanoscience and
Nanotechnology 2012, 2(3): 86-89
[2] E.Brightlin Felcia, K.Dhinakar Gnanam
“Synthesis and Characterization of
SnO2Nanoparticle by Microwave Assisted
Hydrothermal Method” IOSR Journal of Applied Physics (IOSR-JAP) PP 98-104
[3] S.Blessi, M. Maria Lumina Sonia, S.Vijayalakshmi
and S Pauline “Preparation and characterization of SnO2 nanoparticles by hydrothermal method” International Journal of ChemTech Research ,May-June 2014 ,Vol.6, No.3, PP 2153-2155
[4] V Ratchagar, K Jagannathan “Effect of pH on
magnetic, thermal and dielectric properties of
SnO2 nanomaterials” Journal of Alloys and
Compounds 689 (2016) 1088-1095
[5] G. T. Lamdhade F. C. Raghuwanshi, R. M.
Agrawal, V M Balkhande, T Shripathi “SnO2
nanoparticles synthesis via liquid-phase
co-precipitation technique” Advanced Materials
Letters, Adv. Mater. Lett. 2015, 6(8), 738-742
[6] A. S. Lanje1, S. J. Sharma, R. B. Pode and R. S.
Ningthoujam “Dielectric study of Tin oxide nanoparticles at low temperature” Scholars Research Library, Archives of Applied Science Research, 2010, 2 (2): 127-135
[7] R. C. Abruzzi, B. A. Dedavid, M. J. R. Pires
“Characterization of tin dioxide nanoparticles
synthesized by oxidation” Cerâmica 61 (2015)
328-333
[8] Saira Riaz, Adeela Nairan and Shahzad Naseem
“Synthesis and characterization of SnO2 Nanoparticles for PV Applications” Advances in Nano, Biomechanics, Roboties, and Energy Research (ANBRE13)
SAMPLE Crystallite XRD (nm)
DLS Particle
(nm)
SEM Particle (nm)
1 47.9 8.8 2 2
3 51.97 62.5 9 9
© 2017, IRJET | Impact Factor value: 5.181 | ISO 9001:2008 Certified Journal
| Page 126
[9] I Yadroitsev, I Smurov “Surface Morphology in
Selective Laser Melting of Metal Powders” science direct 12(2011) 264-270
[10] Joseph Lik Hang Chau , Chun-Yen Chen,
Chih-Chao Yang “Facile synthesis of bimetallic nanoparticles by femtosecond laser irradiation method” Arabian Journal of Chemistry (2 ) 10, S1395–S1401.
[11] Ricardo Almeida de Matos, Thiago da Silva
Cordeiro, Ricardo Elgul Samad, Letícia Bonfante Sicchieri , Nilson Dias Vieira Júnior, Lilia
Coronato Courrol “Synthesis of silver
nanoparticles using agar–agar water solution and femtosecond pulse laser irradiation” Colloids and Surfaces A: Physicochem. Eng. Aspects 423 (2013) 58– 62
[12] Thomas Paul Dumont “Laser Interaction with
Materials From Transparent Materials to Thin Films’’ A dissertation submitted to the Swiss Federal Institute of Technology Zurich for the degree of Doctor of Natural Sciences
[13] J J Ewing, Jeff Hecht “Introduction to Laser
Technology’’ Third Edition Breck Hitz
[14] Series Popular Science & Technology “Laser and
ITS Applications”
[15] H.J. Eichler, B. Eppich, J. Fischer, R. Güther, G.G.
Gurzadyan, A. Hermerschmidt, A. Laubereau, V.A. Lopota, O. Mehl, C.R. Vidal, H. Weber, B.
Wende “Laser Physics and Applications” Sub
volume A: Laser Fundamentals Part 1
[16] Oleksiy Shulika Igor Sukhoivanov Editors
“Advanced Lasers Laser Physics and Technology for Applied and Fundamental Science”
[17] I Yadroitsev, I Smurov “Slective Laser Melting
Technology from the single Laser Melted track stability to D parts of complex shape” physics procedia 2010,pp.551-560
[18] Thenmozhi. C, Manivannan.V, Kumar.E and
Veera Rethina Murugan S “Synthesis and
Characterization of SnO2 and Pani doped SnO2
nanoparticles by Microwave assisted solution method” International Research Journal of Engineering and Technology (IRJET), Volume: 02 Issue: 09 | Dec-2015
[19] Paull, John (2 ), “Nanotechnology”: No Free
Lunch, Platter, 1(1) 8-17
[20] L.I.Nadaf, K S Venkatesh “Synthesis and
Characterization of Tin Oxide Nanoparticles by Co-precipitation Method” IOSR Journal of