NOV-DEC, 2015, VOL-3/21 www.srjis.com Page 1141
A STUDY OF INTERRELATIONSHIP BETWEEN HUMIDITY AND EQUILIBRIUM
MOISTURE CONTENT OF WOODS
Deepti Rani, Ph.D
Associate Professor in the Department of Physics, MMH College, Ghaziabad
The present study has been conducted to highlight the impact of change in relative humidity on the moisture contents of different kind of woods. Quite often, one finds that the doors and window frames exhibit different dimensions in the month of rainy seasons and hot summers. Such problems are more prominent in the areas witnessing significant changes in relative humidity level over the entire year period as compared to those where relative humidity remain in a constant range throughout the year. The engineers and interior decorators are therefore required to take into consideration this behavior of wood while using wood for constructing furniture, wooden floors and ceiling ,etc. to prevent any deformity in the structure at a later date. Preventive measures such as leaving gaps between two adjacent pieces of woods or filling up with some other material may be used to deal with this kind of problem. Further, the amount of dimensional change also varies with the kind of wood being used. The study has been conducted in Delhi-NCR region which faces phenomenal changes in the relative humidity level in one year time and therefore many people experiences such problem in their wooden doors and windows. Under this study, different pieces of Teak and Black Oak wood having same dimensions were exposed to varying level of relative humidity in different months and the change in their dimensions were recorded. Statistical tests – t-test and ANOVA were used to test the statistical differences in the dimensions and inferences have been drawn. Based on the observations, meaningful conclusion and suggestions have been made.
Introduction
In this study, a relationship between humidity level and change in equilibrium moisture content
of wood has been studied. The study would be helpful in understanding the expansion and
contraction of wooden structure due to change in humidity level and temperature and Scholarly Research Journal's is licensed Based on a work at www.srjis.com
NOV-DEC, 2015, VOL-3/21 www.srjis.com Page 1142 accordingly ensuring proper measure to prevent any loss arising due to it. The prior knowledge
of equilibrium moisture content enable us to assess the possible contraction and expansion in the
size of wood intended to be used for construction purpose. The moisture content of wood is
related to the relative humidity of the air around it. It has been observed that , higher the relative
humidity the greater would be the moisture content of the wood. It is due to this reason that the
recent bought wood is allowed to dry up in the area where it is intended to be used. It allows the
material to reach its equilibrium moisture content level with the air. For example, if wood at 15%
MC is exposed to 40% RH, the wood will dry to 5% MC (and shrink as it dries). The EMC helps
us understand the response wood will have to relative humidity, whether it will shrink or expand.
For woodworkers and carpenters, the EMC is more helpful than RH.
Objective and Basis of the study
As we know, wood is a hygroscopic material as a result of which its moisture content fluctuates
with the change in level of relative humidity (RH)of the surrounding air. When humidity
increases, the moisture content increases and the wood expands. Similarly, when humidity
decreases , the moisture content decreases and the wood contracts. In the normal course, we have
observed that a fresh piece of wood from the trees has higher moisture content. But, gradually
when it is left to dry under sunlight, it tend to lose moisture content and the size of the piece also
get shrink. This tendency of wood therefore can be associated with the change in relative
humidity because when moisture content is low , relative humidity is low and when relative
humidity is high , moisture content is high. The extent to which a wood reacts to change in level
of relative humidity depends on its nature. With this background, different type of woods were
collected and exposed to different levels of relative humidity at different point of time. The
dimensions of the wood were observed before and after they are exposed to different level of
relative humidity.
Hypothesis of the study
The study has been conducted to examine the impact of different levels of relative humidity on
the dimensions of the wood. It has also been observed that the impact of relative humidity also
varies depending upon the species of the wood. In other words, different type of woods exhibit
different type of dimensional change for a given change in the level of relative humidity. In view
NOV-DEC, 2015, VOL-3/21 www.srjis.com Page 1143 Null Hypothesis 1: The change in relative humidity has no impact on the equilibrium moisture
content of woods and hence dimensions of the wood.
Null Hypothesis 2: The change in dimension of one species of wood is not significantly different
from the changes observed in other species of wood for any change in relative humidity level.
Procedure of the study
In order to conduct the study, two different species of wood namely – Teak and Black Oak , were
taken . Ten pieces of the dimensions 24cm X 52 cm from the core part and outer part of the
stems were cut out from the different lumps of wood and exposed under different levels of
relative humidity. The length and breadth of these forty pieces of wood were observed and
recorded. Each pieces were coded to ensure their identification during the course of entire
experiment. Among the different species of wood available , these two species were taken
because it has been the experience of the users of the wood that the impact of change in relative
humidity on Black Oak is relatively more as compared to that of Teak. The readings of relative
humidity has been observed using MCP Digital Room thermometer with humidity indicator. The
period during which these reading were observed are the month of May, 2015 (when Relative
humidity is around 31to 36) and August, 2015 (when relative humidity is around 70 to 76) in
Delhi NCR region. The readings observed with regard to their dimensions under different
humidity levels and the changes observed in case of Teak wood and Black Oak are given below
in table 1 and 2 respectively.
Teak Wood
Outer Part Core Part
S.No. When RH
73
When RH
33
%
Change
When RH
73
When RH
33
%
Change
1 24 23.1 3.75 23.9 22.6 5.44
2 23.8 22.9 3.78 23.7 22.3 5.91
3 23.6 22.7 3.81 23.8 22.5 5.46
4 24.1 23 4.56 24 22.9 4.58
5 24.2 23.1 4.55 24.1 23.1 4.15
6 52 51.1 1.73 52.1 50.8 2.50
7 52.1 51.2 1.73 52 50.9 2.12
NOV-DEC, 2015, VOL-3/21 www.srjis.com Page 1144
9 52.3 51.2 2.10 52.2 51.1 2.11
10 51.9 50.9 1.93 51.1 50.1 1.96
11 52.2 51.2 1.92 52.1 51 2.11
Table1: Change in dimensions of different pieces of Teak wood
BLACK OAK
OUTER PART CORE PART
S.No. When RH
73
When RH 33
% Change
When RH 73
When RH 33
% Change
1 24 22.2 7.50 24 22 8.33
2 23.9 21.9 8.37 23.8 21.6 9.24
3 23.6 21.7 8.05 23.7 21.4 9.70
4 24.1 22.1 8.30 23.9 21.6 9.62
5 23.8 22 7.56 24.1 22.1 8.30
6 52 50.6 2.69 52 50.4 3.08
7 51.9 50.7 2.31 52.1 50.6 2.88
8 51.8 50.6 2.32 51.8 50.4 2.70
9 51.7 50.6 2.13 51.7 50.2 2.90
10 51.8 50.4 2.70 51.6 50 3.10
11 52 50.8 2.31 52 50.4 3.08
Table 2: Change in dimensions of different pieces of Black Oak wood
As can be observed from the data above, the change in relative humidity level results in change
in dimensions of different pieces of wood. Though the humidity has been around in the range of
70 to 76 during the month of August and in the range of 30 to 36 in the month of May , however,
mean level of humidity has been taken into consideration. The change was found to be more
significant in case of pieces taken out from the core part as compared to the those taken from
outer part. Further, the difference was also observed in respect of species of the wood. The
impact of contraction and expansion was observed to be more in case of Black Oak as compared
to Teak wood.
Using the above data, following statistical tests were employed to test the hypotheses under
study :
a) Statistical t-test to test the statistical differencebetween change in core part wood and the
NOV-DEC, 2015, VOL-3/21 www.srjis.com Page 1145
b) ANOVA test to test the significant difference between change observed in all four
different sets of woods under study.
The output obtained from SPSS package in respect of t-test for core part and outer part of Teak
wood is given below in table 3
Group Statistics
Type N Mean Std.
Deviation Std. Error Mean TeakWood Teak Wood (Outer)
10 2.987359 1.2018124 .3800464
Teak Wood (Central)
10 3.652835 1.6133418 .5101835
Table 3 : SPSS output of T-test for Teak Wood
It can be observed from the above that mean and standard deviation for outer part is 2.98 and
1.20 respectively and it is quite different from the mean and standard deviation of the core part
which was 3.65 and 1.61 respectively. However, to examine if the difference are statistically
significant different or not ,Levene’s test has been used and its output is given below in table 4.
Independent Samples Test
Levene's
Test for
Equality of
Variances t-test for Equality of Means
F
Sig
. t Df
Sig. (2-taile d) Mean Differen ce Std. Error Differen ce
95% Confidence Interval of the Difference
Lower Upper
TeakWo od Equal varianc es assume d 3.63 8 .07 3 -1.04 6
18 .309
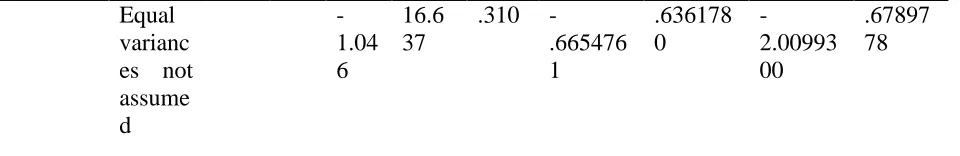
NOV-DEC, 2015, VOL-3/21 www.srjis.com Page 1146 Equal
varianc es not assume d
-1.04 6
16.6 37
.310
-.665476 1
.636178 0
-2.00993 00
[image:6.612.69.549.72.150.2].67897 78
Table 4 : SPSS output of Levene’s-test for Teak Wood
From the value obtained under Levene’s Test for equality of variance, ,we can observe that sig
level is 0.07 which is more than 0.05 implying that that the variability in the two segments is not
significantly different from each other. Thus, we can accept the null hypothesis that there is no
significant difference between the change in dimensions of the core part and outer part of the
teak wood if these have been cut out from the same tree.
Similar, test were conducted for the Black Oak wood, and its output are given in table 5 and 6
respectively.
Group Statistics
TypeWood N Mean Std.
Deviation
Std. Error Mean
BlackOak
Black Oak (Outer)
10 5.193224 2.9298947 .9265141
Black Oak (Central)
10 5.986469 3.2534747 1.0288390
Table 5 : SPSS output of T-test for Black Oak Wood
It can be observed from the above that mean and standard deviation for outer part is 5.19 and
2.92 respectively and it is quite different from the mean and standard deviation of the core part
which was 5.98 and 3.25 respectively. However, to examine if the difference are statistically
significant different or not ,Levene’s test has been used and its output is given below in table 6.
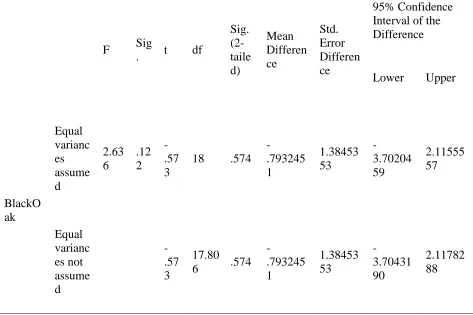
Independent Samples Test
Levene's Test for Equality of
Variances
NOV-DEC, 2015, VOL-3/21 www.srjis.com Page 1147
F Sig
. t df
Sig. (2-taile d) Mean Differen ce Std. Error Differen ce 95% Confidence Interval of the Difference
Lower Upper
BlackO ak Equal varianc es assume d 2.63 6 .12 2 -.57 3
18 .574
-.793245 1 1.38453 53 -3.70204 59 2.11555 57 Equal varianc es not assume d -.57 3 17.80
6 .574
[image:7.612.70.543.80.395.2]-.793245 1 1.38453 53 -3.70431 90 2.11782 88
Table 6 : SPSS output of Levene’s-test for Teak Wood
From the value obtained under Levene’s Test for equality of variance, ,we can observe that sig
level is 0.122 which is more than 0.05 implying that that the variability in the two segments is
not significantly different from each other. Thus, we can accept the null hypothesis that there is
no significant difference between the change in dimensions of the core part and outer part of the
Black Oak wood if these have been cut out from the same tree. However, to ascertain if change
in relative humidity can have different impact on different species of wood, ANOVA test has
been used with the help of SPSS. For the purpose of inferring on the basis of ANOVA, the
assumption of normality of data and homogeneity of variances has been checked using K-S test
and Levene’s test respectively. Finally, Post - hoc analysis using multiple comparison and mean
plot has been used to find the areas in which differences are significant.
The assumption of normality of data has been examined using one sample Kolmogorov-Smirnov
NOV-DEC, 2015, VOL-3/21 www.srjis.com Page 1148
One-Sample Kolmogorov-Smirnov Test
WOOD TYPE
N 40 40
Normal Parametersa,b
Mean 4.4550 2.50
Std. Deviation 2.61076 1.132
Most Extreme Differences
Absolute .198 .171
Positive .198 .171
Negative -.148 -.171
Kolmogorov-Smirnov Z 1.252 1.079
Asymp. Sig. (2-tailed) .007 .195
[image:8.612.132.481.77.275.2]a. Test distribution is Normal.
Table 7: SPSS output for K-S Test ( Testing Normality of the data)
As can be observed from above calculation , p-value (Asymp. Sig) is less than .05 , therefore, we
can concluded that our data complies with the condition of normality . In order to test the
homogeneity of variances among the change in dimensions ,Levene statistic has been calculated
using SPSS , as shown below in table 8:
Levene
Statistic df1 df2 Sig.
[image:8.612.184.431.371.421.2]55.530 3 36 .000
Table 8 : SPSS output of Test of Homogeneity of Variances
Since the Levene statistic is greater than 0.05 we therefore conclude that the variability among
the readings observed are significantly different. Once , it is ensured that the test of homogeneity
of variance and normality of data are complied, ANOVA test has employed and the output
obtained is given below in table 9:
Sum of Squares df
Mean
Square F Sig.
Between
Groups 56.878 3 18.959 3.267 .032
Within
Groups 208.949 36 5.804
Total 265.828 39
[image:8.612.115.505.531.687.2]NOV-DEC, 2015, VOL-3/21 www.srjis.com Page 1149 It can be observed from the output that p value (Sig.) is less than .05 ,it implies our null
hypothesis is rejected which means there is significant difference between the change in
dimensions of different set of woods under study . The difference among these value which have
been observed can be concluded to have occurred due to different impact on the equilibrium
moisture content of various species of wood.
In order to ascertain difference of each set of reading vis-à-vis other sets of readings , multiple
comparison test was conducted and its output is given in table 10
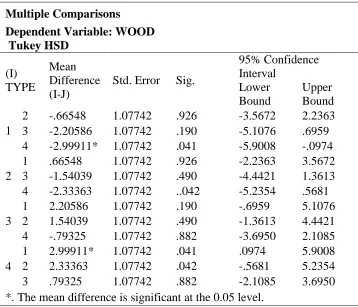
Multiple Comparisons
Dependent Variable: WOOD Tukey HSD
(I) TYPE
Mean Difference (I-J)
Std. Error Sig.
95% Confidence Interval
Lower Bound
Upper Bound
1
2 -.66548 1.07742 .926 -3.5672 2.2363
3 -2.20586 1.07742 .190 -5.1076 .6959
4 -2.99911* 1.07742 .041 -5.9008 -.0974
2
1 .66548 1.07742 .926 -2.2363 3.5672
3 -1.54039 1.07742 .490 -4.4421 1.3613
4 -2.33363 1.07742 ..042 -5.2354 .5681
3
1 2.20586 1.07742 .190 -.6959 5.1076
2 1.54039 1.07742 .490 -1.3613 4.4421
4 -.79325 1.07742 .882 -3.6950 2.1085
4
1 2.99911* 1.07742 .041 .0974 5.9008
2 2.33363 1.07742 .042 -.5681 5.2354
3 .79325 1.07742 .882 -2.1085 3.6950
*. The mean difference is significant at the 0.05 level.
[image:9.612.126.484.215.522.2]Here Type 1 refers outer part of teak wood, Type 2 refers central part of teak wood, Type 3 refers outer part of Black Oak wood and Type 4 refers central part of Black Oak wood.
Table 10 : SPSS output of Multiple Comparisons ( Post Adhoc Analysis)
It can be observed from the above data that significant differences occurred when the part of
woods happened to be from different species. However, in most of the cases difference were not
found to be very significantly different as significance values were greater than 0.05. The same
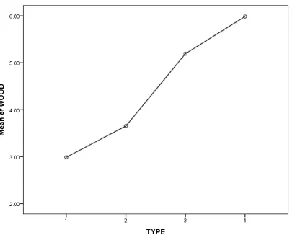
NOV-DEC, 2015, VOL-3/21 www.srjis.com Page 1150
Figure 1 : SPSS output of Mean Plot ( Post Adhoc Analysis)
CONCLUSION
The impact of change in relative humidity on the moisture content and hence the dimensions of
the wood has been theoretically discussed in many research papers. However, to examine this
fact , statistical test has been employed and it was found the impact of is more visible if the wood
species are different whereas if the part of wood happens to be cut out from the same tree or
specie , the impact of change in relative humidity on different sets of wood is very nominal and
it is not found to be statistically different. This implies a furniture made up of entirely from the
same species of wood shall be preferred over the ones made up of different woods. The ability to
withstand the change in relative humidity level in such cases is relatively more than the cases
where different species of wood have been used for any construction purpose.
References
Hoadley, R.B., “As dries the air, so shrinks the wood,”Fine Woodworking, The Taunton Press,
39(2):92–95.
LEE, W., AND E. J. BIBLIS. 1976. Hygroscopic properties and shrinkage of southern yellow
pine plywood. Wood Fiber 8(3): 152-158.
Forest Products Laboratory. 1972. Methods of controlling humidity in woodworking plants.
Res. Note FPL–RN– 0218. Madison, WI: U.S. Department of Agriculture, Forest
Service.
Rietz, R.C. 1978. Storage of lumber. Agric. Handb. 531. Washington, DC: U.S. Department of
Agriculture.
William T. Simpson ‘Drying and Control of Moisture Content and Dimensional Changes’
chapter 12 from Forest Products Laboratory. 1999. Wood handbook—Wood as an
engineering material Gen. Tech. Rep. FPL–GTR–113. Madison, WI: U.S. Department of