J U L Y 1 9 9 4
WRL
Technical Note TN-44
ATOM:
A Flexible Interface
for Building High
Performance Program
Analysis Tools
Alan Eustace
The Western Research Laboratory (WRL) is a computer systems research group that was founded by Digital Equipment Corporation in 1982. Our focus is computer science research relevant to the design and application of high performance scientific computers. We test our ideas by designing, building, and using real systems. The systems we build are research prototypes; they are not intended to become products.
There is a second research laboratory located in Palo Alto, the Systems Research Cen-ter (SRC). Other Digital research groups are located in Paris (PRL) and in Cambridge, Massachusetts (CRL).
Our research is directed towards mainstream high-performance computer systems. Our prototypes are intended to foreshadow the future computing environments used by many Digital customers. The long-term goal of WRL is to aid and accelerate the development of high-performance uni- and multi-processors. The research projects within WRL will address various aspects of high-performance computing.
We believe that significant advances in computer systems do not come from any single technological advance. Technologies, both hardware and software, do not all advance at the same pace. System design is the art of composing systems which use each level of technology in an appropriate balance. A major advance in overall system performance will require reexamination of all aspects of the system.
We do work in the design, fabrication and packaging of hardware; language processing and scaling issues in system software design; and the exploration of new applications areas that are opening up with the advent of higher performance systems. Researchers at WRL cooperate closely and move freely among the various levels of system design. This allows us to explore a wide range of tradeoffs to meet system goals.
We publish the results of our work in a variety of journals, conferences, research reports, and technical notes. This document is a technical note. We use this form for rapid distribution of technical material. Usually this represents research in progress. Research reports are normally accounts of completed research and may include material from earlier technical notes.
Research reports and technical notes may be ordered from us. You may mail your order to:
Technical Report Distribution
DEC Western Research Laboratory, WRL-2 250 University Avenue
Palo Alto, California 94301 USA
Reports and notes may also be ordered by electronic mail. Use one of the following addresses:
Digital E-net: JOVE::WRL-TECHREPORTS
Internet: [email protected]
UUCP: decpa!wrl-techreports
ATOM: A Flexible Interface for Building
High Performance Program Analysis Tools
Alan Eustace
Amitabh Srivastava
Abstract
Code instrumentation is a powerful mechanism for understanding program behavior. Unfortunately, code instrumentation is extremely dif-ficult, and therefore has been mostly relegated to building special purpose tools for use on standard industry benchmark suites.
ATOM (Analysis Tools with OM) provides a very flexible and efficient code instrumentation interface that allows powerful, high performance program analysis tools to be built with very little effort. This paper il-lustrates this flexibility by building five complete tools that span the interests of application programmers, computer architects, and compiler writers.
The first tool reports the number of bytes read by the application. The second tool is an instruction profiler that computes the number of instruc-tions executed in each procedure as a percentage of the total number of in-structions executed. The third tool simulates the execution of the application running in a direct mapped data cache and reports hit and miss data. The fourth tool computes the total amount of memory allocated and deallocated by the application. The final tool isolates potential compiler performance bugs. Each tool is written in between 24 and 60 lines of code.
1
Introduction
Program analysis tools are extremely important for understanding program behavior. Computer architects need such tools to evaluate how well programs will perform on new architectures. Software writers need tools to analyze their programs and identify critical pieces of code. Compiler writers often use such tools to determine how well their instruction scheduling or branch prediction algorithm is performing or to provide input for profile-driven optimizations.
Over the past decade three classes of tools for different machines and applications have been developed. The first class consists of basic block counting tools like Pixie[13], Epoxie[22] and QPT[11]. The second class consists of data and instruction address tracing tools. Pixie and QPT can also generate address traces. They communicate these traces to analysis routines through inter-process communication. Tracing on the WRL Titan[3] communicated with analysis routines using shared memory, but this required operating system modifications. MPTRACE [6] is similar to Pixie but it collects traces for multiprocessors by instrumenting assembly code. ATUM [1] generates address traces by modifying microcode and saves a compressed trace in a file that is analyzed offline. The third class of tools consists of simulators. Tango Lite[7] supports multiprocessor simulation by instrumenting assembly language code. PROTEUS[4] also supports multiprocessor simulation but instrumentation is done by the compiler. g88[2] simulates Motorola 88000 using threaded interpreter techniques. Shade[5] uses instruction level simulation to selectively generate traces. This technique offers considerable flexibility at the expense of much lower performance.
The important features that distinguish ATOM[18, 15, 16] from previous systems are listed below.
ATOM is a tool-building system. A diverse set of tools ranging from basic block counting
to cache modeling can be easily built.
ATOM provides the common infrastructure in all code-instrumenting tools, which is the
cumbersome part. The user simply specifies the tool details.
ATOM allows selective instrumentation. The user specifies the points in the application to
be instrumented, the procedure calls to be made, and the arguments to be passed.
The communication of data is through procedure calls. Information is directly passed
through interprocess communication, files on disk, or a shared buffer with central dispatch mechanism.
ATOM tool overhead is proportional to the complexity of the underlying analysis. Many
interesting tools can be built that have little or no impact on application performance.
Even though the analysis routines run in the same address space as the application, precise
information about the application is presented to analysis routines at all times.
As ATOM works on object modules, it is independent of compiler and language systems.
To illustrate the power and flexibility of this approach, this paper fully implements a variety of custom program analysis tools, including input/output, instruction profiling, cache simulation, dynamic memory allocation, procedure inlining profile driven optimizations, and evaluating the quality of compiled code. None of these tools takes more than 60 lines of code to implement. These tools form the basis of many of the tools that are distributed as part of the standard ATOM distribution.
To illustrate the performance of these tools, each was applied to the SPEC92 tool suite. The instrumented application times are compared to the uninstrumented applications using wall clock times.
2
Implementation of ATOM
ATOM is built using OM[19, 20, 21], a link-time code modification system.
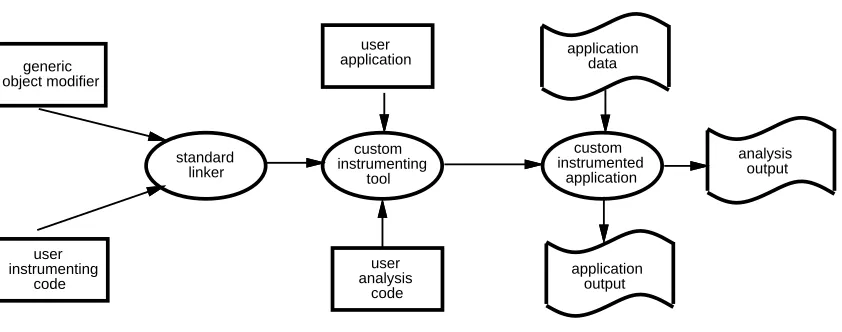
Figure 1 describes this process. First, the OM generic object modification library is linked with a tool specific instrumentation file to produce a custom instrumenting tool. This program reads in the user application, and modifies it by adding calls to tool specific analysis procedures. ATOM completes the process by linking the instrumented application with the tool specific analysis file. The output of ATOM is a custom instrumented application executable that is run in exactly the same manner as the original application.
3
A Simple Example
application data
application output
analysis output standard
linker
custom instrumenting tool
custom instrumented application user
application
user analysis code generic
object modifier
[image:7.612.116.537.136.302.2]user instrumenting code
Figure 1: The ATOM Process atom appl.rr read.inst.c read.anal.c -o appl.read
The first argument is the application program, which has been specially linked to include relocation records. The second and third arguments are the instrumentation and analysis files. In this example, we instrument the application to count and write to a file the total number of bytes read each time the instrumented application is executed.
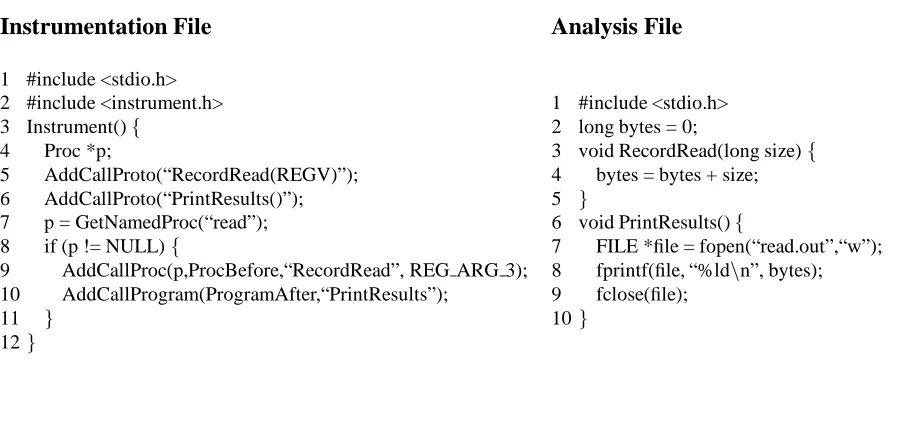
The instrumentation file is shown of the left side of Figure 2. Line 2 includes the instrument.h file which defines the ATOM primitives for manipulating application programs. Line 3 defines theInstrumentprocedure, which is linked with the OM object code modification library to produce a custom instrumenting tool. All analysis procedures that are called from the application program are declared and placed by theInstrumentprocedure.
Line 5 makes use of theAddCallProtoATOM primitive to declare the name and arguments to theRecordReadanalysis procedure. This procedure takes a single argument of typeREGV. Arguments of typeREGV are used to pass the contents of a specific processor register. Line 6 declares thePrintResultanalysis procedure, which does not take any arguments.
Instrumentation File Analysis File
1 #include <stdio.h> 2 #include <instrument.h> 3 Instrument()f
4 Proc *p;
5 AddCallProto(“RecordRead(REGV)”); 6 AddCallProto(“PrintResults()”); 7 p = GetNamedProc(“read”); 8 if (p != NULL)f
9 AddCallProc(p,ProcBefore,“RecordRead”, REG ARG 3); 10 AddCallProgram(ProgramAfter,“PrintResults”);
11 g
12g
1 #include <stdio.h> 2 long bytes = 0;
3 void RecordRead(long size)f
4 bytes = bytes + size; 5 g
6 void PrintResults()f
7 FILE *file = fopen(“read.out”,“w”); 8 fprintf(file, “%ldnn”, bytes);
[image:8.612.96.546.102.314.2]9 fclose(file); 10g
Figure 2: Read Tool Implementation
Line 9 uses the ATOM primitiveAddCallProcto add a call to thereadprocedure. The first argument,pis a pointer to thereadprocedure. The second argument,ProcBefore, specifies that the call is to be inserted before thereadprocedure is executed. The third argument indicates that the call is to theRecordReadanalysis procedure. The remainder of the arguments are used to determine what values ATOM passes toRecordRead. In this case, the final argument passes the contents of the register REG ARG 3 to the analysis procedure. In the Alpha AXP calling convention, this register contains the contents of the third argument to thereadprocedure. The
RecordReadprocedure is shown on the right side of Figure 2. This procedure simply adds this size to a total.
Line 10 calls the AddCallProgramprimitive, which adds a call to thePrintResults
procedure after the application finishes executing. The corresponding analysis procedure opens a file, prints out the result, and closes the file. The definitions for both these procedures are shown on the right side of Figure 2.
Although this tool is relatively simple, it is straightforward to extend the read tool into a general input/output tool. The first extension is to add calls to analysis procedures before and after foropen system calls. This allows the analysis procedures to record the name of the file opened and the file descriptor returned. By instrumenting both read and write procedures and passing the first (file descriptor) and third arguments (size in bytes), the read and write totals can be accumulated for each open file. The final extension is to use the Alpha AXP cycle counter to maintain fine grain times of how long each operation takes. This allows the tool to determine the rate of read and write operations. This extended tool is called io and is distributed with ATOM as part of the standard tool set.
4
ATOM Primitives
ATOM tools traverse an application, find interesting places to add calls to analysis procedures, and pass arguments that correspond to data or events in the application. To provide these functions, ATOM provides three types of primitives: navigation, information, and instrumentation.
Navigation primitives traverse the application. The simple example presented above used the
GetNamedProcprimitive to find a specific procedure. Other navigational primitives traverse procedures, basic blocks within procedures, and instructions within basic blocks. A basic block is a set of sequential assembly language instructions that are not interrupted by branch or jump instructions.
Information primitives provide static information about instructions, basic blocks, procedures, or the program. For example, given an instruction, ATOM primitives can return the program counter, the opcode, the instruction class, address displacements, the source line number, a mask of the registers used or set by the instruction, etc. Given a basic block, primitives are provided to find the number of instructions in the basic block and the starting program counter of the block. Given a procedure, primitives are provided to find the file name, stack frame size, register save and restore masks, etc. General program information includes the sizes of text and data sections, along with general statistics on the number of procedures, basic blocks and procedures in the application.
strings.
Although not shown in these examples, ATOM also allows command line arguments to be passed to instrumentation routines. Parameters can also be passed to analysis procedures through
setenv variables.
5
Instruction Profiling
In this section we implement an instruction profiler based on counting the number of instructions executed in each procedure. Although it is possible to implement this tool by placing a call to an analysis procedure before every instruction in the application, ATOM’s selective instrumentation can significantly reduce this overhead by instrumenting only basic blocks. For example, if a set of 10 sequential executed instructions are inside of a loop, we can keep track of the total number of instructions executed by adding 10 each time we enter the loop body.
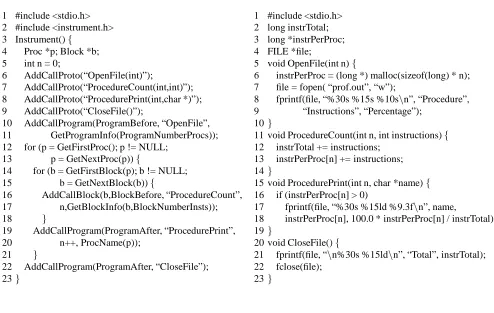
Figure 3 defines the instrumentation and analysis files for the profile tool.
As in the previous section, lines 6 through 9 of the instrumentation file declares the interface to the OpenFile, ProcedureCount, ProcedurePrint, and CloseFile analysis procedures.
In line 10, the AddCallProgram primitive is used to add a call to OpenFile before the application begins execution. The GetProgramInfoATOM primitive, when passed the
ProgramNumberProcsargument, returns the number of procedures in the application. The corresponding analysis procedure uses this argument to allocate sufficient memory to accumulate a count for each procedure in the application.
Lines 12 through 21 navigate each procedure in the application. Within each procedure, lines 14 through 18 process each basic blocks. Line 16 calls theAddCallBlockATOM primitive to add a call to the ProcedureCountanalysis procedure. The two arguments passed are a procedure indexn, and the number of instructions in the basic block. This value is returned by theGetBlockInfoprimitive. The corresponding analysis procedure uses these arguments to increment the number of instructions executed by this procedure.
Instrumentation File Analysis File
1 #include <stdio.h> 2 #include <instrument.h> 3 Instrument()f
4 Proc *p; Block *b; 5 int n = 0;
6 AddCallProto(“OpenFile(int)”);
7 AddCallProto(“ProcedureCount(int,int)”); 8 AddCallProto(“ProcedurePrint(int,char *)”); 9 AddCallProto(“CloseFile()”);
10 AddCallProgram(ProgramBefore, “OpenFile”, 11 GetProgramInfo(ProgramNumberProcs)); 12 for (p = GetFirstProc(); p != NULL;
13 p = GetNextProc(p))f
14 for (b = GetFirstBlock(p); b != NULL; 15 b = GetNextBlock(b))f
16 AddCallBlock(b,BlockBefore, “ProcedureCount”, 17 n,GetBlockInfo(b,BlockNumberInsts)); 18 g
19 AddCallProgram(ProgramAfter, “ProcedurePrint”, 20 n++, ProcName(p));
21 g
22 AddCallProgram(ProgramAfter, “CloseFile”); 23g
1 #include <stdio.h> 2 long instrTotal; 3 long *instrPerProc; 4 FILE *file;
5 void OpenFile(int n)f
6 instrPerProc = (long *) malloc(sizeof(long) * n); 7 file = fopen( “prof.out”, “w”);
8 fprintf(file, “%30s %15s %10snn”, “Procedure”,
9 “Instructions”, “Percentage”); 10g
11 void ProcedureCount(int n, int instructions)f
12 instrTotal += instructions; 13 instrPerProc[n] += instructions; 14g
15 void ProcedurePrint(int n, char *name)f
16 if (instrPerProc[n] > 0)
17 fprintf(file, “%30s %15ld %9.3fnn”, name,
18 instrPerProc[n], 100.0 * instrPerProc[n] / instrTotal); 19g
20 void CloseFile()f
21 fprintf(file, “nn%30s %15ldnn”, “Total”, instrTotal);
[image:11.612.94.588.126.439.2]22 fclose(file); 23g
Figure 3: Profiling Tool Implementation
procedures to the end of the program, each with a different index and character string.
Line 22 adds a call to the CloseFile analysis procedure after the application completes executing.
Although this is a very simple profiling tool, many more interesting tools can be built using the same principles. Russell Kao built an ATOM based version of the popular tool gprof. This tool adds procedure calls at the start of each procedure to push the name of the procedure on a procedure call stack. This stack is popped by adding a similar analysis procedure call to the procedure exit. Gprof reports the percentage of time spent in a procedure and the procedures descendants. The instrumentation procedure was also expanded to use the Alpha AXP dual issue rules to compute cycles rather than instructions executed.
6
Cache Simulator
Processor cycle times are getting faster at a much greater rate than main memory access times. This disparity has led computer architects to place a subset of main memory into one or more levels of fast, expensive cache memory [9]. The effectiveness of this technique is application dependent. Applications that reference the same address multiple times or that use nearby data items benefit most from the data cache.
Although it is clear that cache memory plays an increasingly important role in application performance, measuring cache performance has been relegated to a few industrial and university research reports. Almost all of these studies have focused primarily on the performance of the SPEC92 benchmark suite.
This section presents a simple tool that simulates the execution of the application running in a 64K-byte direct mapped data cache with 32-byte blocks. The tool computes the total number of data cache references, the number of misses, and the miss rate. The miss rate is the number of misses divided by the number of references.
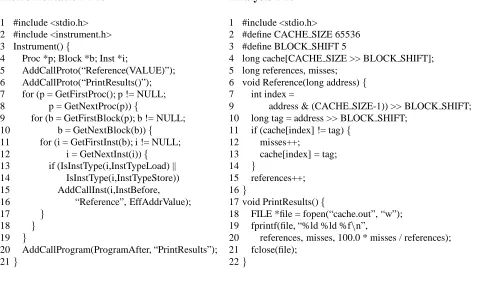
The strategy used in this tool is to instrument all load and store instructions with a call to an analysis procedure calledReferencewhich is passed the effective address. This effective address is used to simulate the application running in the cache. The cache tool implementation is shown in Figure 4.
Line 5 of the instrumentation file declares the Reference analysis procedure. The type
VALUEindicates that the argument does not live in a processor register, but must be computed by ATOM prior to passing the value to the analysis procedure. Lines 11 through 17 examine each instruction. Lines 13 and 14 determine if the instruction is a load or a store. If so, the
AddCallInstATOM primitive adds a call to instructioni. TheInstBeforeargument adds the call before the instruction. The name of the analysis procedure to call isReference, and the argument passed is theEffAddrValue, which ATOM computes by adding the contents of the base register plus the sign extended displacement. Line 20 completes the tool by adding a call to thePrintResultsprocedure after the application completes execution.
Instrumentation File Analysis File
1 #include <stdio.h> 2 #include <instrument.h> 3 Instrument()f
4 Proc *p; Block *b; Inst *i;
5 AddCallProto(“Reference(VALUE)”); 6 AddCallProto(“PrintResults()”); 7 for (p = GetFirstProc(); p != NULL; 8 p = GetNextProc(p))f
9 for (b = GetFirstBlock(p); b != NULL; 10 b = GetNextBlock(b))f
11 for (i = GetFirstInst(b); i != NULL; 12 i = GetNextInst(i))f
13 if (IsInstType(i,InstTypeLoad) || 14 IsInstType(i,InstTypeStore)) 15 AddCallInst(i,InstBefore, 16 “Reference”, EffAddrValue); 17 g
18 g
19 g
20 AddCallProgram(ProgramAfter, “PrintResults”); 21g
1 #include <stdio.h>
2 #define CACHE SIZE 65536 3 #define BLOCK SHIFT 5
4 long cache[CACHE SIZE >> BLOCK SHIFT]; 5 long references, misses;
6 void Reference(long address)f
7 int index =
9 address & (CACHE SIZE-1)) >> BLOCK SHIFT; 10 long tag = address >> BLOCK SHIFT;
11 if (cache[index] != tag)f
12 misses++;
13 cache[index] = tag; 14 g
15 references++; 16g
17 void PrintResults()f
18 FILE *file = fopen(“cache.out”, “w”); 19 fprintf(file, “%ld %ld %fnn”,
20 references, misses, 100.0 * misses / references); 21 fclose(file);
[image:13.612.96.577.119.405.2]22g
Figure 4: Cache Tool Implementation
To guarantee that the results properly reflect the reference pattern of the uninstrumented program, ATOM guarantees that all data items referenced in the original program are placed in exactly the same locations when the program is instrumented. To guarantee this accuracy for instruction cache simulations, ATOM converts all references to the program counter to those of the uninstrumented program before passing the contents to the analysis procedures.
Instrumentation File Analysis File
1 #include <stdio.h> 2 #include <instrument.h> 3 void Instrument()f
4 Proc *procMalloc =
5 GetNamedProc( “malloc”); 6 Proc *procFree = GetNamedProc( “free”); 7 AddCallProto( “PrintResults()”);
8 if (procMalloc)
9 ReplaceProcedure(procMalloc, “my malloc”); 10 if (procFree)
11 ReplaceProcedure(procFree, “my free”); 12 AddCallProgram(ProgramAfter, “PrintResults”); 13g
1 #include <stdio.h> 2 #include <stdlib.h>
3 long totalMalloc, totalFree = 0; 4 char *my malloc(size t size)f
5 size t *mptr = (long *) malloc(size+sizeof(long)); 6 totalMalloc += size;
7 mptr[0] = size;
8 return ((void *) &mptr[1]); 9 g
10 my free(void *ptr)f
11 size t *mptr = ptr; 12 size t size = mptr[-1]; 13 totalFree += size; 14 free(&mptr[-1]); 15g
16 void PrintResults()f
17 FILE *file = fopen( “dyn.out”, “w”);
18 fprintf(file, “%ld %ldnn”, totalMalloc, totalFree);
19 fclose(file); 20g
Figure 5: Dynamic Memory Tool Implementation
7
Monitoring Dynamically Allocated Memory
Many programs make extensive use of dynamically allocated memory. Such memory is typically allocated using the malloc system call, and deallocated using the free system call. These procedures are called thousands of times by application programs, allocating, deallocating, and reallocating the same piece of memory many times. This section presents a tool that computes the total number of bytes allocated and freed over the course of the application’s execution.
The implementation is shown in Figure 5.
Lines 4 through 6 of the instrumentation file are used to search for procedures with the names malloc and free. If these procedures are present in the application, these library functions are replaced in lines 6 and 7 by the procedures my malloc and my free. The
ReplaceProcedure semantics require the type and arguments of the new procedure to be identical to the original procedure calls.
the object size. Line 6 adds this size to the total amount of allocated memory. Line 7 saves this size in the first location in the dynamically allocated memory. The pointer to the start of the requested memory is returned in line 8. Each call tofreewas replaced in the application by a call tomy free. In line 12, this procedure uses a negative index to access the size of the object, which it adds to the total amount deallocated by the application. Line 14 calls the standard free procedure to deallocate the memory.
The ability to replace procedures and monitor data references is fundamental to an emerging set of tools that monitor allocations, deallocations and references to memory[8]. Jeremy Dion and Louis Monier[14] recently completed an ambitious ATOM based tool called Third Degree, that finds and reports many kinds of reads of uninitialized memory, reads and writes to unallocated memory, array bound errors, and freeing the same object more than once. The technique used is to replace all calls to allocate and free library procedures with versions that keep track of the ranges of valid heap locations. Symbolic interpretation in the instrumentation procedures is used to significantly reduce the number of memory references that must be instrumented. The result is a very effective and efficient tool for testing the validity of memory operations. This tool is also included in the standard ATOM distribution.
8
Compiler Auditing
Modern compilers implement a long list of optimizations: loop unrolling, reductions in strength, software pipelining, global register allocation, instruction rearrangement. Unfortunately, these techniques are complicated and interact in non-trivial ways. The resulting code often misses simple optimizations. Tools that evaluate the quality of the compiled code and isolate potential performance problems are called compiler auditors[12].
This section presents a simple compiler auditing tool that adds a procedure call before each load instruction to save the contents of the destination register. Another procedure call is added after each load instruction that checks to see if the destination register was modified by the instruction. If not, the instruction loaded a value that was already in the register. These loads are termed redundant.
The implementation is shown in Figure 6.
This tool is similar to previous tools, with the exception of lines 17 through 24. Line 17 checks if the instruction is a load operation. If so, line 18 adds a call to theSaveLoadprocedure before the instruction and passes the contents of the destination register, as returned by the
Instrumentation File Analysis File
1 #include <stdio.h> 2 #include <instrument.h> 3 Instrument()f
4 Proc *p; Block *b; Inst *i; 5 int n = 1;
6 AddCallProto(“OpenFile(int)”); 7 AddCallProto(“SaveLoad(REGV)”); 8 AddCallProto(“CheckLoad(int,long)”); 9 AddCallProto(“Print(int,long)”); 10 AddCallProto(“CloseFile()”); 11 for (p = GetFirstProc(); p != NULL; 12 p = GetNextProc(p))f
13 for (b = GetFirstBlock(p); b != NULL; 14 b = GetNextBlock(b))f 15 for (i = GetFirstInst(b); i != NULL; 16 i = GetNextInst(i))f 17 if (IsInstType(i,InstTypeLoad))f 18 AddCallInst(i,InstBefore, “SaveLoad”, 19 GetInstRegEnum(inst,InstRA)); 20 AddCallInst(i,InstAfter, “CheckLoad”, 21 n, GetInstRegEnum(inst,InstRA)); 22 AddCallProgram(ProgramAfter, “Print”, 23 n++, InstPC(i));
24 g
25 g 26 g 27 g
28 AddCallProgram(ProgramBefore, “OpenFile”,n); 29 AddCallProgram(ProgramAfter, “CloseFile”); 30g
1 #include <stdio.h> 2 struct Workf 3 long count; 4 long wasted; 5 g*work; 6 FILE *file;
7 void OpenFile(int n)f 8 work = (struct Work *)
8 malloc(sizeof(struct Work) * n); 9 file = fopen( “work.out”, “w”); 10 fprintf(file, “%11s %11s %11snn”, 10 “PC”, “Count”, “Wasted”); 11g
12 void CloseFile()f 15 fclose(file); 16g
17 long value;
18 void SaveLoad(long val)f 19 value = val;
20g
21 void CheckStore(int n,long val)f 22 work[n].count++;
23 if (value == val) work[n].wasted++; 24g
25 void Print(int n, long pc)f 28 if (work[n].wasted != 0)
29 fprintf(file, “0x%9lx %11ld %11ldnn”, 29 pc, work[n].count, work[n].wasted); 30g
Figure 6: Compiler Auditing Implementation
load instruction. The arguments are a unique index of the load instruction, and the new contents of the destination register. CheckLoadcompares this value to the value saved by theSaveLoad
analysis procedure and increments the appropriate counters. The output file contains a count of the number or redundant times each load is executed along with the number of times the load was redundant.
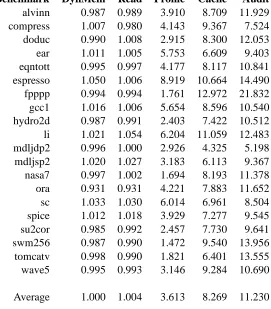
Benchmark DynMem Read Profile Cache Audit alvinn 0.987 0.989 3.910 8.709 11.929 compress 1.007 0.980 4.143 9.367 7.524 doduc 0.990 1.008 2.915 8.300 12.053 ear 1.011 1.005 5.753 6.609 9.403 eqntott 0.995 0.997 4.177 8.117 10.841 espresso 1.050 1.006 8.919 10.664 14.490 fpppp 0.994 0.994 1.761 12.972 21.832 gcc1 1.016 1.006 5.654 8.596 10.540 hydro2d 0.987 0.991 2.403 7.422 10.512 li 1.021 1.054 6.204 11.059 12.483 mdljdp2 0.996 1.000 2.926 4.325 5.198 mdljsp2 1.020 1.027 3.183 6.113 9.367 nasa7 0.997 1.002 1.694 8.193 11.378 ora 0.931 0.931 4.221 7.883 11.652 sc 1.033 1.030 6.014 6.961 8.504 spice 1.012 1.018 3.929 7.277 9.545 su2cor 0.985 0.992 2.457 7.730 9.641 swm256 0.987 0.990 1.472 9.540 13.956 tomcatv 0.998 0.990 1.821 6.401 13.555 wave5 0.995 0.993 3.146 9.284 10.690
[image:17.612.101.372.116.425.2]Average 1.000 1.004 3.613 8.269 11.230
Figure 7: Performance of Atom Tools
9
Performance
The performance of ATOM tools is a function of the number of analysis procedure calls that are executed and the amount of work done by each call. Figure 7 shows the performance of each tool over the SPEC92 benchmark suite. Each entry reflects the wall clock time of the instrumented program divided by the wall clock time of the uninstrumented program.
The Dynamic Memory and Read tools have a minimal affect on application performance, since both have relatively few instrumentation points. Contrast this with the compiler auditing tool, which adds two calls to analysis procedures for each load instruction. Also notice that there is considerable variation between benchmarks for a single tool. For example, the profile tool slows down application by as little as 1.472 for swm256 and as much as 8.919 for espresso. Both instrument at basic blocks, but since the basic block size of espresso is much smaller, the instrumented application spends a larger percentage of time in the analysis procedures.
the time necessary to gather the data and to analyze the results. For example, many cache instrumentation tools studies report competitive times for gathering trace data into in-memory buffers, but do not include the times to empty the buffer, simulate the cache, and report the results. There are many ways to substantially increase the performance of ATOM based tools. One approach is to reduce or eliminate the analysis procedure call overhead either through inlining or other compiler optimizations. Another approach is to make use of the flexibility of the instrumentation interface to reduce the frequency of analysis procedure calls. For example, the profile tool instrumentation routine can be easily rewritten to eliminate adding calls to analysis procedures for those blocks where data flow analysis determines that the count is identical to another block that has already been instrumented. Another example is instruction translation buffer simulation. Here, ATOM based tools need only instrument branches or sequential execution that crosses page boundaries. Since these are relatively infrequent, these tools are very efficient. Another example are tools that simulate branch prediction algorithms. Rather than infer branch behavior by sifting through instruction address traces, ATOM tools instrument only conditional branches.
10
Conclusions
ATOM is a unique tool for understanding program performance. The flexible interface allows a diverse set of tools to be built with minimal effort. Without the support ATOM provides, these tools would be extremely difficult to build. The performance of these tools compares favorably with hand-crafted implementations, since instrumentation is inserted only when necessary to gather statistics. Communication of data to the analysis procedures is accomplished through procedure calls, rather than relying on expensive interprocess communication. The analysis routines are always presented with information about the application program as if it was executing uninstrumented.
11
Acknowledgments
Great many people have helped us bring ATOM to its current form. Jim Keller, Mike Burrows, Roger Cruz, John Edmondson, Mike McCallig, Dirk Meyer, Richard Swan and Mike Uhler were our first internal users, and Dirk Grunwald and Brad Calder provided our first external field test site. Jeremy Dion, Ramsey Haddad, Russell Kao, Greg Lueck, Mike McCallig, and Louis Monier contributed exciting new tools. Many, many others, provided help, support, encouragement, bug reports, flames, and endorsements! Also, Brad Chen, Ted Romer, Ramsey Haddad, Louis Monier provided helpful suggestions on the content of this paper. We thank you all.
References
[1] Anant Agarwal, Richard Sites, and Mark Horwitz. ATUM: A New Technique for Capturing Address Traces Using Microcode. Proceedings of the 13th International
Symposium on Computer Architecture, June 1986.
[2] Robert Bedichek. Some Efficient Architectures Simulation Techniques. Winter 1990
USENIX Conference, January 1990.
[3] Anita Borg, R.E. Kessler, Georgia Lazana, and David Wall. Long Address Traces from RISC Machines: Generation and Analysis, Proceedings of the 17th Annual Symposium
on Computer Architecture, May 1990, also available as WRL Research Report 89/14,
Sep 1989.
[4] Eric A. Brewer, Chrysanthos N. Dellarocas, Adrian Colbrook, and William E. Weihl. PROTEUS: A High-Performance Parallel-Architecture Simulator. MIT/LCS/TR-516, MIT, 1991.
[5] Robert F. Cmelik and David Keppel, Shade: A Fast Instruction-Set Simulator for Execution Profiling. Technical Report UWCSE 93-06-06, University of Washington. [6] Susan J. Eggers, David R. Keppel, Eric J. Koldinger, and Henry M. Levy. Techniques for
Efficient Inline Tracing on a Shared-Memory Multiprocessor. SIGMETRICS Conference
[7] Stephen R. Goldschmidt and John L. Hennessy, The Accuracy of Trace-Driven Simu-lations of Multiprocessors. CSL-TR-92-546, Computer Systems Laboratory, Stanford University, September 1992.
[8] Robert Hastings and Bob Joyce. Fast Detection of Memory Leaks and Access Errors.
Winter 1992 USENIX Conference, January 1992.
[9] John L. Hennessy and David A. Patterson. Computer Architecture: A Quantitative Approach, pp. 408-425, Morgan Kaufmann, 1990.
[10] Brian W. Kernighan and Dennis M. Ritchie. The C Programming Language, Prentice-Hall, 1978.
[11] James R. Larus and Thomas Ball. Rewriting executable files to measure program behavior. Software, Practice and Experience, vol 24, no. 2, pp 197-218, February 1994. [12] James R. Larus and Satish Chandra. Using Tracing and Dynamic Slicing to Tune Compilers. University of Wisconsin Computer Sciences Department Technical Report #1174. August, 1993
[13] MIPS Computer Systems, Inc. Assembly Language Programmer’s Guide, 1986. [14] Digital Equipment Corporation. Third Degree Reference Manual, 1993
[15] Digital Equipment Corporation. ATOM Reference Manual, 1993 [16] Digital Equipment Corporation. ATOM User Manual, 1993
[17] Richard L. Sites, ed. Alpha Architecture Reference Manual Digital Press, 1992.
[18] Amitabh Srivastava and Alan Eustace. ATOM: A System for Building Customized Program Analysis Tools. Proceedings of the SIGPLAN’94 Conference on Programming
Language Design and Implementation, June, 1994.
[20] Amitabh Srivastava and David W. Wall. Link-Time Optimization of Address Calcu-lation on a 64-bit Architecture. Proceedings of the SIGPLAN’94 Conference on
Pro-gramming Language Design and Implementation, to appear. Also available as WRL
Research Report 94/1, February 1994.
[21] Amitabh Srivastava. Unreachable procedures in object-oriented programming, ACM
LOPLAS, Vol 1, #4, pp 355-364, December 1992. Also available as WRL Research
Report 93/4, August 1993.
WRL Research Reports
‘‘Titan System Manual.’’ ‘‘The USENET Cookbook: an Experiment in
Michael J. K. Nielsen. Electronic Publication.’’
WRL Research Report 86/1, September 1986. Brian K. Reid.
WRL Research Report 87/7, December 1987. ‘‘Global Register Allocation at Link Time.’’
David W. Wall. ‘‘MultiTitan: Four Architecture Papers.’’
WRL Research Report 86/3, October 1986. Norman P. Jouppi, Jeremy Dion, David Boggs, Mich-ael J. K. Nielsen.
‘‘Optimal Finned Heat Sinks.’’ WRL Research Report 87/8, April 1988. William R. Hamburgen.
WRL Research Report 86/4, October 1986. ‘‘Fast Printed Circuit Board Routing.’’ Jeremy Dion.
‘‘The Mahler Experience: Using an Intermediate WRL Research Report 88/1, March 1988. Language as the Machine Description.’’
David W. Wall and Michael L. Powell. ‘‘Compacting Garbage Collection with Ambiguous WRL Research Report 87/1, August 1987. Roots.’’
Joel F. Bartlett.
‘‘The Packet Filter: An Efficient Mechanism for WRL Research Report 88/2, February 1988. User-level Network Code.’’
Jeffrey C. Mogul, Richard F. Rashid, Michael ‘‘The Experimental Literature of The Internet: An
J. Accetta. Annotated Bibliography.’’
WRL Research Report 87/2, November 1987. Jeffrey C. Mogul.
WRL Research Report 88/3, August 1988. ‘‘Fragmentation Considered Harmful.’’
Christopher A. Kent, Jeffrey C. Mogul. ‘‘Measured Capacity of an Ethernet: Myths and WRL Research Report 87/3, December 1987. Reality.’’
David R. Boggs, Jeffrey C. Mogul, Christopher ‘‘Cache Coherence in Distributed Systems.’’ A. Kent.
Christopher A. Kent. WRL Research Report 88/4, September 1988. WRL Research Report 87/4, December 1987.
‘‘Visa Protocols for Controlling Inter-Organizational ‘‘Register Windows vs. Register Allocation.’’ Datagram Flow: Extended Description.’’
David W. Wall. Deborah Estrin, Jeffrey C. Mogul, Gene Tsudik,
WRL Research Report 87/5, December 1987. Kamaljit Anand.
WRL Research Report 88/5, December 1988. ‘‘Editing Graphical Objects Using Procedural
Representations.’’ ‘‘SCHEME->C A Portable Scheme-to-C Compiler.’’
Paul J. Asente. Joel F. Bartlett.
‘‘Optimal Group Distribution in Carry-Skip Ad- ‘‘The Distribution of Instruction-Level and Machine
ders.’’ Parallelism and Its Effect on Performance.’’
Silvio Turrini. Norman P. Jouppi.
WRL Research Report 89/2, February 1989. WRL Research Report 89/13, July 1989.
‘‘Precise Robotic Paste Dot Dispensing.’’ ‘‘Long Address Traces from RISC Machines:
William R. Hamburgen. Generation and Analysis.’’
WRL Research Report 89/3, February 1989. Anita Borg, R.E.Kessler, Georgia Lazana, and David W. Wall.
‘‘Simple and Flexible Datagram Access Controls for WRL Research Report 89/14, September 1989. Unix-based Gateways.’’
Jeffrey C. Mogul. ‘‘Link-Time Code Modification.’’
WRL Research Report 89/4, March 1989. David W. Wall.
WRL Research Report 89/17, September 1989. ‘‘Spritely NFS: Implementation and Performance of
Cache-Consistency Protocols.’’ ‘‘Noise Issues in the ECL Circuit Family.’’ V. Srinivasan and Jeffrey C. Mogul. Jeffrey Y.F. Tang and J. Leon Yang. WRL Research Report 89/5, May 1989. WRL Research Report 90/1, January 1990.
‘‘Available Instruction-Level Parallelism for Super- ‘‘Efficient Generation of Test Patterns Using scalar and Superpipelined Machines.’’ Boolean Satisfiablilty.’’
Norman P. Jouppi and David W. Wall. Tracy Larrabee.
WRL Research Report 89/7, July 1989. WRL Research Report 90/2, February 1990. ‘‘A Unified Vector/Scalar Floating-Point Architec- ‘‘Two Papers on Test Pattern Generation.’’
ture.’’ Tracy Larrabee.
Norman P. Jouppi, Jonathan Bertoni, and David WRL Research Report 90/3, March 1990. W. Wall.
‘‘Virtual Memory vs. The File System.’’ WRL Research Report 89/8, July 1989.
Michael N. Nelson.
‘‘Architectural and Organizational Tradeoffs in the WRL Research Report 90/4, March 1990. Design of the MultiTitan CPU.’’
‘‘Efficient Use of Workstations for Passive Monitor-Norman P. Jouppi.
ing of Local Area Networks.’’ WRL Research Report 89/9, July 1989.
Jeffrey C. Mogul.
‘‘Integration and Packaging Plateaus of Processor WRL Research Report 90/5, July 1990. Performance.’’
‘‘A One-Dimensional Thermal Model for the VAX Norman P. Jouppi.
9000 Multi Chip Units.’’ WRL Research Report 89/10, July 1989.
John S. Fitch.
‘‘A 20-MIPS Sustained 32-bit CMOS Microproces- WRL Research Report 90/6, July 1990. sor with High Ratio of Sustained to Peak
Perfor-‘‘1990 DECWRL/Livermore Magic Release.’’ mance.’’
Robert N. Mayo, Michael H. Arnold, Walter S. Scott, Norman P. Jouppi and Jeffrey Y. F. Tang.
Don Stark, Gordon T. Hamachi. WRL Research Report 89/11, July 1989.
‘‘Pool Boiling Enhancement Techniques for Water at ‘‘Interleaved Fin Thermal Connectors for Multichip
Low Pressure.’’ Modules.’’
Wade R. McGillis, John S. Fitch, William William R. Hamburgen.
R. Hamburgen, Van P. Carey. WRL Research Report 91/9, August 1991. WRL Research Report 90/9, December 1990.
‘‘Experience with a Software-defined Machine Ar-‘‘Writing Fast X Servers for Dumb Color Frame Buf- chitecture.’’
fers.’’ David W. Wall.
Joel McCormack. WRL Research Report 91/10, August 1991.
WRL Research Report 91/1, February 1991.
‘‘Network Locality at the Scale of Processes.’’ ‘‘A Simulation Based Study of TLB Performance.’’ Jeffrey C. Mogul.
J. Bradley Chen, Anita Borg, Norman P. Jouppi. WRL Research Report 91/11, November 1991. WRL Research Report 91/2, November 1991.
‘‘Cache Write Policies and Performance.’’ ‘‘Analysis of Power Supply Networks in VLSI Cir- Norman P. Jouppi.
cuits.’’ WRL Research Report 91/12, December 1991.
Don Stark.
‘‘Packaging a 150 W Bipolar ECL Microprocessor.’’ WRL Research Report 91/3, April 1991.
William R. Hamburgen, John S. Fitch. ‘‘TurboChannel T1 Adapter.’’ WRL Research Report 92/1, March 1992. David Boggs.
‘‘Observing TCP Dynamics in Real Networks.’’ WRL Research Report 91/4, April 1991.
Jeffrey C. Mogul.
‘‘Procedure Merging with Instruction Caches.’’ WRL Research Report 92/2, April 1992. Scott McFarling.
‘‘Systems for Late Code Modification.’’ WRL Research Report 91/5, March 1991.
David W. Wall.
‘‘Don’t Fidget with Widgets, Draw!.’’ WRL Research Report 92/3, May 1992. Joel Bartlett.
‘‘Piecewise Linear Models for Switch-Level Simula-WRL Research Report 91/6, May 1991.
tion.’’ ‘‘Pool Boiling on Small Heat Dissipating Elements in Russell Kao.
Water at Subatmospheric Pressure.’’ WRL Research Report 92/5, September 1992. Wade R. McGillis, John S. Fitch, William
‘‘A Practical System for Intermodule Code Optimiza-R. Hamburgen, Van P. Carey.
tion at Link-Time.’’ WRL Research Report 91/7, June 1991.
Amitabh Srivastava and David W. Wall. ‘‘Incremental, Generational Mostly-Copying Gar- WRL Research Report 92/6, December 1992.
bage Collection in Uncooperative
Environ-‘‘A Smart Frame Buffer.’’ ments.’’
Joel McCormack & Bob McNamara. G. May Yip.
WRL Research Report 93/1, January 1993. WRL Research Report 91/8, June 1991.
‘‘Recovery in Spritely NFS.’’ Jeffrey C. Mogul.
‘‘Tradeoffs in Two-Level On-Chip Caching.’’ ‘‘Boolean Matching for Full-Custom ECL Gates.’’ Norman P. Jouppi & Steven J.E. Wilton. Robert N. Mayo, Herve Touati.
WRL Research Report 93/3, October 1993. WRL Research Report 94/5, April 1994. ‘‘Unreachable Procedures in Object-oriented
Programing.’’ Amitabh Srivastava.
WRL Research Report 93/4, August 1993. ‘‘Limits of Instruction-Level Parallelism.’’ David W. Wall.
WRL Research Report 93/6, November 1993. ‘‘Fluoroelastomer Pressure Pad Design for
Microelectronic Applications.’’
Alberto Makino, William R. Hamburgen, John S. Fitch.
WRL Research Report 93/7, November 1993. ‘‘A 300MHz 115W 32b Bipolar ECL
Microproces-sor.’’
Norman P. Jouppi, Patrick Boyle, Jeremy Dion, Mary Jo Doherty, Alan Eustace, Ramsey Haddad, Robert Mayo, Suresh Menon, Louis Monier, Don Stark, Silvio Turrini, Leon Yang, John Fitch, Wil-liam Hamburgen, Russell Kao, and Richard Swan. WRL Research Report 93/8, December 1993. ‘‘Link-Time Optimization of Address Calculation on
a 64-bit Architecture.’’
Amitabh Srivastava, David W. Wall. WRL Research Report 94/1, February 1994.
‘‘ATOM: A System for Building Customized Program Analysis Tools.’’
Amitabh Srivastava, Alan Eustace. WRL Research Report 94/2, March 1994.
‘‘Complexity/Performance Tradeoffs with Non-Blocking Loads.’’
Keith I. Farkas, Norman P. Jouppi. WRL Research Report 94/3, March 1994. ‘‘A Better Update Policy.’’
Jeffrey C. Mogul.
WRL Technical Notes
‘‘TCP/IP PrintServer: Print Server Protocol.’’ ‘‘Boiling Binary Mixtures at Subatmospheric Pres-Brian K. Reid and Christopher A. Kent. sures’’
WRL Technical Note TN-4, September 1988. Wade R. McGillis, John S. Fitch, William R. Hamburgen, Van P. Carey.
‘‘TCP/IP PrintServer: Server Architecture and Im- WRL Technical Note TN-23, January 1992. plementation.’’
Christopher A. Kent. ‘‘A Comparison of Acoustic and Infrared Inspection WRL Technical Note TN-7, November 1988. Techniques for Die Attach’’
John S. Fitch.
‘‘Smart Code, Stupid Memory: A Fast X Server for a WRL Technical Note TN-24, January 1992. Dumb Color Frame Buffer.’’
Joel McCormack. ‘‘TurboChannel Versatec Adapter’’
WRL Technical Note TN-9, September 1989. David Boggs.
WRL Technical Note TN-26, January 1992. ‘‘Why Aren’t Operating Systems Getting Faster As
Fast As Hardware?’’ ‘‘A Recovery Protocol For Spritely NFS’’
John Ousterhout. Jeffrey C. Mogul.
WRL Technical Note TN-11, October 1989. WRL Technical Note TN-27, April 1992. ‘‘Mostly-Copying Garbage Collection Picks Up ‘‘Electrical Evaluation Of The BIPS-0 Package’’
Generations and C++.’’ Patrick D. Boyle.
Joel F. Bartlett. WRL Technical Note TN-29, July 1992.
WRL Technical Note TN-12, October 1989.
‘‘Transparent Controls for Interactive Graphics’’ ‘‘The Effect of Context Switches on Cache Perfor- Joel F. Bartlett.
mance.’’ WRL Technical Note TN-30, July 1992.
Jeffrey C. Mogul and Anita Borg.
‘‘Design Tools for BIPS-0’’ WRL Technical Note TN-16, December 1990.
Jeremy Dion & Louis Monier.
‘‘MTOOL: A Method For Detecting Memory Bot- WRL Technical Note TN-32, December 1992. tlenecks.’’
‘‘Link-Time Optimization of Address Calculation on Aaron Goldberg and John Hennessy.
a 64-Bit Architecture’’ WRL Technical Note TN-17, December 1990.
Amitabh Srivastava and David W. Wall. ‘‘Predicting Program Behavior Using Real or Es- WRL Technical Note TN-35, June 1993.
timated Profiles.’’
‘‘Combining Branch Predictors’’ David W. Wall.
Scott McFarling. WRL Technical Note TN-18, December 1990.
WRL Technical Note TN-36, June 1993. ‘‘Cache Replacement with Dynamic Exclusion’’
‘‘Boolean Matching for Full-Custom ECL Gates’’ Scott McFarling.
Robert N. Mayo and Herve Touati. WRL Technical Note TN-22, November 1991.