ISSN: 1992-8645 www.jatit.org E-ISSN: 1817-3195
A RAPID CORN SORTING ALGORITHM BASED ON
MACHINE VISION
JINGANG GAO, SHUANG ZHANG, YUZHUO MEN, HUA WANG
College of Mechanical Science and Engineering, Changchun Institute of Technology, Changchun 130012, China
ABSTRACT
According to the defects of traditional contact corn measurement methods. Size measurement systems based on CCD image are introduced. It can provide a real-time, rapid, efficient and economic measurement approach. Firstly with CCD camera image automatic acquisition, then photographed image of threshold segmentation, namely binary processing. By Laplace operator again Gauss image edge detection and the calculation of regional labeling, mark area, using area feature parameters eliminate unwanted noise. Finally, according to the edge profile features, we can use the gravity method such as the establishment of corn length and diameter size calculation method, and compared with the size of the classification standard. Using actual collection to corn image experiment, the results show that the processing method is feasible, using a 1280 x 1024 pixel CCD camera, the cornfield sorting speed can reach 30ear/min.
Keywords: CCD, Digital Image Processing, Edge Detection, Size Calculation
1. INTRODUCTION
In the classification method of detecting frozen corn it still stays many projects that are in all hand stage. It seriously influences the frozen corn transaction process and production process control. The traditional test mainly depends on people, and the main way to finish by hand. It was slow and cost. It makes the production periods lengthen, production costs. Meanwhile, based on artificial detection of information, it often contains the influence of people; the error in such information control process will introduce artificial error. So we could not rely on this information that can realize real-time or in process control.
Among them, the overseas for the application of computer vision in agricultural research started earlier .It provides us with a lot of valuable experience. In 1987, Whittaker [1] first put forward a detection method of fruit based on shape information; he suggests the information based on shape considering testing system, it has opened up a new path in theory for our recognition .Domestic research on the computer vision about agricultural products processing is mostly in classification and quality detection. Limsiroratana [2] (2002, Japan) to papaya for the object, using Fourier Descriptors Elliptic elliptical Fourier (according to identify papaya shape in the image, using a fast Fourier change (FFT) and genetic algorithm, and finally suggests the method be feasible, but it still need to undertake a further research. In 1998, He DongJian
in the northwest agricultural university [3] proposed to use computer vision method of fruit. For grading in 1999, Jilin university [4] developed apples, peaches, and other agricultural quality inspection and grading system.
Domestic researchers make a large amount of application research in the agricultural products processing of computer vision. But there is still a gap with foreign. In order to narrow the gap with foreign technology, in order to improve the efficiency of corn detection and classification based on image processing technology of corn classification of automation methods. In the support of Visual c++ software, automatic detection system can automatically complete image data acquisition, image processing [5-9], feature extraction and various calculations.
2. THESYSTEMSTRUCTUREAND MEASUREMENTMETHODS
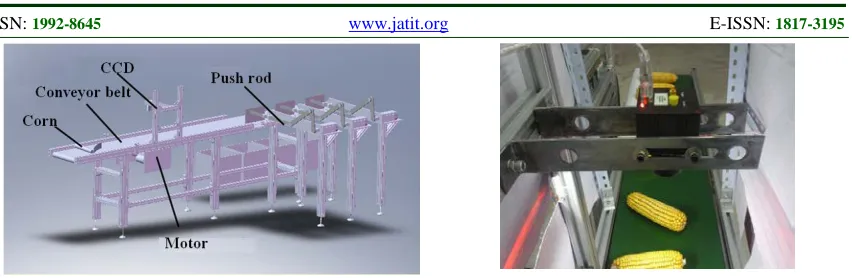
The schematic diagram of the corn sorting agency detection system hardware structure is shown in figure 1.
ISSN: 1992-8645 www.jatit.org E-ISSN: 1817-3195
[image:2.612.99.525.72.211.2]Figure 1: Detection System Hardware Structure Schematic Drawing
Figure 2: Measurement System Structures
The corn is detected in transmission device to right the horizontal movement, conveyor belts, do just above CCD, when corn passes through the photoelectric sensor, that issue with the cameras, video cameras photographed for maize instructions. Real-time photos on both sides of the CCD sensor with illuminated below, in order to improve the quality of image capture. The images will be collected by computer memory, then input software for the collected image preprocessing, binary, edge detection, regional mark, area of screening, etc. The algorithms are used to determine the center of corn, corn length and diameter of getting featured, compared with standard size final to judge its type. Transfer classification signals to the relevant servo motor, when the corn, push-rod by corresponding before putting the photoelectric sensor signal to PAC, PAC control servo motor driving push-rod will launch the corn
The optical lighting system made of plastic sheet, shape of the hollow rectangle, light box to install a fixed bracket on end, used for cameras. The casing surface is white that it basically has a diffuse reflection in order to reduce the shadow. The light box equips with two ends and about two fixed tube sockets to fix various types of incandescent lamp. Figure 3 for image acquisition practice.
Figure 3: Image Acquisition System
The whole flat of detection system hardware long 0.26m wide 2.4m, the speed of the conveyor belt range from 0-100m/min. According to the design requirements, tested corn maximum length is 0.22m. The system uses the DaHeng company DH-HV1302UM high-resolution digital camera, resolution of the 1280pixel x 1024pixel, and equipped with the image acquisition card and a computer connected to realize image collection.
3. IMAGEPROCESSING
Image processing software includes image acquisition, image binary, binary image processing (edge detection, regional mark and feature extraction, etc.), size calculation and measurement results output etc.
3.1 Image Acquisition
Corn in the conveyor belt moves with the photoelectric sensor, when through it triggered signal camera for automatic photographed. According to the different speed of the conveyor belt, the camera captured pictures which can be fuzzy. It seriously influences the image processing quality. The repeated test is needed to adjust camera gain and exposure to select the optimal value. In this lab chosen for a Gain of Gain = 0.
3.2 Binary Image Processing
Input images come through the camera as shown in figure 4 into the computer as procedure calls. Before entering the recognition stage, the recognition is generally for binary image, so we must process the input image
[image:2.612.90.302.257.370.2]ISSN: 1992-8645 www.jatit.org E-ISSN: 1817-3195
Figure 4: Original Image Figure 5: Binary Image
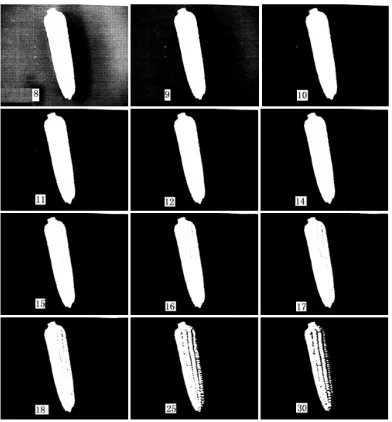
[image:3.612.111.299.76.188.2]Threshold choice can pursue the best value by many experiments, elected to take different threshold, its greatly influence on the image processing, behind in figure 3 below is a set of experiments, we can see that the selection of threshold is different, the edge detection (by Laplace operator edge detection of cases), regional flag in the image labeled image number is different.
Table I: The Threshold Is Not The Same As The Number Of Regional Labeling
Threshold 10 11 12 14 15 16 17 18 20
Regional
labeling
number
81 9 6 25 29 39 59 67 95
Figure 6: Threshold - The Number Of Regional Labeling
Table 1 and figure 6 by threshold selection, we can conclude that when 12 binary images, better effects and reduce the edge detection and regional mark time, improve the efficiency of the image processing. For specific images, the light and the actual corn have different sizes, the selection of concrete numerical is somewhat different, but they all have a common trend, the following figure 7 is their overall trends.
Figure 7: Threshold - The Number Of Regional Labeling Overall Trends
[image:3.612.321.497.76.192.2] [image:3.612.86.302.312.524.2]Too small threshold will also put content we don't need (such as background) together as shown in figure 8 extracted out (threshold value in most evident when) for 8, 9, instead, excessive threshold will remove part of the target object (as shown in figure 8 for 17,18,25,30 threshold values in most evident when), both of which may result in the following image processing cannot continue normally, so determining the optimal threshold is very important. But in an actual system, target and background image did not have vastly different gray, with visible illuminate angle different, target brightness and background brightness all need change, threshold choice should generally depend on the actual application and flexible Settings. Therefore system should be able to automatically select threshold, according to the actual nature of the image pixels set. Their ideas are as follows: Point-wise scan images, to work out the pixels, then computed the sum of the mean value and the image set for automatic threshold.
[image:3.612.314.510.484.695.2]ISSN: 1992-8645 www.jatit.org E-ISSN: 1817-3195
After the binary image of black and white image, corn for that is black, white, the background of its edge need search.
3.3 Edge Detection
Combined with the actual materials and the experiment comprehensive analysis shows that the Robert operator with steep edge detection of low noise image processing effect is good. Sobel operator and the edge of Prewitt operator handling isn't entirely disconnected, but have certain disconnect, because these two kinds of operator in all directions processing is different. In this case, the Laplacian operator Kirsch operator and disposal of being better, but the edge from eight Kirsch operators to view images, computationally trivial, speed rather slow. Laplacian operator for Laplace domain edges, its second derivative in edge points, and appear zero cross edge points second derivation of pixels on both sides of the vision, and it has no isotropic characteristics, and its edge detection results of the edge information are not contained double pixel wide edge.
Because the image measurement system is generally in carefully designed the controlled environment obtain the object to be tested image edge detection algorithm, so we should focus on the precise positioning. And because of the Gauss Laplacian operator image, the edge detection treatment effect is better. This system uses Gauss Laplacian operator edge detection.
3.4 Regional Markers And Area Of Screening
Because the collected image itself is influenced by noise factors, on subsequent value computing it can cause errors, we must carry on the feature extraction. Its principle is as follows: map scanning the number and determine the connected area after marking the image (area mark shown as shown in figure 9), and then in each connected area statistics connected area, there is always a large area of special, everything else is area of smaller or small area, then set a size for 2000 pixel threshold, use for cycle will area is less than the threshold for background area filling, in order to achieve the purpose of removing interference image area screening as shown in figure 10 shows).
Figure 9: Regional Marker Image
[image:4.612.310.528.314.459.2]Figure 10: Area Screening Image
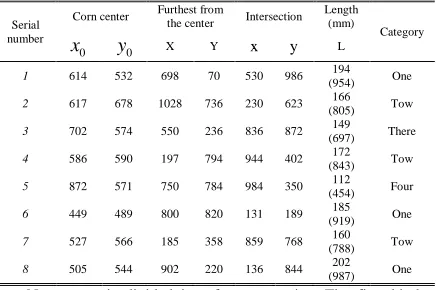
Table I : All Kinds Of Corn Measurement Results
Serial number
Corn center Furthest from
the center Intersection Length
(mm)
Category
0
x y0 X Y x y L
1 614 532 698 70 530 986 194 (954) One
2 617 678 1028 736 230 623 166 (805) Tow
3 702 574 550 236 836 872 149 (697) There
4 586 590 197 794 944 402 172 (843) Tow
5 872 571 750 784 984 350 112 (454) Four
6 449 489 800 820 131 189 185 (919) One
7 527 566 185 358 859 768 160 (788) Tow
8 505 544 902 220 136 844 202 (987) One
Note: corn is divided into four categories: The first kind: more than 180 mm in length. The second kind: length of 150-180 mm. The third kind: length of 120-150 mm. The fourth kind: length of less than 120 mm for the table above the corresponding to the corn pictures.
3.5 Size Calculation
After binary image processing it has only one goal in images of corn, regional marker image have calculated the center point, specific methods are as follows: in binary image point search, find out all the gray value is 1, namely the pixel target point. Put all the target value and y-coordinate abscissa denotes the accumulative, divided by dividing target image pixel points (which is the target image "S the area threshold), as measured from the approximate geometric center (corn), see calculation formula (1~4):
1
S
x i
i
H x
=
=
∑
(1)1
S
y i
i
H y
=
ISSN: 1992-8645 www.jatit.org E-ISSN: 1817-3195
x0 Hx S
= (3)
0
y H y
S
= (4)
The above method commonly called gravity method [6]. In corn image, along the edges from the target image center out furthest (X, Y), in line with the center can be furthest approximate as corn in a straight line, this line in diameter with corn another edge intersecting point coordinates for (X, Y), the image of the corn in the corresponding length L its computation type (5) :
2 2
( ) ( )
L= X −x + Y−y (5)
3.6 Output
Corn characteristic parameters such as length diameter, we make it comparable with standard classification. Then we pass the results through the DDE teleport to IFIX, communication publishes command control actuators for actual corn classification.
4. CONCLUSION
In experiments, such as the focal length of the lens in the firm, the standard size itself is not accurate or uneven lighting source factors such as the measurements will lead to inaccurate, requires repeated testing adjustments. The system uses the CCD-array, combining with computer strong data processing ability, the visual identification technique is applied to realize the classification of corn, corn automated, the application of classification in frozen corn automation production line, and realize the whole frozen corn production without artificially participation and corn sort the speed can reach above 30 ears/minutes it can improve the efficiency of frozen corn production, and improve the quality of the products. The study of the core technology can portable to other need quality sorting products, technical transformation; it has a huge economic efficiency and the social efficiency.
ACKNOWLEDGEMENTS
This work was supported by Science and Technology Development Project of Jilin Province of China: 201105050.
REFRENCES:
[1] Whittaker A.D, iles G E, itchell O R, et al., “Fruit location in a partially occluded image”. Transactions of the ASAE, Vol. 30, No. 3m 1987, pp. 91-96.
[2] S Limsiroratana, Y Ikeda, “On Image Analysis for Harvesting Tropical fruits”, SICE 2002. Proceedings of the 41st SICE Annual Conference, Aug. 5-7, 2002, pp. 1336 - 1341. [3] He Dongjian, Yang Qing, Xue Shaoping, Geng
Nan, “Computer Vision for Color Sorting of Fresh Fruits”, Transactions of the Chinese society of agricultural engineering, Vol. 151, No. 2, 1993,pp. 202-205.
[4] Zhang Shuhui, Chen Xiaoguang, Zhang Xiaomei, “Image Processing System for Detecting and Grading Apple, Peach and Other Agricultural Products”, Transactions of the Chinese society of agricultural engineering, Vol. 15, No. 1, 1999. pp.201-204.
[5]Susumu Goto, Hiroyoshi Iwata, Shinsaku Shibano, Kazumi Ohya, Akira Suzuki, Hitomi Ogawa, “Fruit shape variation in Fraxinus mandshurica var. Japonica characterized using elliptic Fourier descriptors and the effect on flight duration”, Ecological Research, Vol. 20, No. 6, 2005, pp. 733-738.
[6] GIAKOUMIS I, NIKOLAIDIS N, PITAS I., “Digital image processing techniques for the detection and removal of cracks in digitized paintings”, Transactions on Image Processing, Vol. 15, No. 1, 2006, 178-188.
[7] Coleman S. A, Scotney B. W, Suganthan S., “Multi-scale edge detection on range and intensity images”, Pattern Recognition, Vol. 44, No. 4, 2011, 821-838.
[8] G. P. Moreda, J. Ortiz-Caravate, F. J. García-Ramos, “Non-destructive technologies for fruit and vegetable size determination - A review”, Journal of Food Engineering, Vol. 92, No. 2, 2009, pp. 119-136.