RETAINING AND INCREASING CUSTOMER
PROFITABILITY USING K-MEANS AND APRIORI
ALGORITHM
1SUPARTO DARUDIATO, 2ANINDITO
1Assoc. Prof., School of Information Systems, Bina Nusantara University
2
Lecturer, School of Information Systems, Bina Nusantara University
E-mail: [email protected], [email protected]
ABSTRACT
Appropriate strategy is an absolute must in the tight business competition of today. Many methods are used in business to predict and process data so that information and knowledge needs of the business can be obtained. Data mining is often used as a solution to this problem. Data mining is used to explore the hidden information in the data warehouse, and able to show a pattern of behavior of customers in their daily life associated with the company. K-Means and association rule are two techniques of the many techniques contained in the data mining algorithm that can be used as a basis for analysis to improve profitability.
Keywords: Data Mining, CRM, K-Means, Association Rules
1.
INTRODUCTIONIn the current era of technology, more companies began to realize that the key to success is to maintain a good relationship with their customers. Obtaining new customers usually costs more compared to retaining existing customers. Old customers are more receptive to the company products than when compared with new customers. Eventually, it became a challenge for companies to understand what the customer wants and how companies can respond and anticipate customer's wishes [1]. The technology of data warehouse, data mining, engineering and customer relationship management (CRM) can provide new opportunities for businesses to be able to act. CRM can help to ease the process by connecting representatives of sellers and buyers to communicate with each other and work together [1]. CRM is a solution that focuses on automation and improves front-office business processes such as marketing, sales, customer service and support [2].
What is conveyed above, can only be realized with a well executed or if the company has the knowledge about customers and colleagues. Many companies already have large amounts of data about customers, suppliers and other business associates. However, in reality, many companies are not able to find valuable information hidden in data, thus making the company unable to transform data into knowledge. Among these gaps, there was
data mining technology introduced around the 1980's.
These data mining technology, used to overcome limitations in terms of excavation, analysis, extraction and evaluation of data into information, of information into knowledge. Total analysis is conducted with the help of statistical tools and specific modeling, so as to provide a knowledge base and the hidden pattern of the existing data are difficult to find by ordinary statisticians. Knowledge gained, will be a useful input for the company, especially for upper-level management to determine the segmentation and personalization of customer information in an effort to foster better relationships with customers. Data mining is an important component of CRM. CRM software framework is used to analyze business problems setting up and development of data requirements, validate and evaluate models against business problems [2].
2.
LITERATURE REVIEWintelligence in a very large database such as a data warehouse. Data mining can find patterns of data that were previously unknown, and the pattern is represented with computer graphics to be easily understood [4, 5].
Data mining techniques can be associated with the process of discovery and learning [6], where the process can be categorized into three main methods, namely supervised, unsupervised, and reinforcement learning. Data mining tools is able to learn. So that data mining can be used to extract data and build a representation of reality in the form of the model. The resulting models describe patterns and relationships in data [1].
There are many problems in the field of intellectual, economic, and business that can be expressed in data mining tasks. Some tasks can be completed using data mining, namely [5]:
Classification. Classification task is one of the
most common data mining techniques.
Classification involves the examination of the characteristics of an object and then put it into one of the predefined classes. Classification process usually involves defining classes and sample data that contains examples of objects that have been classified previously. The purpose of this task is to create a model that can be applied to data that has not been classified. Some examples of the classification task is intended to resolve business issues such as the classification level of risk from those who apply for credit, select the content to be displayed on a web page, identifying false insurance claims, etc..
Estimation. Estimates related to the output in the form of continuous values. Departing from the data used as the insert, the estimation process will yield a value for continuous variables that were not previously known. Estimates are also frequently used in classification tasks. Examples of problems that involve estimation processes such as estimating the number of children in a family, total income of a family, or the lifetime value (survival value) of a customer, and so on.
Prediction. Same predictions as the task of classification and estimation, only the data classified by the behavior or values expected in the future. In the process of prediction, the only way to check the accuracy of the results is by waiting and watching. The techniques used to perform classification and estimation tasks can be adapted in making predictions by using data samples where the value of the variable to be predicted is already known, as well as historical data for the sample
data. Historical data used to create a model that describes the behavior being observed. When this model is applied to the input data, it will result in the prediction of the future. Examples of predictions that can be done with data mining for example, predict which customers will switch to a competitor within six months, which customers will order certain services or products, etc.
Affinity grouping (Grouping based on the equation) The purpose is to determine the affinity grouping things that happen simultaneously, for example, retail companies can perform market basket analysis, which determines what products are purchased by customers simultaneously. Affinity grouping can also be used to identify opportunities for cross-selling or to categorize your products or services that fit each other. Affinity grouping is one simple example in generating rules from data.
Clustering (Grouping). Clustering is a process to perform the segmentation of a heterogeneous population into several sub-groups or clusters which are homogeneous. Clustering process is different compared to classification, because it does not depend on classes that have been defined previously or sample data. These data will be grouped by similarity of characteristics. Clustering is often used as an initial step before performing other data mining tasks.
Description and profiling. Data mining can be used to discover and describe what happened there or owned by the data, thus improving the understanding of various things.
Data mining activities are commonly categorized in three general categories as follows [1];
• Discovery-process, looking in the database to
find hidden patterns without a predetermined idea or hypothesis about what patterns might exist.
• Predictive Modeling-process, in taking a
pattern taken from the database and use it to predict the future.
• Forensic Analysis-process, in applying pattern
extraction to discover anomalies or unusual data elements.
3.
K-MEANS ALGORITHMBasically the use of clustering algorithms in the process depends on the data and conclusions to be achieved. Was used for K-Means algorithm in which the rule contains the following:
• The number of clusters needs to be entered.
• It has a numeric type attributes.
• The number of attributes less (<100)
K-Means algorithm is an initially nonhierarchical method which takes some of the many components of the population to be used as initial cluster centers. In this step the cluster centers were randomly selected from a collection of population data. In the next K-Means stage, each component is selected in the population data and marked into cluster centers that have been defined depending on the minimum distance between the components with each cluster center. Cluster center positions will be recalculated until all components of the data are classified into each cluster center and the last will form a new cluster center position. K-Means algorithm is basically doing two processes namely the detection of the location of the center of each cluster and the process of finding the members of each cluster.
The use of different methods to determine the equation of the cluster has a different effect on the clustering technique. One way/standard way to calculate similarities between each cluster with a population of data is to describe a function that measures the distance between each cluster with population data. Definition of distance function measures the distance a group of population data. In this design the distance measure is Euclidean distance to indicate the similarity between each
cluster with minimum distance and bear
resemblance or similarity is higher. Euclidean Matrix between point a = (a1, a2, a3, a4, ...., an) and the point b = (b1, b2, b3, b4, ...., bn) is:
∑
−
−
=
ni
i i
a
b
b
a
d
1
2
)
(
)
,
(
Early in the process of K-Means algorithm is a data population criteria data is data that is processed and input parameter k, the maximum number of clusters must be present in the algorithm later. K-Means algorithm:
• Determine the number of K clusters.
• Initialize k cluster centers as seed points, the
Centre can be obtained at random.
• For each data criteria data, search data closer to
the center of the cluster and mark the data
points in the nearest cluster center and cluster center position is calculated back to an average member of each cluster.
• Check all the data once again and put all the
data that is closest to the center of the cluster (cluster center does not count anymore). If the members of each cluster center does not change, stop and if it is changed back to Step-2.
From the above algorithm can be taken two important operations carried out during the process of clustering with K-Means algorithm that calculates the distance between data objects with the cluster center and calculate the average of the cluster center. During any iteration process to determine the new cluster centers by calculating the distance of each data object, here it is known that if two objects that have high levels of closeness / similarity with the same look the same size range, it could be possible that two objects are grouped together into the cluster center. When calculating the average in each cluster, all objects in the cluster are summed and divided by the total number of objects associated in each cluster center. Due to the required resolution in this algorithm by minimizing the amount or the average distance of a large, variant, then during the clustering process is important to re-calculates the total distance of the data matrix. In other words if there is a matrix of data over long distances from the cluster center, then the matrix has an influence greater than any other data matrices are close to the cluster center. To move away from the matrix of cluster centers is necessary to do the standardization of the values of each matrix is far from the cluster center. So the K-Means algorithm to determine the optimal cluster centers by minimizing the total distance between the population data by cluster centers based on the iteration that will select the smallest total distance.
[image:3.612.321.525.583.694.2]The results of the clustering using K-Means Clustering Method can be described as in Figure 1.
4.
APRIORI ALGORITHMApriori algorithm is a classic algorithm for learning association rules. Apriori is designed to operate on a database that contains the transaction (eg, a collection of items purchased by customers, or the details of a website visit frequency). Apriori logic will be described below.
• If (A, B, C) is a set of items is large, then (A,
B) is a set of large items
o P {A.B, C} <P {A, B}
o If (A, B) is a set of items that are
small, then (A, B, C) cannot be a large set of items
• Consider (A, B, C) only if all subset is a large
item set.
If there is a transaction where a shopping cart contains (baby formula, baby diapers, peanut butter) it can be concluded that the shopping list contains (baby formula, diapers). With apriori logic of data obtained from stores or supermarkets that turns elements (baby formula, diapers, baby) has a high enough frequency purchased together.
So basically the logic and technique Apriori Association Rule is a couple of techniques to achieve a high level of data accuracy and data processing techniques are arranged in a systematic and computational algorithms can be mapped [10].
Apriori algorithm in application programs:
• L1 = {large 1-itemsets}, k = 1
• Establishment of a candidate set
Candidate set Ck: set of k-th item of potential. {A, B, C} is the set of candidate if all subsetnya {A, B}, {B, C} and {A, C} is a set of large items. Form the candidate set Ck +1 using Lk
• Scanning
Check whether the candidate set is really suitable.
• Add k to 1, and repeat step 2
Figure 2 below shows pseudocode for the Apriori algorithm which do generate association rules.
Figure 2. Apriori Pseudocode [10]
5.
DISCUSSIONApriori algorithm is a classic algorithm for In the following discussion, we used an example of analytical CRM to improve customer profitability in product sales with an attractive offer in accordance with the needs of customers and potential customers acquired through effective management and optimal payment. Oracle Data Miner is used for the simulation of data mining.
Data mining architecture
In the process of data mining, data sources to be used are taken from the data warehouse. This is because the data in the data warehouse has been through the cleaning process and integration from several operational databases, so that the final data can give an idea of the overall business processes. In addition, data stored in the data warehouse is historical. Due to the very large size of data in the data warehouse and it also includes many of the company's overall business processes, then the source data used for the data mining process is taken from the data mart and data mart is limited to sales and billing data mart. Data in the data mart is designed for end-user needs in a strategic business unit or department.
In addition to the company's internal data on sales and billing, as well as external data is not required resulting from the company's business processes. External data is data that competitor sales will be used to generate intelligent information for businesses in the form of comparisons with competitors both sales volume by product and region.
Internet. Figure 3 illustrates the proposed architecture for the design example of data mining.
Figure 3. Proposed data mining architecture
Stages in the data mining process consist of the following [8]:
Business Understanding
The early stages of data mining design focuses on understanding the purpose and problems of business enterprises. This stage is essential in order to transform the acquired knowledge into a data mining problem definition, and designed the initial
plan to achieve corporate objectives.
The following are a description of information needs to be generated from the analytical CRM:
• Information about customer buying patterns
that can support the opportunity for cross-selling of products that can be combined.
• Information on customer payment patterns to
be able to determine promotion or discount Term of Payment as well as appropriate based on the ability of the customer.
• Information on the predictive accuracy of
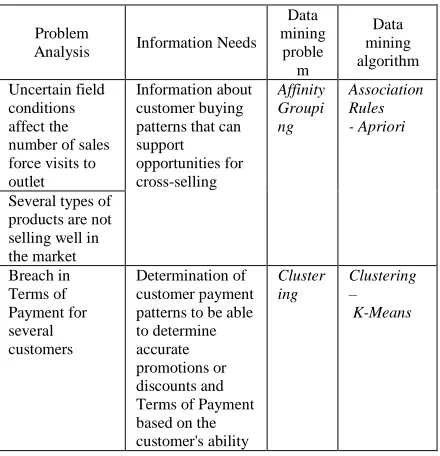
customer payment terms in the future. Furthermore, there are business issues that will be translated into one of the problems can be resolved through data mining. Table 1 describes the information needs to answer the purpose and form of data mining problems to be solved.
Table 1. Data Mining Objectives, Information Needs And Problems
Problem
Analysis Information Needs Data mining
proble m
Data mining algorithm
Uncertain field conditions affect the number of sales force visits to outlet
Information about customer buying patterns that can support opportunities for cross-selling
Affinity Groupi ng
Association Rules - Apriori
Several types of products are not selling well in the market Breach in Terms of Payment for several customers
Determination of customer payment patterns to be able to determine accurate promotions or discounts and Terms of Payment based on the customer's ability
Cluster ing
Clustering – K-Means
Data Understanding
After the business problem is formulated into a data mining problem, the next step is gathering and choosing a data source as a reference for creating a data mining model. Based on the proposed data mining design architecture (see Fig 3), the data source used in the data mining planning process is obtained from the sales and billing data marts.
Data Preparation
In the data preparation stage, information located in the data mart is selected based on relationship to each other. This information is used in the creation of the data mining model. The data mining model is created by observing existing company data and finding hidden patterns, without addition of new data into the data mart. Information selection may be done using view creation from the data mart.
To create source data in accordance with required field and format, there are two views of the sales data mart. These views are made into case table and nested table as input data for the mining process with Association Rules. While one view required from billing data mart is used to create customer payment model with Clustering
Modeling
Association Rules
[image:5.612.318.538.118.346.2]algorithm. The created model is aimed to discover customer buying patterns and the relationship between the product bought simultaneously by the customer. Data mining function used are Association Rules and the algorithm used to support this function is the Apriori algorithm. Below are the specifications of the data mining model structure created from the used parameters.
Table 2. Parameter Specification of Association Rules Model
Name Value Notes
Minimum_Supp ort
5 Percentage of minimum occurrences of item set to support every pattern rule Minimum_Conf
idence
10 Percentage of minimum value between items in every pattern rule
Algorithm_Nam e
ALGO_APRIO RI
Name of used algorithm Maximum_Rule
_Length
3 Number of maximum item combinations in every pattern
Based on Table 2, the minimum_support parameter determines the minimum percentage of item set occurrences to support occurrences of patterns. The minimum_confidence parameter determines the percentage of minimum intensity value where a product is bought simultaneously with another product.
The value assigned to both parameters should be adjusted by the number of data sources used for the processing of data mining. Here are some requirements that must be considered in determining the value of the minimum_support parameter.
• The smaller the value of support, more
memory capacity and longer time it takes for processing since more data is involved in the formation of the patterns.
• The greater the value of support, the less
required memory capacity and less processing time, less data patterns will be identified as less data is involved in the search pattern.
Several conditions must be considered in determining the value of the minimum_ confidence parameter, among others:
• The smaller the value of confidence, the more
useless rules will be identified in the data processing, thus causing the value of confidence of each pattern produced lower.
• The greater the value of confidence, the less
useless rule will be identified in the data processing, resulting in rules that may be useful not identified.
For minimum_support parameter, the value was set at 5. This value is the default value of the Oracle Data Miner-tested as the optimal value to support the data processing time relatively quickly. For minimum_confidence parameter, the value was set at 10, because it's the default value of the Oracle Data Miner-tested as the optimal value to generate useful rule. For Maximum_Rule_Length parameter, the value was set at three, that shows a combination of the three pieces of the item to be found.
Clustering
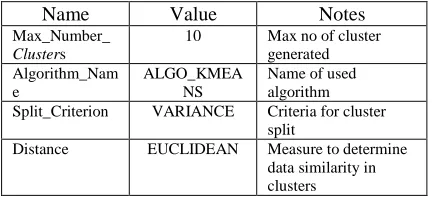
[image:6.612.316.532.387.486.2]To create a model that will be used locate customer payment patterns by customer's payment details, data mining function used is Clustering. The algorithm used to perform this function is K-Means algorithm. Here is the specification of the structure of data mining models to be built and the parameters used.
Table 3. Parameter Specification of Clustering Model
Name Value Notes
Max_Number_
Clusters
10 Max no of cluster generated Algorithm_Nam
e
ALGO_KMEA NS
Name of used algorithm Split_Criterion VARIANCE Criteria for cluster
split
Distance EUCLIDEAN Measure to determine data similarity in clusters
Based on Table 3, Max_Number_Clusters parameter specifies the maximum number of clusters that will be generated from the created data mining model. Split_Criterion parameter determines the method used to split and merge a case to be of a particular cluster. Distance parameter determines how the similarity between the elements can be calculated.
All of the above parameters will affect the results of grouping the data into a particular cluster. Here are some requirements that must be considered in determining the value of the Max_Number_Clusters parameter:
• The greater the value of
• The smaller Max_Number_Clusters value will result in fewer and fewer clusters. This resulted in the data within each cluster becomes more similar and the differences between cluster becomes larger. This will make the quality of cluster analysis is considered to be better.
For the parameter Max_Number_Clusters,
value is set to 10. This is the default value for Oracle Data Miner which has been tested as the optimum value to obtain the number of clusters having similar characteristics.
To determine the values for the Split_Criterion parameter, there are two criteria provided by Oracle Data Miner, namely: Cluster Variance dan Cluster Size. Cluster Variance is the computed dispersion of dots around the center of the cluster. It represents degree of similarity within these dots. This is measured by calculating distances of each dot to the cluster center. Clusters with the largest dispersions are chosen as split candidates. Cluster Size is the number indicating amount of dots in a cluster. Clusters with the biggest amount of dots are chosen as split candidates. Criteria for the model are taken from Cluster Variance. This value is the default value from Oracle Data Miner which has been tested as an optimum value to determine cluster split.
[image:7.612.317.528.219.343.2]In determining the Distance parameter, there are two measurements provided by Oracle Data Miner, namely: Euclidean and Cosine. Cosine is better used on normalized data. Distance parameter used to create this clustering model is Euclidean. This is the default value of Oracle Data Miner which has been validated as an optimum value to calculate similarity between data elements.
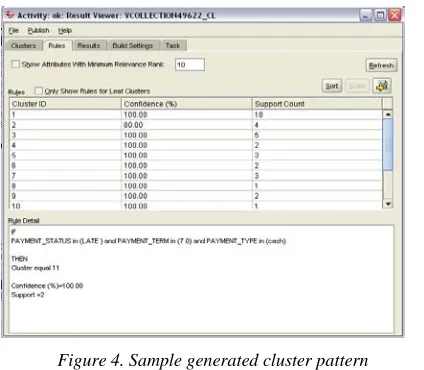
Figure 4. Sample generated cluster pattern
After the clustering model is generated and producing cluster patterns as shown in Figure 4,
these patterns will be applied to customer data stored in the database to do scoring against each customer. From scoring results, we may found the customer payment pattern according to the already identified payment patterns.
[image:7.612.97.309.518.703.2]A view to apply generated patterns from the clustering model against customer data is required to conduct the scoring process. FIGURE 5 shows sample display of generated patterns from clustering model on customer data.
Figure 5. Cluster Method Scoring Results
6.
CONCLUSIONData mining model shows the pattern of purchasing and payment from customers. This pattern may be utilized by the management to generate strategies in increasing its sales and determining an accurate Term of Payment for each customer. Data mining is able to generate predictive reports on customer payment behavior in the future.
REFERENCES:
[1]
C. Rygielski, J. C. Wang and D. C. Yen,"Data mining techniques for customer
relationship management," Technology in
Society, vol. 24, p. 483–502, 2002.
[2]
S. Xu and M. Qiu, "A privacy preserved data mining framework for customer relationship management," vol. 7, no. 3, pp. 309-322, December 2008.[3]
S. Stewart, "A Brief Data Mining History," 2008. [Online]. Available: http://www.rapid- business-intelligence-success.com/data-mining-history.html. [Accessed 1 February 2012].[4]
J. A. Hoffer, M. Prescott and F. McFadden,Modern database management, 7th Edition ed., NJ: Prentice Hall, 2004.
[5]
G. S. Linoff and M. J. Berry, Data miningcustomer relationship management, Wiley Computer Publishing, 2011, p. 888.
[6]
A. Berson, S. Smith and K. Threaling,Building data mining application for CRM, New York: McGraw-Hill, 2000.
[7]
C. Rygielski, J.-C. Wang and D. C. Yen,"Data mining techniques for customer
relationship management," Technology in
Society, vol. 24, no. 4, pp. 483-502,
November 2002.
[8]
T. Tarpey, "Linear Transformations and the k-Means Clustering Algorithm: Applications toClustering Curves," The American
Statistician, vol. 61, no. 1, pp. 34-40, 2007.
[9]
K. W. Alnaji and W. M. Ashour, "A novelclustering algorithm using K-means (CUK),"
International Journal of Computer
Applications, vol. 25, no. 1, pp. 25-30, 2011.
[10]
R. Agrawal and R. Srikant, "Fast algorithms for mining association rules in largedatabases," in VLDB '94 Proceedings of the
20th International Conference on Very Large
Data Bases, San Fransisco, 1994.
[11]
A. Sen and A. P. Sinha, "A Comparison of Data Warehousing Methodologies; Using a common set of attributes to determine which methodology to use in a particular datawarehousing project," COMMUNICATIONS
OF THE ACM, vol. 48, no. 3, pp. 79 - 84,
![Figure 1. Sample K-means clustering [9]](https://thumb-us.123doks.com/thumbv2/123dok_us/8914556.961100/3.612.321.525.583.694/figure-sample-k-means-clustering.webp)