www.ijraset.com
Vol. 1 Issue III, October 2013
ISSN: 2321-9653
I N T E R NA T I ON A L J OU R N A L F OR R E S E A R C H IN A P PL I E D S C I ENC E AND
E N G I N E E R I N G T E C H N OL O GY (I JR A S E T)
Page 1
Performance Measurement of an Industry Using Simple Additive
Weightage
Parvesh Antil
1, Mohit Singh
2 1Assistant Professor, MAE Department, Northern India Engineering College, Delhi
2
Assistant Professor, MAE Department, Northern India Engineering College, Delhi
ABSTRACT
Intense globalization and competitiveness are the forces, which pressurizes the manufacturing industries to adopt various quality tools and techniques to remain their stake in the market. Simple additive weightage (SAW) is one of the quality technique, applied in measuring quality of manufacturing industries. Critical success factors affecting the quality of manufacturing industries are identified through intense literature survey.
Key words: SAW, Critical success factors, Quality.
INTRODUCTION
In the early days of manufacturing, an operator’s work was
inspected and the decision was made whether to accept or reject. Later, due to globalization and rapid advancements in technology the manufacturing environment became extremely competitive. So, manufacturers needed to be stay focused on finding ways to design, produce and deliver products, and Quality is the only strategic tool for any manufacturing organization to create a win –win situation in this competitive battle.
Simple Additive Weightage Technique is one of the most used MADM techniques. It is simple and is the basis of most MADM techniques such as AHP and PROMETHEE that benefits from additive property for calculating final score of alternatives. A score in the saw method is obtained by adding contributions from each attribute. Since two items with different measurement units cannot be added, a common numerical scaling system such as normalization is required to permit addition among attribute values. The total score for each alternative then can be computed by multiplying the comparable rating for each attribute by the importance weight assigned to the attribute by the importance weight assigned to the attribute and then summing these products over all the attributes.
LITERATURE SURVEY
Simple additive weighting which is also known as weighted linear combination or scoring methods is a simple and most often used mulltiattribute decision technique (Malczewski, 1997; Janssen, 1992; Eastman, 1993). The method is based on the weighted average. The simple additive weighting method, obtains an index by adding contributions from each attribute. (Churchman and Ackoff, 1954) first utilized the SAW method to cope with a portfolio selection problem.
APPLICATION OF SIMPLE ADDITIVE WELDING
Simple Additive Weighting (SAW) which is also known as weighted linear combination or scoring methods is a simple and most often used multi attribute decision technique. The method is based on the weighted average. An evaluation score is calculated for each alternative by multiplying the scaled value given to the alternative of that attribute with the weights of relative importance directly assigned by decision maker followed by summing of the products for all criteria. The advantage of this method is that it is a proportional linear transformation of the raw data which means that the relative order of magnitude of the standardized scores remains equal.
STEPS INVOLVED IN SIMPLE ADDITIVE WEIGHTAGE
1. Compare each critical success factor with other factor through pairwise comparison and
construct a comparison matrix.
2. Then assign a score to each factor to show its importance.
3. Determine the optimum value from each column and divide the
whole column with the respective value and the normalized matrix
is constructed.
4. Now create a weighted sum matrix by multiplying the each
element of each column with the respective weight of the factor.
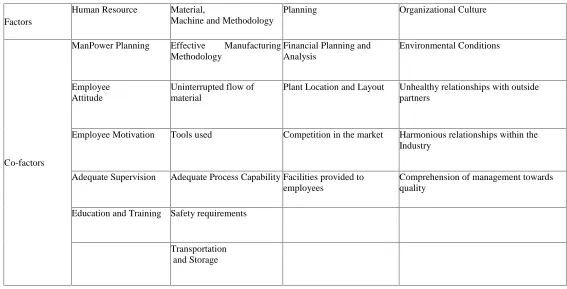
IDENTIFICATION OF CRITICAL SUCCESS FACTORS
There are four critical success factors are selected for implementation of SAW technique as follows:
• Human Resource
• Material, Machine and Methodology;
• Planning;
[image:3.612.27.594.255.544.2]• Organizational Culture
Table 1: Factors and Co-factors affecting quality of manufacturing Industry
Factors
Human Resource Material,
Machine and Methodology
Planning Organizational Culture
Co-factors
ManPower Planning Effective Manufacturing Methodology
Financial Planning and Analysis
Environmental Conditions
Employee Attitude
Uninterrupted flow of material
Plant Location and Layout Unhealthy relationships with outside partners
Employee Motivation Tools used Competition in the market Harmonious relationships within the Industry
Adequate Supervision Adequate Process Capability Facilities provided to employees
Comprehension of management towards quality
Education and Training Safety requirements
Transportation and Storage
METHODOLOGY
Simple additive weightage method is applied to assess quality of manufacturing organization. To compare the organizations a matrix is formed as shown in Table 2. On the basis of literature survey, weightage of each critical success factor and rank of each factor for all the organizations is determined through pair wise comparison.
Table 2: Matrix consisting of four organizations and four factors
Factors
Organization
1 (0.4)
2 (0.1)
3 (0.2)
4 (0.3)
A 8 4 5 9
B 12 3 6 3
C 4 7 8 7
[image:3.612.322.596.582.713.2]www.ijraset.com
Vol. 1 Issue III, October 2013
ISSN: 2321-9653
I N T E R NA T I ON A L J OU R N A L F OR R E S E A R C H IN A P PL I E D S C I ENC E AND
E N G I N E E R I N G T E C H N OL O GY (I JR A S E T)
Page 3
[image:4.612.25.299.215.325.2]Now, construct a normalized matrix as shown in Table 3 by dividing the each element of all columns with highest valued element of the column.
Table 3: Normalized matrix
Factors Organization 1 (0.4) 2 (0.1) 3 (0.2) 4 (0.3)
A 0.67 0.57 0.625 1
B 1 0.43 0.75 0.33
C 0.33 1 1 0.78
D 0.58 0.71 0.25 0.44
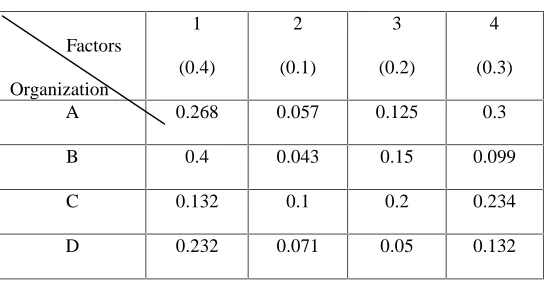
Then construct a weighted matrix by multiplying the all element of each column with the respective weight of the factor as shown in Table 4.
Table 4: Weighted matrix
Factors Organization 1 (0.4) 2 (0.1) 3 (0.2) 4 (0.3)
A 0.268 0.057 0.125 0.3
B 0.4 0.043 0.15 0.099
C 0.132 0.1 0.2 0.234
D 0.232 0.071 0.05 0.132
Now add all the rows to determine the rank of each industry.
Industry A = 0.268 + 0.057 + 0.125 +0.3
Industry B = 0.4 + 0.043 + 0.15 + 0.099
Industry C = 0.132 + 0.1 + 0.2 + 0.234
Industry D = 0.232 + 0.071 + 0.05 + 0.132
Hence,
Industry A = 0.75
Industry B = 0.692
Industry C = 0.666
Industry D = 0.485
The score of the industries indicates the rank of the industries and Industry A is the best Industry as it scores highest rank whereas Industry B is the worst as it scores the last rank.
CONCLUSION
To predict or compare the performance of a manufacturing process, it is necessary to analyze various factors and their effect. Therefore, a mathematical model is required to correlate the different factors, sub-factors to evaluate and compare the manufacturing processes. The present works undertakes the application of Simple Additive Weightage technique in measuring quality of manufacturing organizations.
REFRENCES
1.
Malczewski J. (1997). Propogation of errors inmulticriteria location analysis: a case study, In: fandel, G.,
Gal, T. (eds.) Multiple Criteria Decision Making,
Springer- Verlag, Berlin, 154-155.
2.
Janssen R. (1992). Multiobjective Decision Support forEnvironmental Management. Kluwer Academic,
Dordrecht, 232 p.
3.
Eastman J. R. (1993). IDRISI: A grid based GeographicAnalysis System, version 4.1. Graduate School of
Geography, Clark University, Worcester
4.
Churchman C.W. and Ackoff R.L. (1954). An approximatemeasure of value, Journal of Operations Research Society
[image:4.612.26.302.406.548.2]