Technology (IJRASET)
©IJRASET 2014: All Rights are Reserved
403
Attacking Behaviour of Computer Worms on
E-Commerce Network: A Dynamic Model
Biswarup Samanta#1, Samir Kumar Pandey (S.K. Pandey)#2 #1
Department of Computer Science, Usha Martin Academy, Ranchi, India
#2
Department of Mathematical Sciences, Polytecnico di Torino, Turin, Italy
Abstract— The growth of Information System of any organization is not revolutionary, but it is evolutionary. The organization may start their computer network by connecting the few nodes from the very selective number of departments. As the time passes, the computer network of the organization also grows with the growth of their business. When the e-commerce of the organization is in maturity stage, it can capture/perform the transactions between the organization and its suppliers, between the organization and its customers and the transactions within the organization. Now the biggest threat to this e-commerce network is the presence of malware (worms, virus, etc.) within the network. To counter the attack of malware to the network several approaches are taken, out of which uses of antivirus is very popular and effective approach. Here in this paper, using epidemic model, we propose Susceptible(S) - Susceptible with Protection (Sp) - Infected (I) - Quarantine (Q) (S-Sp-I-Q) model to capture the dynamics of worm propagation in the e-commerce network. We have also used MATLAB to simulate and analyze the behaviour of different classes of nodes of the proposed model, among each other and with respect to time.
Keywords— e-commerce, virus, worms, epidemic model, dynamic model, mathematical model, security
I. INTRODUCTION
Online shopping is the buzzword in today’s world. Top organizations from various industries like banking, finance, automobiles, retail, telecomm, education are using their ecommerce network to reach to their customer or vice-versa. Customers are using the client software at their end, which may be desktop, laptop or mobile and searching for their required products or services and then they are placing their order to that organization through the browser. And the organization seating at the server side, using server software, getting the order placed by their customer. Then this order propagates through various departments of that organization, which are connected through intranet and finally the product is manufactured or outsourced and delivered to their customer and the customer can also make the payment online through a third party.
The category of ecommerce which is discussed above is known as B2C type ecommerce. Examples of B2C type ecommerce are amazone.com, flipkart.com, etc. Similarly we have other categories of ecommerce like B2B, C2C, B2G, C2B, etc. In B2B type ecommerce, the business organization sells products or services to other business organizations or brings multiple buyers and sellers together in a central marketplace; e.g. metalsite.com. In C2C type ecommerce, consumers sell directly to other consumers via online classified ads and auctions or by selling personal services or expertise online, e.g. ebay.com. In B2G model, business organization sells to local, state and federal agencies; e.g. iGov.com. The C2B model, also called a reverse auction or demand collection model, enables buyers to name their own price, often binding, for a specific good or service generating demand. The website collects the “demand bids” and then offers the bids to the participating sellers. The examples of C2B e-commerce models are reverseaution.com and priceline.com, etc.
So it is the requirement of all the above mentioned e-commerce model to connect all the departmental workstations through the intranet. Here the growth of the e-commerce network may be vertical and / or horizontal; i.e. its growth may be hybrid. Each department of the organization has its own data and the data of their customers and all of these data are stored in the server(s) and all the workstations are connected to that server to store and retrieve those data as when required by the respective applications.
II. FORMULATION OF EPIDEMIC MODEL OF WORM SPREAD IN E-COMMERCE NETWORK
Dynamic models for infectious diseases or computer malware are mostly based on compartment structures that were initially proposed by Kermack and McKendrick [9]-[11] and later developed by other mathematicians. To formulate a dynamic model or the transmission of an epidemic disease, the population in a given region is often divided into several different groups or compartments. Such a model describing the dynamic relations among these compartments is called a compartment model. Quarantine being the important remedial processes for malware attack in e-commerce network, several researchers developed model taking quarantine as one of the compartment in the epidemic models [13]-[16].
The total number of nodes (N) in our e-commerce network is divided into four classes (compartments) : Susceptible (S), Susceptible with Protection (Sp), Infected (I), Quarantine (Q). That is,
S + Sp + I + Q = N (1)
A. Susceptible(S) Class
This class includes those nodes of the network which are free from infection i.e. they are healthy but they have an active potential threat of infection by the malicious software at any point of time. These nodes do not include antivirus software.
Susceptible with Protection (Sp) Class: This class includes those nodes of the network which are protected by the firewall and/or antivirus software.
B. Infected (I)
The nodes of this class includes the units that have been infected and which now have the potential to transmit the malicious software to the rest of the nodes of the population on having adequate contacts with the Susceptible and ‘Susceptible with Protection’ class of the population.
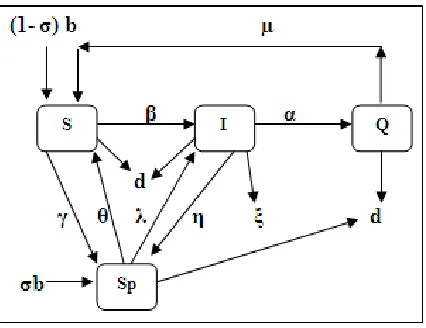
Quarantine (Q): This class is used to separate the infectious nodes which may have been exposed to any infected node to see if that become affected. Once the nodes are added to the network it becomes the member of the S class. Initially all the nodes belong to the S class. Once the antivirus software is installed into the nodes of the S class, it moves to the Sp class. If a node from S class is attacked by any virus or worms, then it moves to the I class. This model also assumes that the antivirus software may not be too much effective as it may be an expired version which has not been updated. In that case the nodes with expired version of antivirus software, may be moved back to the S class again or due to attack of antivirus that node may move directly to I class. This model also assumes that a node from I class may rescued by cleaning the malware from that node through the use of updated antivirus software. In that case, it moves back to the Sp class, otherwise that node is moved to the Q class. The nodes from the Q class are moved to the S class once it is confirmed that the node is free from any affect of malware.
The above fact can be shown graphically by using the following model in Fig. 1.
Fig. 1 (S – Sp – I – Q) Model – An epidemic model for the flow of worms in the e-commerce network.
The transmission between model classes can be expressed by the following system of differential equations:
dS / dt = (1- σ) b + µQ + θSp - βSI – γS – dS (2)
[image:3.612.186.399.473.637.2]Technology (IJRASET)
©IJRASET 2014: All Rights are Reserved
405
dI / dt = βSI + λSp – ηI – ξI – dI – αI (4)
dQ / dt = αI – dQ - µQ (5)
where, b is the birth rate (new nodes attached to the network), d is the natural death rate , i.e; destroying of the computers because of the reason other than the attack of virus or worms, γ is the rate of execution of antivirus software initially (i.e; from class S to class Sp), θ is the rate of transfers of computer nodes from class Sp to class S, β is the rate of contact from class S to class I, α is the rate of quarantine from class I to class Q, µ is the rate of susceptible after recovery from class Q to class S, σ is the fraction of computer nodes (not belonging to the above mentioned classes, viz; S, Sp, I, and Q) on which we execute antivirus software and directly introduced at the class Sp, λ is the rate by which the nodes from the class Sp are infected by the malware are transformed to class I, ξ is the death rate (destroying of computer nodes) due to the attack of malware and η is the rate by which infected computers are recovered by updated antivirus and transferred back to the Sp class, i.e; from class I to class Sp.
Using equation (2), (3) and (4), we get the value of Q, S and Sp as follows:
Q = [α / (d + µ)] * I (6)
S = [(θ+d+λ)*1/λ*(η+ξ+d+α)] / [(γ*1/I) + {β (θ+d+λ)*1/λ}] (7)
Sp = 1/λ [η+ξ+d+α-β*[[(θ+d+λ)*1/λ*(η+ξ+d+α)] / [(γ*1/I) +{β(θ+d+λ)*1/λ}]]]*I (8)
III.ANALYSING THE STABILITY OF THE MODEL BY USING SIMULATION THROUGH MATLAB
A. Changes of Quarantine nodes over Time
Fig. 2 Changes of quarantine over time when Q = 10, 20 & 30 respectively
The above figure (Fig. 2) shows the dynamic behavior of the system when quarantine nodes are changed over time. The above figure supports the fact that quarantine is one of the remedies to make your system stable. It is shown from the above figure (Fig. 2) that as the time passes, the system become stable by reducing the population of quarantine class.
B. Changes of Infected nodes over Time
The above figure (Fig. 3) shows the changes of the population of infected class over time. It shows that the influence of antivirus software supersedes the effect of the rate of contact by the infected nodes.
C. Changes of Infected nodes over the changes of Quarantine nodes
Fig. 4 Dynamic behaviour of Infected class versus Quarantine class when
function1: σ =0.09; µ =0.05; θ =0.07; β =0.03; γ =0.02; η=0.06; λ=0.04; ξ=0.03; α=0.08; b=0.07; d=0.01 function2: σ =0.08; µ =0.06; θ =0.08; β =0.05; γ =0.03; η =0.05; λ =0.05; ξ=0.04; α=0.09; b=0.09; d=0.02
The above figure (Figure 4) shows the stability of the system by simulating the changes in infected classes over the changes in quarantine classes. It shows that, as the numbers of infected nodes are detached from the network, the population of nodes in infected class decreases.
D. Susceptible with Protection versus Quarantine
Fig. 5 Dynamic behavior of Quarantine class versus Susceptible with Protection class when
function1:σ =0.09; µ =0.05; θ =0.07; β =0.03; γ =0.02; η=0.06; λ=0.04; ξ=0.03; α=0.08; b=0.07; d=0.01 function2:σ =0.08; µ=0.06; θ =0.08; β =0.05; γ =0.03; η =0.05; λ =0.05; ξ=0.04; α=0.09; b=0.09; d=0.02
Technology (IJRASET)
©IJRASET 2014: All Rights are Reserved
407
software installed in it into the network, initially it may increase the quarantine nodes of that network, but finally, it may decrease the quarantine nodes from the network. And it may increase the throughput of the overall network.
E. Susceptible with Protection versus Infected
Fig. 6 Dynamic behavior of infected class versus Susceptible with Protection class when
function1:σ =0.09; µ =0.05; θ =0.07; β =0.03; γ =0.02; η=0.06; λ=0.04; ξ=0.03; α=0.08; b=0.07; d=0.01 function2:σ =0.08; µ =0.06; θ =0.08; β =0.05; γ =0.03; η =0.05; λ =0.05; ξ =0.04; α=0.09; b=0.09; d=0.02 function3: σ =0.09; µ =0.04; θ =0.07; β =0.07; γ =0.05; η =0.06; λ =0.03; ξ =0.06; α =0.07; b=0.08; d=0.03
The more we add the nodes which contain antivirus software installed in it into the network, the more it is likely that more nodes will be affected by the malware. This fact is also reflected in the above mentioned figure (Figure 6). It may happen due to non-updating of the antivirus software of the organization or the introduction of a new malware which are not been treated by the current antivirus software of that organization. So it is the responsibility of organization to reduce the number of infected nodes by recovering the infected nodes using the updated antivirus software.
F. Behavior of Different Classes of Nodes With Respect To Time
Fig. 7 Dynamic Behavior of Different Classes of Nodes with Respect to Time when σ =0.09; µ =0.05; θ =0.07; β =0.03; γ =0.02;
η=0.06; λ=0.04; ξ=0.03; α=0.08; b=0.07; d=0.01
Our proposed model contains four classes of nodes, viz; Susceptible(S) - Susceptible with Protection (Sp) – Infected (I) - Quarantine (Q) to represent the propagation of worms in e-commerce network.
maintain a stable number of nodes in it. The nodes in Sp and Q classes increase initially and then decreases with time.
Installation of updated antivirus may contribute to the increase of nodes in Sp classes. The above figure shows the sudden increase of nodes in I class due to the non identification of the presence of the malware in the network. Once the malware is identified and removed by the updated antivirus software, it contributes to the sharp decrease in the number of nodes in I class.
IV.CONCLUSION
Understanding the cyber threat is the first step in defending against it [12]. There are many issues involved in securing the e-commerce network which is connected to the internet, e.g.; Malware infection, Being fraudulently represented as sender of phishing messages, Password sniffing, Denial of Service, etc.; out of which the malware infection continued to be the most commonly seen attack (2010 CSI Computer Crime and Security Survey). The spread of worms in the e-commerce network is epidemic in nature. We have developed an epidemic model for the spread of worms in e-commerce network where infected nodes are quarantined from the network. We have also used MATALB to simulate and analyze the behavior of different classes’ of nodes among themselves and with respect to time to study the stability of the system. We observed that quarantining the highly infectious e-commerce nodes have positive contribution to the stability of the system. Continuous study of the system at different states of the e-commerce network may contribute to the stability of the system.
REFERENCES
[1] B.K. Mishra, S.K. Pandey, Dynamic Model of worms with vertical transmission in computer network, Appl. Math. Comput. 217 (21) (2011) 8438–8446, Elsevier.
[2] B.K. Mishra, S.K. Pandey, Fuzzy epidemic model for the transmission of worms in computer network, Nonlinear Anal.: Real world Appl. 11 (2010) 4335– 4341.
[3] B.K. Mishra, S.K. Pandey, Effect of antivirus software on infectious nodes in computer network: a mathematical model, Phys. Lett. A 376 (2012) 2389– 2393. Elsevier.
[4] Erol Gelenbe, Varol Kaptan, YuWang, Biological metaphors for agent behaviour, in: Computer and Information SciencesISCIS 2004, 19th International Symposium, in: Lecturer Notes in Computer Science, vol. 3280, Springer-Verlag, 2004, pp. 667-675.
[5] Bimal Kumar Mishra, Navnit Jha, Fixed period of temporary immunity after run of anti-malicious software on computer nodes, Appl. Math. Comput. 190 (2), 2007, 1207-1212.
[6] J.R.C. Piqueira, B.F. Navarro, L.H.A. Monteiro, Epidemiological models applied to virus in computer network, J. Comput. Sci. 1 (1), 2005, 31-34. [7] S. Forest, S. Hofmeyr, A. Somayaji, T. Longstaff, Self-nonself discrimination in a computer, in: Proceeding of IEEE Symposium on Computer Security and Privacy, 1994, pp. 202-212.
[8] Y.Wang, C.X.Wang, Modelling the effect of timing parameters on virus propagation, in: 2003 ACM Workshop on Rapid Malcode, ACM, 2003, pp. 61-66. [9] W.O. Kermack, A.G. McKendrick, Contributions of mathematical theory to epidemics, Proc. R. Soc. Lond. Ser. A 115, 1927, 700-721.
[10] W.O. Kermack, A.G. McKendrick, Contributions of mathematical theory to epidemics, Proc. R. Soc. Lond. Ser. A 138, 1932, 55-83. [11] W.O. Kermack, A.G. McKendrick, Contributions of mathematical theory to epidemics, Proc. R. Soc. Lond. Ser. A 141, 1933, 94-122. [12]http://www.ncxgroup.com/wpontent/uploads/2012/02/CSIsurvey2010.pdf
[13] Bimal Kumar Mishra and Navnit Jha(ELSEVIER),SEIQRS model for the trans-mission of malicious objects in computer nework,34(2010)710-715. [14] D.Moore, C.Shannon, G.M.Voelker, S. Savage, Internet quarantine: requirements for containing self C propagating code, in: Proceedings of IEEE INFOCOM 2003, IEEE, 2003.
[15] P. De, Y. Liu, S.K. Das, An epidemic theoretic framework for evaluating broad-cast p protocols in wireless sensor networks, in: Proc. IEEE (Intl Conf. on Mobile Adhoc and sensor systems (MASS), (Pisa, Italy), Oct. 2007.
[16] C.C. Zou, W. Gong, D. Towsley, Worm propagation modelling and analysis under dynamic quarantine defence, in: Proceedings of the ACM CCSWorkshop on Rapid Malcode, ACM, 2003, pp. 51C60.
[17] Bimal K. Mishra, Navnit Jha, SEIQRS model for the transmission of malicious objects in computer network, Appl. Math. Model. 34 (2010) 710-715. [18] J.R.C. Piqueira, F.B. Cesar, Dynamic models for computer virus propagation, Math. Probl. Eng. doi:10.1155/2008/940526.
[19] E. Gelenbe, Dealing with software viruses: a biological paradigm, Inform. Secur. Tech. Rep. 12 (4), 2007, 242-250.
[20] Erol Gelenbe, Keeping viruses under control, in: Computer and Information Sciences-ISCIS 2005, 20th International Symposium, in: Lecturer Notes in Computer Science, vol. 3733, Springer, 2005..
[21] Ma.M Williamson, J. Leill, An epidemiological model of virus spread and cleanup, 2003; http://www.hpl.hp.com/techreports/.
BIBLIOGRAPHY
[1] Dave Chaffy; E-Business and E-Commerce Management, 3e; Pearson [LPE]
[2] Vladimir Zwass; Electronic Commerce and Organizational Innovation: Aspects and Opportunities, Spring, 2003. [3] P.T. Joseph, S.J; E-Commerce – An Indian Perspective, 3e; PHI [EEE]
[4] R. M. Anderson, R.M. May, Infectious Diseases of Humans, Oxford Univ. Press, London/New York, 1991.