R E S E A R C H
Open Access
Imperfect centered miRNA binding sites are
common and can mediate repression of target
mRNAs
Hilary C Martin
1,2, Shivangi Wani
1,5, Anita L Steptoe
1, Keerthana Krishnan
1, Katia Nones
1, Ehsan Nourbakhsh
1,
Alexander Vlassov
3, Sean M Grimmond
1,4and Nicole Cloonan
1,5*Abstract
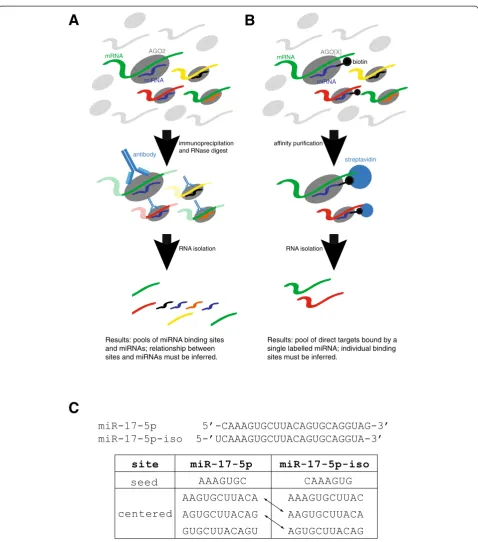
Background:MicroRNAs (miRNAs) bind to mRNAs and target them for translational inhibition or transcriptional degradation. It is thought that most miRNA-mRNA interactions involve the seed region at the 5′end of the miRNA. The importance of seed sites is supported by experimental evidence, although there is growing interest in interactions mediated by the central region of the miRNA, termed centered sites. To investigate the prevalence of these interactions, we apply a biotin pull-down method to determine the direct targets of ten human miRNAs, including four isomiRs that share centered sites, but not seeds, with their canonical partner miRNAs.
Results:We confirm that miRNAs and their isomiRs can interact with hundreds of mRNAs, and that imperfect centered sites are common mediators of miRNA-mRNA interactions. We experimentally demonstrate that these sites can repress mRNA activity, typically through translational repression, and are enriched in regions of the transcriptome bound by AGO. Finally, we show that the identification of imperfect centered sites is unlikely to be an artifact of our protocol caused by the biotinylation of the miRNA. However, the fact that there was a slight bias against seed sites in our protocol may have inflated the apparent prevalence of centered site-mediated interactions.
Conclusions:Our results suggest that centered site-mediated interactions are much more frequent than previously thought. This may explain the evolutionary conservation of the central region of miRNAs, and has significant implications for decoding miRNA-regulated genetic networks, and for predicting the functional effect of variants that do not alter protein sequence.
Background
MicroRNAs (miRNAs) are small non-coding RNAs (ap-proximately 22 nucleotides) that regulate the expression of protein-coding genes in association with the RNA-induced silencing complex (RISC). They are present in most eukaryotic cells, have been predicted to affect the expression of over 60% of mammalian genes [1], and have been implicated in multiple cellular processes and human diseases. They can repress their targets via sev-eral mechanisms: preventing translation initiation or elongation, directing mRNA cleavage, and prompting
mRNA decay [2]. It was thought that miRNA-mRNA in-teractions almost always involved contiguous and perfect Watson-Crick base-pairing between the miRNA 'seed re-gion' and the mRNA target [3], and that binding outside the seed served to augment imperfect seed binding [3].
The attractive simplicity of using nucleotide comple-mentarity to identify mRNA targets has given rise to many bioinformatics tools. These are based (to differing extents) on complementarity to the seed, evolutionary conservation, and free energy of binding [4]. The pres-ence of canonical seed sites (in the abspres-ence of other more extensive complementarity to the miRNA) is by far the most discriminatory feature for target prediction [5], and incorporation of other modes of binding dra-matically reduces the accuracy of these programs [6,7]. However, results from our lab [8] and others [6,9,10] suggest that even the best algorithms have false positive
* Correspondence:[email protected] 1
Queensland Centre for Medical Genomics, Institute for Molecular Bioscience, The University of Queensland, Brisbane, St Lucia QLD 4072, Australia 5
QIMR Berghofer Medical Research Institute, Genomic Biology Laboratory, 300 Herston Road, Herston, QLD 4006, Australia
Full list of author information is available at the end of the article
rates of 20 to 40%, and any non-seed interactions will be absent from these predictions. In order to comprehen-sively understand the cohort of direct miRNA targets, unbiased transcriptome-wide experimental methods are needed.
A common experimental approach to determining miRNA targets has been to transfect cells with an ex-ogenous miRNA or knock down an endex-ogenous one and measure the resulting change in mRNA or protein levels of each gene [6,7]. This approach is problematic because many of the effects observed may be due to changes in the levels of transcription factors that are targeted by the miRNA, rather than being direct consequences of miRNA binding [8]. Sequencing-based methods such as high-throughput sequencing of RNAs isolated by crosslinking immunoprecipitation (HITS-CLIP) and photoactivatable-ribonucleoside-enhanced crosslinking and immunoprecip-itation (PAR-CLIP) [11,12] identify fragments of mRNA bound by Argonaute proteins (usually AGO2) and a pool of miRNAs, and infer the interactions between them bioinformatically (Figure 1A). This approach is an excel-lent tool to understand the genome-wide occupancy of RISCs, but is not suitable for the comparative evaluation of sites between closely related miRNAs, since it does not retain the information about which miRNAs are bound to which sites. An alternative approach is to transfect cells with a synthetic biotinylated miRNA, perform streptavidin purification, and profile the captured mRNA population via microarray or sequencing (Figure 1B) [13-18]. Al-though the introduction of a synthetic molecule into a cellular system is not ideal, this approach provides high-quality data for the inference of binding sites for single miRNAs, and provides the opportunity to measure target affinity between very closely related miRNAs, even those with a single nucleotide difference [13].
While most experimental effort has been directed at verifying seed-based interactions, non-seed based inter-actions have also been demonstrated, albeit far less fre-quently [3,7,19,20]. The most common variations appear to be 'seed-like' with mismatches or wobble in positions 5, 6, and 7 [20], and 'G-bulge' sites, in which the mRNA nucleotide that would normally pair with position 6 of the miRNA is bulged out of the interaction [19]. The strong evolutionary conservation of the central region of miRNAs [7] prompted a successful search for 'centered site'-mediated miRNA activity, demonstrating that 11 nucleotides of perfect complementarity starting at pos-ition 3, 4 or 5 could inhibit mRNA translation [21]. However, these centered sites were found only occasion-ally within the human transcriptome, similar in fre-quency to the 3′supplementary and 3′ complementary sites that together account for <10% of interactions [3]. It remains an open question as to why the central region of miRNAs is strongly conserved; it may be driven by
miRNA-mRNA interactions and/or by miRNA biogen-esis. We hypothesized that imperfect centered sites could mediate miRNA-mRNA interactions, and that they are more commonly used than results from degra-dome sequencing would suggest. To test this hypothesis, we employed the biotin pull-down approach [13] to identify the direct miRNA targets for 10 carefully se-lected miRNAs (Table S1 in Additional file 1). We included two closely related miRNAs, 10a and miR-10b, which share identical seed sites, but differ by a sin-gle nucleotide in the center region. We also included four shifted isomiRs, which are miRNAs produced from the same pre-miRNA as the 'canonical' mature miRNA, but differing in 5′and/or 3′end cleavage [13,22]. These isomiRs provide an ideal naturally occurring biological control, as the centered sites are shared between a miRNA and its isomiR, whilst the seed sites differ (Figure 1C). We show that imperfect-centered sites are common mediators of mRNA interactions, a finding that may explain the evolutionary conservation of the central region of miRNAs, and that will be important for decod-ing miRNA-regulated genetic networks.
Results
Biotin pull-downs identify hundreds of miRNA-mRNA interactions
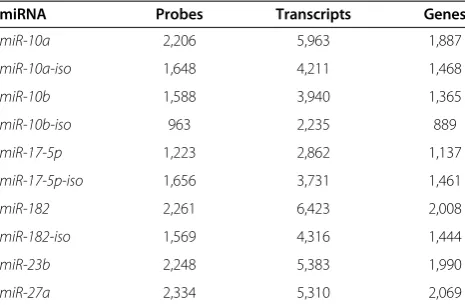
To identify direct miRNA targets, we transfected 4 × 10⁶ HEK293T cells with 200 pmols synthetic biotinylated miRNA duplexes (Table S1 in Additional file 1). This very low ratio of duplex to cells was critical to avoid some of the problems with introducing an exogenous molecule on miRNA-mRNA stoichiometry, and we confirmed that transfection at this level made no sub-stantial alterations to endogenous transcriptional net-works (Figure S1A in Additional file 2). We then performed streptavidin purifications, and profiled the captured mRNA population via microarrays. At a 5% false discovery rate (FDR; see Materials and methods), between 963 (miR-10b-iso) and 2,261 (miR-182) micro-array probes detected significantly higher expression in the biotin pull-down samples than in the mock-transfected controls (Table 1). The distribution of fold-changes observed for each miRNA duplex is plotted in Additional file 3. We considered the Ensembl (V62) transcripts with exact matches to these probes to be pu-tative targets of the miRNA, identifying an average of 1,572 target genes per miRNA (Table 1). These numbers correspond well to those obtained by other experimental approaches [12,23,24].
Predicted and validated targets are significantly enriched in the biotin pull-downs
A
B
AGO2 AGO[X]
mRNA mRNA
miRNA miRNA
biotin
antibody
streptavidin
immunoprecipitation and RNase digest
affinity purification
RNA isolation RNA isolation
Results: pool of direct targets bound by a single labelled miRNA; individual binding sites must be inferred.
Results: pools of miRNA binding sites and miRNAs; relationship between sites and miRNAs must be inferred.
[image:3.595.59.538.84.627.2]C
examined the concordance between our biotin pull-down results and miRNA targets that have been con-firmed by luciferase assays in the literature (Table S2 in Additional file 1). We excluded genes that were not tar-geted by an Illumina microarray probe (and therefore could not be detected by our biotin pull-down) or that were not expressed in HEK293T cells, leaving 93 genes for this analysis. Forty-three previously validated targets were enriched by biotin pull-downs (Table S2 in Additional file 1) in HEK293T cells, which was significantly more than expected by chance (Table S3 in Additional file 1; Fisher’s exact test (FET),P-value <1.01 × 10⁻¹²). Interest-ingly, a lower proportion of targets validated in non-HEK cell lines were confirmed by our biotin pull-down (43.2%) than targets validated in HEK cell lines (51.4%), suggesting that cell type-specific factors can lower the concordance between orthogonal validation methods.
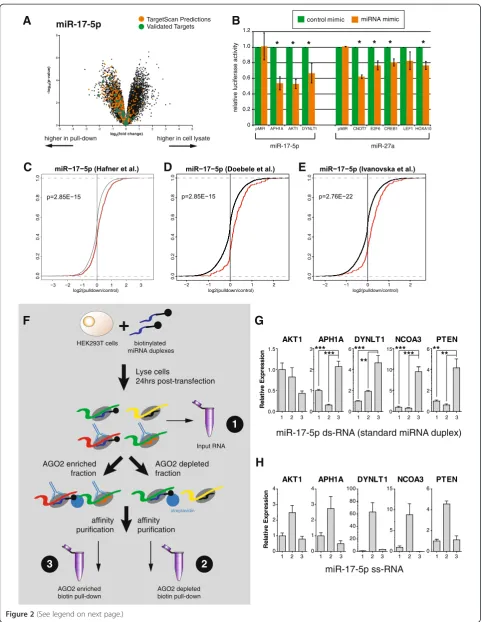
As a second control, we examined the number of bioinformatically predicted targets in our biotin pull-downs. Although bioinformatic predictions have many false positives (and an as yet undefined level of false negatives) [6,8-10], we would still expect to see an enrichment for predicted targets in each of our biotin pull-downs. Importantly, predictions can be made for the isomiRs used in this study, for which very few lucif-erase assays (or other experimental validation of targets) have been performed. We used TargetScan [1] to predict targets for each miRNA and isomiR, and compared each list to the significantly enriched genes in the correspond-ing pull-down. In each case, we observed an enrichment of TargetScan-predicted genes in the pull-down fraction (Figure 2A; Figure S1B,C in Additional file 2), and the overlap was significantly more than expected by chance (Table S3 in Additional file 1; FET, P< 9 × 10-180). We selected eight previously untested targets of miR-17-5p (3) and miR-27a (5) for experimental validation using
luciferase assays. TargetScan-predicted binding sites were cloned into the 3′UTR of a luciferase reporter construct, and co-transfected into HEK293T cells with either their predicted miRNA mimic or a control mimic. We found that seven of eight target sites had significantly (P≤0.05) reduced luciferase activity in the presence of a miRNA mimic compared to the control mimic (Figure 2B). As the rate of validation seen here (87.5%) greatly exceeds the validation rate of TargetScan predictions alone (39%) [8], this provides substantial experimental evidence that the biotin pull-downs are enriching for genuine and direct tar-gets of the miRNAs.
[image:4.595.57.290.111.264.2]As a third control, we compared the biotin pull-down results to those obtained using both PAR-CLIP [12] and miR-17-5p over-expression studies [23,24]. The PAR-CLIP experiment was conducted in HEK293 cells, which differs from the HEK293T cells used in our experiments by the exogenous expression of the SV40 large T antigen. This protein binds to and inactivates the p53 transcrip-tion factor [25], so the gene expression patterns between these cell lines differ. The over-expression experiments were also performed in very different cell lines (human umbilical vein endothelial cells (HUVECs) [23] and HCT116 cells [24]), and therefore we do not expect a perfect overlap between the targets detected between these orthogonal methods. By comparing the distribu-tion of the miR-17-5p fold-change observed in this study between the transcripts that were detected as targets in previous studies and those that were not, we observed a significantly greater fold-change in the corresponding biotin pull-down in the former class (Figure 2C-E; Additional file 4; Kolmogorov-Smirnov tests, P-values from 1 × 10⁻²to 1 × 10-22). Additionally, the overlaps be-tween our inferred miRNA target sets and those de-duced from the other studies were significantly greater than expected by chance (Table S3 in Additional file 1; FET, P-values from 4.68 × 10⁻² to 5.17 × 10⁻²⁰), although the enrichment was modest (odds ratio (OR) = 1.85; 95% confidence interval (CI) 1.7 to 2.1). Finally, although biotin-labeled miRNAs have been previously shown to incorporate into RISC [17], we wanted to be sure that our results were dependent on RISC association, and not due to cytoplasmic binding of free biotin-labeled miRNAs. To test this, we performed a hybrid AGO immune-precipitation and biotin pull-down (Figure 2F). HEK293T cells were transfected with either a stand-ard biotinylated, double-stranded miR-17-5p miRNA duplex, or with a biotinylated single-stranded miR-17-5p sequence. Cells were lysed and subject to AGO immune-precipitation, creating an AGO2 enriched and AGO2-depleted fraction. Each fraction was then subject to a biotin pull-down, and the relative enrichment compared to input RNA (Figure 2F) was measured by quantitative RT-PCR (qRT-PCR). We specifically assessed the levels of
Table 1 Number of inferred targets for each miRNA tested
miRNA Probes Transcripts Genes
miR-10a 2,206 5,963 1,887
miR-10a-iso 1,648 4,211 1,468
miR-10b 1,588 3,940 1,365
miR-10b-iso 963 2,235 889
miR-17-5p 1,223 2,862 1,137
miR-17-5p-iso 1,656 3,731 1,461
miR-182 2,261 6,423 2,008
miR-182-iso 1,569 4,316 1,444
miR-23b 2,248 5,383 1,990
miR-27a 2,334 5,310 2,069
A
-5 -4 -3 -2 -1 0 1 2 3 4 5 0
2 4 6 8
log2(fold change)
-log
10
(p-value)
miR-17-5p TargetScan PredictionsValidated Targets
0 1 2
0.0 0.2 0.4 0.6 0.8 1.0 log2(pulldown/control)
0 1 2
0.0 0.2 0.4 0.6 0.8 1.0 vano log2(pulldown/control)
B
C
D
higher in cell lysate higher in pull-down
pMIR APH1A AKT1DYNLT1
0 0.2 0.4 0.6 0.8 1.0 1.2
relative luciferase activity
control mimic miRNA mimic
* * *
miR-17-5p miR-27a
E
pMIR CNOT7 E2F6 CREB1 LEF1
* * * HOXA10 * streptavidin
F
G
HEK293T cells Input RNA 1 biotinylated miRNA duplexes+
Lyse cells 24hrs post-transfection AGO2 enriched fraction AGO2 depleted fraction affinity purification affinity purification AGO2 depleted biotin pull-down 2 AGO2 enriched biotin pull-down 3H
AKT1 Re la iv e E xp res si o nAPH1A YNLT1 NCOA3 PTEN
1 2 3 0.0 0.5 1.0 1.5
1 2 3 0 1 2 3
1 2 3 0 2 4 6
1 2 3 0 5 10 15
1 2 3 0 2 4 6
1 2 3
0 1 2 3 4
1 2 3
0 1 2 3 4
1 2 3
0 20 40 60 80 100
1 2 3
0 5 10 15
1 2 3
0 2 4 6 AKT1 Re la ive Exp ressi o n
APH1A YNLT1 NCOA3 PTEN
miR-17-5p ds-RNA (standard miRNA duplex)
miR-17-5p ss-RNA
0 1 2
[image:5.595.57.540.86.709.2]0.0 0.2 0.4 0.6 0.8 1.0 log2(pulldown/control) 3 *** *** *** ** *** *** ****
the three novel seed sites identified above (Figure 2B) and two previously validated miRNA binding sites [8]. As endogenous RISC loading preferentially requires double-stranded miRNA duplexes [26,27], we would expect double-stranded but not single-stranded molecules to en-rich for targets in an AGO2 precipitation. Four of five tar-gets were found to be enriched in the AGO2 enriched fraction when a double-stranded molecule was used (Figure 2G), and but not when a single-stranded molecule was used (Figure 2H). This, when considered along with the data presented above, confirms that the biotin pull-down is consistently enriching for genuine targets of miRNAs, although we do not know if or how these inter-actions result in target repression.
Biotin pull-downs are less likely to enrich for destabilized mRNAs, but have low rates of false positive target identification
If we are to use the biotin pull-downs to characterize non-seed site interactions, then it is important to under-stand the limitations of this protocol. To start character-izing the potential false negatives of the biotin pull-down approach, we selected six genes that we had previously re-ported to be targets of miR-17-5p that were not enriched in our pull-down [8]. We used qRT-PCR to determine whether these mRNA targets were destabilized by miR-17-5p and therefore less likely to appear as significantly enriched in the biotin pull-down. After transient transfec-tion with biotinylated miR-17-5p (replicating the condi-tions of the biotin pull-down) we observed significant degradation of five of the six genes (Additional file 5). This result suggests that mRNA degradation probably affects whether or not a target can be detected via the biotin pull-down approach, and suggests that the concordance be-tween biotin pull-down and luciferase assay could be higher when only comparing targets that are translation-ally regulated.
We then wished to examine the impact of transcrip-tional complexity on our interpretation of the microarray
results. Specifically, we were curious about the subset of transcripts (average 19%) that were significantly enriched in the pull-down but that had no predicted binding sites (either seed sites or any type of centered sites, discussed below) in their annotated exons. We hypothesized that this set may contain examples of unannotated exons and that this could lead to the incorrect classification of these targets as false positives. To investigate this possibility, we performed strand-specific RNAseq from the RNAs cap-tured in the biotinylated miR-17-5p pull-down experi-ment. We examined all 26 HUGO genes that were targeted by an Illumina probe that was significantly enriched in the pull-down, that had exact matches only to transcripts with no predicted miR-17-5p seed and perfect or imperfect centered binding sites, and that predomin-antly spanned unique genomic regions to which the se-quencing reads could be mapped [28]. Of these, eight clearly had either extended 3′UTRs (HMBOX1,TBPL1,
ZNF786, NDUFAF3) or retained introns (C2orf34, COQ 10B) or both (C16orf68, EEF1E1), and, in all cases, these extra regions contained miR-17-5p seed or centered sites (Figure 3). Two additional genes (ERLEC1,UBB) showed weak evidence for retained introns or extended 3′ UTRs that contained miR-17-5p sites. This suggests that almost 40% of the genes that we had initially assumed to be false positives were in fact likely to be true targets.
Hundreds of miRNA-mRNA interactions are mediated by centered sites
Having confirmed to our satisfaction that the biotin pull-downs could provide a high level of sensitivity for examining non-seed mediated interactions, we then searched for putative seed and perfect or imperfect cen-tered binding sites (Figure 1C; Additional file 6) of each of our 10 miRNAs in the transcripts detected by the microarray probes. We asked what proportion of puta-tive miRNA targets could be explained by the presence of these sites (Additional file 7). Studies that measured the change in protein output after miRNA transfection
(See figure on previous page.)
found that 50 to 70% of down-regulated proteins (log2 fold-change < -0.5) had a seed site [6,10] for the relevant miRNA. Hafner et al. [12] reported that 50% of their PAR-CLIP clusters contained a seed site for one of the top 100 most expressed miRNAs in HEK293 cells. We found that, on average, 41.3% (standard deviation 10.1%) of significantly enriched transcripts contained one or more seed sites for the biotinylated miRNA. When cen-tered sites were considered, allowing for GU wobble and
up to one mismatch, we could account for substantially more of the significantly enriched targets (mean 82.7%, standard deviation 7.5%), suggesting that centered sites could indeed bind mRNAs on a large scale.
Shin et al. [21] reported that centered site matches were significantly associated with repression only if they involved perfect Watson-Crick base-pairing. However, we postulated that these sites might still be able to medi-ate interactions if they included GU pairs or a mismatch.
A
[image:7.595.59.538.90.536.2]B
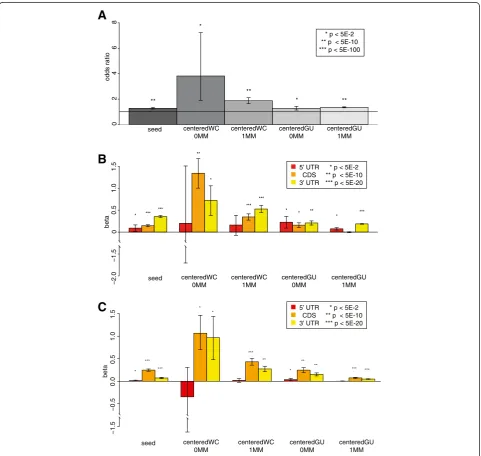
Thus, in our analysis, we considered centered sites with only Watson-Crick binding (centered-WC) or with GU wobble (centered-GU) and with either no mismatches (0MM) or with one mismatch (1MM) (that is, any base pair other than C-G, A-U or G-U). Centered sites with only Watson-Crick matches accounted for only a small proportion of the significantly enriched transcripts (0.5% and 6.6% for 0MM and 1MM sites, respectively), but a much greater proportion of these putative target tran-scripts contained centered-GU sites (12.5% and 72%);
thus, these were far more prevalent than seeds in our data set.
As expected, transcripts with seed sites were signifi-cantly over-represented in the putative target set com-pared to the non-target set when considering transcripts with only a single type of site (FETs; Figure 4A). Inter-estingly, the same significant over-representation was also seen for centered sites (with or without GU wobble or one mismatch), suggesting that they, too, might be mediating miRNA-mRNA interactions. To ensure that
odds r
atio
0
24
6
8
**
*
**
* **
seed
A
* p < 5E-2 ** p < 5E-10 *** p < 5E-100
centeredWC 0MM
centeredWC 1MM
centeredGU 0MM
centeredGU 1MM
* ***
***
**
*
*** ***
* * **
* ***
seed
beta
−1.5
0
0.5
1.0
1.5
−2.0
B
* p < 5E-2 ** p < 5E-10 *** p < 5E-20 5’ UTR
CDS 3’ UTR
centeredWC 0MM
centeredWC 1MM
centeredGU 0MM
centeredGU 1MM
beta
−1.5
−0.5
0.0
0.5
1.0
1.5
* ***
***
* *
*** **
* **
**
*** ***
seed centeredWC 0MM
centeredWC 1MM
centeredGU 0MM
centeredGU 1MM * p < 5E-2 ** p < 5E-10 *** p < 5E-20 5’ UTR
CDS 3’ UTR
[image:8.595.58.540.221.677.2]C
this was reproducible, and not an artifact of small sam-ple size, we repeated our analysis using all transcripts enriched in our pull-downs. For every site type, we again saw a significant over-representation of transcripts with a site amongst the putative target set, with the strongest enrichment being seen for the centered sites with perfect Watson-Crick pairing (Figure S7A in Additional file 8). These results suggest that the centered sites of the miRNA can mediate interactions with transcripts even in the absence of seed sites.
Centered sites can mediate interactions in the coding sequence and 3′UTR of mRNAs
To investigate whether the location of the putative miRNA binding sites affected whether or not a tran-script would be enriched in the pull-down, we fitted a logistic regression model for enrichment status, includ-ing the counts of each type of site within different tran-script regions as covariates (see Materials and methods). This model was highly significant (P< 0.0001), although it only explains a small fraction of the variance (Nagelk-erke r2= 0.04). As expected, the more seed sites there were in a transcript’s 3′UTR, the more likely it was to be significantly enriched in the pull-down (Figure 4B, left-most yellow bar). Interestingly, all types of centered sites in the 3′UTR were significantly associated with en-richment status (Figure 4B, yellow bars). Consistent with recent literature [6,20,29-32], most site types were sig-nificant in the coding sequence (CDS) too (Figure 4B, orange bars), although the effects were strongest in the 3′ UTR in most cases. Curiously, when we con-trolled for the length of the regions by fitting the logistic regression with site densities as covariates, the coeffi-cient estimates were greater for the CDS than the 3′ UTR (Figure 4C) for all site types. It may be that while miRNAs are more likely to target UTRs with more sites, there is a trade-off between the number and accessibility of sites (reflected by site density), and site accessibility is more important in the UTR than the CDS, perhaps because of mRNA secondary structure. Interestingly, though, the r2 was much lower for this model (0.008) than when we fit site counts as covariates, although it was still significant (P< 0.0001). To ensure that the lo-gistic regression was not being confounded by the inclu-sion of multiple transcripts bound by the same probe (which are not independent of one another), we ran the analysis again including only the canonical isoform of each gene. This did not substantially change the results (P< 0.0001, Nagelkerke r2= 0.05 for site count; P< 0.0001, Nagelkerke r2= 0.009 for site density; Figures S7B,C in Additional file 8). We conclude that centered sites can mediate interactions both within and outside the 3′ UTR, although 3′ UTR interactions are more
important, as has previously been shown for seed sites [33-35].
Similarity between target sets of canonical miRNAs and their isomiRs
If centered sites are indeed mediating biologically rele-vant interactions, then we would expect this to be reflected in the pattern of transcripts that are enriched in the biotin pull-down of both a canonical miRNA and its isomiR.
Since the isomiRs have different seed sites from their canonical partners but share overlapping centered sites, we might expect the transcripts they target in common (Figure 5) to be enriched for centered sites relative to the transcripts targeted by only one or the other. Con-versely, since miR-10a and miR-10b have the same seed but different centered sites, the transcripts targeted by both miRNAs might be enriched for seeds compared to transcripts targeted by only miR-10a or miR-10b. For this analysis, we excluded transcripts with multiple dif-ferent types of sites for the same miRNA. Although this approach lost some statistical power through the large reduction of transcripts, we still found statistical support (P≤0.05) for each of the five comparisons (miR-10a versus miR-10b; miR-10a versus miR-10a-iso; miR-10b versus 10b-iso; 182 versus 182-iso; miR-17-5p versus miR-miR-17-5p-iso), and a total of 14/20 of the observed enrichments confirmed our hypothesis (Table S4 in Additional file 1). For example, the transcripts that were enriched in the pull-downs of both miR-182 and miR-182-iso were significantly more likely to have a cen-tered site compared to the set enriched in only the miR-182 pull-down (one-sided FET; OR = 1.45; 95% CI 1.04 to 2.04; P= 1.9 × 10⁻²) or in only the miR-182-iso pull-down (OR = 2.07; 95% CI 1.54 to 2.8; P= 9.4 × 10⁻⁷). There was also a significant over-representation of tran-scripts with a seed site amongst the trantran-scripts targeted by miR-10a and miR-10b compared to those targeted by only miR-10a (OR = 2.13; 95% CI 1.3 to 3.6;P= 2.0 × 10⁻³). These results again support the hypothesis that centered sites in mRNAs can mediate interactions with miRNAs, although we cannot rule out the possibility that the transcripts pulled down by multiple miRNAs were being targeted by non-canonical sites other than the centered site.
Centered sites are enriched in AGO-bound regions
miR-155 deficient due to genetic knock out. Due to the high number of biological replicates (12 of each condition), the authors were able to robustly define 14,634 AGO2 bound regions, with 398 of these differentially detected only in wild type compared to knock out (adjusted
P< 0.05), and therefore likely to be directly mediated by miR-155. We exploited these data to look for the frequency and location of imperfect centered sites and seed sites relative to the peak. We first confirmed that seed sites were significantly enriched in differentially detected AGO peaks compared to AGO peaks that were unchanged between wild type and knock out (FET,
P≈8.07 × 10⁻³², n = 111), and were significantly skewed towards the center of the predicted peak (excess kur-tosis = 7.34; Figure 5D). We also observed enrichment and kurtosis for imperfect centered sites (FET, P≈
5.19 × 10⁻³, n = 29; excess kurtosis = 3.50; Figure 5E), although these sites were less frequent than seed sites. The overlap between seed and centered sites (n = 6) was not significantly different to what would be expected by chance (FET, P= 0.7887). Together these results suggest that imperfect centered sites can mediate en-dogenous miRNA-mRNA interactions independently of seed sites.
miR-10a miR-10a-iso
miR-10b miR-10b-iso
10009
86
307
58
267
132
52 101 710
21 357
76 349
91 332
508
A
miR-17-5p miR-17-5p-iso
398 928 738
9938
B
miR-182 miR-182-iso
1055 1341 327
9279
C
D
E
0 10 20 30 40 50 60
-30 -20 -10 0 10 20 30
WT
Relative location of predicted seed sites
F
requency (%)
0 10 20 30 40 50 60
-30 -20 -10 0 10 20 30
WT
Relative location of predicted centered sites
F
requency (%)
[image:10.595.67.538.89.532.2]KO KO
B
A
0 0.2 0.4 0.6 0.8 1.0 1.2
pMIR MAP2K3 MAPKAPK5 PPARG PPP2R5C PRKCI TGFBR2 RALB RHOA
centered sites (1MM) centered sites (0MM)
relativ
e
lucif
e
rase activity
*
*
*
*
*
*
*
pMIR R P IA P P P 2R 2B P R K A G 1 M A P K 3
*
*
*
centered sites (1MM)
centered site (0MM)
C
D
MAP2K3 MAPKAPK5 PPARG TGRFB2
1 2 3
0 10 20 30 40 50
1 2 3
0 5 10 15
1 2 3
0 2 4 6 8
1 2 3
0 10 20 30
PPP2R2B
Re
la
ti
v
e
Ex
p
re
s
s
io
n
PRKAG1 RP1A
1 2 3
0 20 40 60 80
1 2 3
0 1 2 3
1 2 3
0 2 4 6 8 10
Re
la
ti
v
e
Ex
p
re
s
s
io
n
miR-17-5p miR-27a
E
F
control mimic miR-17-5p mimic
R
e
la
ti
ve
E
x
pr
essi
on
0 1.0 2.0 1.8 1.6 1.4 1.2
0.8 0.6 0.4 0.2
R
e
la
ti
ve
E
x
pr
essi
on
0 1.0 2.0 1.8 1.6 1.4 1.2
0.8 0.6 0.4 0.2
control mimic miR-27a mimic
MAP2K3 MAPKAPK5 PPARG TGRFB2 PPP2R2B PRKAG1 RP1A
PMIR PMIR
miR-17-5p miR-27a
control mimic test mimic
*
*
**
***
***
*
*
***
***
***
***
*
[image:11.595.56.540.85.699.2]*
*
Imperfect centered sites primarily suppress target mRNAs through translational inhibition
Although our results suggest that imperfect centered sites can direct RISC to mRNAs, it does not necessarily follow that those sites can mediate repression of gene expression. To address this specific question, we ran-domly selected 12 genes that were both significantly enriched in the biotin pull-down experiment and had only a single centered miRNA binding site in the tran-script, for testing via luciferase assay (Figure 6). All but one of the centered sites included GU wobble, and 9 of them also had a single mismatch between the miRNA and the mRNA. We validated two of three centered sites with no mismatch, and eight of nine centered sites with one mismatch. The rate of validation seen here (79%) is much higher than previously reported validation rates based on bioinformatics predictions alone (39%) [8], and again supports the robustness and utility of the biotin pull-down approach. These results demonstrate that even without perfect complementarity, centered sites can mediate mRNA repression in mammalian systems.
To ensure that the centered sites were mediating their function through RISC, we repeated the hybrid AGO immune-precipitation/biotin pull-down approach (Figure 2F) to look for enrichment of these centered sites in AGO2-RISC. For both miR-17-5p imperfect cen-tered sites (Figure 6C), and miR-27a imperfect cencen-tered sites (Figure 6D), all targets were found to be signifi-cantly enriched (P≤0.05) in the AGO2 enriched fraction compared to the input mRNA population, demonstrat-ing that interactions between an imperfect centered site and its target mRNA were mediated through RISC.
Finally, to determine whether imperfect centered sites mediate mRNA destabilization or translational inhib-ition, we repeated the luciferase assays described above (Figure 6B), and measured the level of luciferase gene mRNA via qRT-PCR. Changes in the mRNA levels be-tween the control mimic and the test miRNA would in-dicate mRNA destabilization, whereas no changes in the mRNA levels would indicate translational inhibition. Only one out of four sites for miR17-5p (Figure 6E) and
one out of five sites for miR-27a (Figure 6F) showed sig-nificant (P< 0.05) reduction of mRNA levels, indicating that most interactions that result in reduced protein are due to translational inhibition rather than mRNA degrad-ation, although both types of regulation are possible. These experiments together provide substantial experi-mental evidence that imperfect centered sites are common targets of miRNAs, and mediate functional interactions.
The biotin pull-down technique is slightly biased against seed sites
A consideration for interpreting the results derived from this protocol is that the biotin tag on the synthetic miRNA duplexes may prevent their 3′ends from bind-ing to the PAZ domain of Ago [2]. This may allow biotin-labeled miRNAs to interact more easily with tar-get mRNAs and alleviate the requirement for 5′ end binding. The method may therefore be biased towards detecting interactions that are not mediated by the ca-nonical seed.
To explore the potential bias of this method in the af-finity for different types of target sites, we used bio-layer interferometry (BLI) to detect the rates of association and disassociation of RISC with various types of binding sites (Figure 7A). The higher the ratio of association/dis-association is, the stronger the affinity of RISC to a bind-ing site will be. Biotin miR-182-5p RISC was generated by transfecting MDA-MD-231 cells with biotin-labeled miR-182-5p duplexes, whilst native miR-182-5p RISC was generated by inducing expression of miR-182-5p by adding doxycycline to a previously generated and vali-dated inducible cell line [36]. RNA oligos containing seed, centered, and 3′binding sites (Figure 7B) were la-beled with biotin and bound to the streptavidin-coated BLI sensors, blocked in free biotin blocking buffer, and used to probe biotin RISC or native RISC. The 'no oligo' control confirmed the effectiveness of this blocking and confirmed that there was no association between the bio-tin RISC and the BLI sensors after blocking (Figure 7C). The rate constants for association and disassociation were calculated independently for four independent biological
(See figure on previous page.)
A
C
D
E
F
[image:13.595.60.536.88.560.2]B
replicates, and compared between biotin RISC and native RISC (Figure 7D,E).
As expected, the association rates for seed sites are the highest of all sites, and dramatically higher than for 3' sites. Although we find no statistically significant differ-ence between native RISC and biotin RISC for any inter-action, we did observe a trend for native RISC to associate with all binding sites faster than biotin RISC (Figure 7D) and for native RISC to disassociate slower (Figure 7E) than biotin RISC. The only exceptions were imperfect-GU sites, which showed the same dissociation rate for native and biotin RISC, and 3' sites, which were much higher for native risk (approaching statistical sig-nificance, P≈0.06). Thus, all but 3' site-mediated inter-actions are stronger in the absence of the biotin tag. Overall affinities (as measured by the ratio of associ-ation/disassociation) are very similar between biotin and native RISC for all types of sites (Figure 7F), but it is worth noting that the protocol used here could be af-fected by the higher disassociation rates of the seed sites. This is because in the biotin pull-down, unlike CLIP-based methods, the interactions are not fixed in the cell before isolation, so they can disassociate, and we would expect biotin RISC to disassociate more quickly from seed sites than native RISC. Together, this could result in a reduced affinity, transcriptome-wide, for seed sites in our biotin pull-down compared to what would be ex-pected for native RISC-based protocols. We see some evidence for this in the slightly lower proportion of tar-gets that are accounted for only by seed sites in our study compared to other studies - approximately 41% of our biotin pull-down targets can be explained by a seed site, versus 50% for PAR-CLIP data [12] (although we note that this 50% refers to a seed match to any of the top 100 expressed miRNAs). We interpret these results to mean that the biotin pull-down has a slight bias away from seed sites rather than any particular bias towards centered sites. In our data, this probably manifests as a lower percentage of seed sites, but importantly, the affin-ity between native RISC or biotin RISC to centered sites is essentially equivalent and therefore our conclusions regarding the biological relevance of these sites are un-likely to be an artifact of the protocol used, although the prevalence of these interactions may be slightly inflated by the bias away from seed sites.
Discussion
In order to understand the function of a particular miRNA, it is essential to know its targets. All methods for elucidating these have weaknesses, including the bio-tin pull-down approach described previously [17,18] and used here. We chose this protocol because it is not con-founded by secondary effects (unlike microarray-based miRNA modulation studies) and because it is more
sensitive for detecting differences between two closely related miRNAs than other whole-transcriptome ap-proaches such as HITS-CLIP. The inclusion of stringent bead-blocking and washing steps has allowed us to sub-stantially increase the specificity and dynamic range of the assay; the protocol described by Orom et al. [18] achieved a maximum fold-change of 4, while the tran-scripts in our biotin pull-downs were enriched up to eight-fold (Figure S1B in Additional file 2). However, we should anticipate that a proportion of transcripts de-tected as significantly enriched in our biotin pull-down may still not interact with the miRNA of interest. This type of false positive could occur through non-specific interaction with the magnetic streptavidin beads, or by association with endogenous biotin rather than with a biotinylated miRNA. Several lines of evidence suggest that this type of false positive is reasonably uncommon: (i) up to 90% of significantly enriched transcripts contain a predicted binding site (average 82.7%); (ii) of the remaining annotated (HUGO) transcripts without pre-dicted binding sites, almost 40% were shown to contain novel transcriptional events with predicted bindings sites within them; and (iii) the vast majority of miRNA bind-ing sites tested in luciferase assays were validated (Figures 2B and 6B) and were enriched in AGO2 con-taining silencing complexes (Figures 2G,H and 6C,D), although this was a small number of sites.
enriched in our pull-downs than other genes (Table S2 in Additional file 1), and that the overlap seen between our results and those from the miR-17-5p over-expression experiments is similar to that observed between the latter and AGO2 immuno-precipitation datasets [34,37].
Although we did not find any statistically significant differences between native RISC and biotin RISC in their affinities to seed or centered sites, the trend did suggest that biotin-labeled miRNAs were slightly less able to de-tect seed sites than native miRNAs, which could result in a relative increase in the proportion of centered sites in our data. This could explain the drop from 50% seed sites in the PAR-CLIP data [12] to 41% in our study. However, the large variability amongst individual miR-NAs is likely to be a substantial contributing factor - we observed a standard deviation of 10.1% in the proportion of transcripts containing seed sites. Similarly, although imperfect centered sites were significantly enriched in endogenous AGO2 clusters mediated by miR-155 [20], they were almost four times less frequent than seed sites (7.3% versus 27.9%, respectively). This difference is likely to be a combination of the bias of the biotin pull-down approach, unexplored biases in the HITS-CLIP detection (including cluster stringency and bioinformatic inference of sites), and genuine biological differences in the target-ing profiles of different RISC species. Regardless, while any bias towards site types should be considered when interpreting their relative importance, it is clear that im-perfect centered sites account for a substantial fraction of the total interactions between the miRNA and mRNA populations.
We have used the biotin pull-down technique to inves-tigate associations between the number of predicted miRNA-binding sites and a transcript’s enrichment in the pull-down (Figure 4). These associations were stron-ger for site counts in the 3′UTR than in the CDS, con-sistent with previous reports that 3′UTR seed matches are more important for mediating interactions [33-35]. It is striking that the number and density of centered sites, and not just of seed sites, was also significantly associ-ated with enrichment in the pull-down. The hypothesis that centered sites mediate many interactions is also supported by the considerable differences between the target sets of miR-10a and miR-10b (Figure 5A), which share the same seed but have different centered sites, al-though it is possible that some differences are accounted for by 3′complementary sites.
Shin et al. [21] reported that 'perfect 11-mer matches starting at miRNA positions 3, 4 and 5 were each signifi-cantly associated with repression' in over-expression studies, but that 11-mer matches with single mismatches or GU wobbles were not. However, microarray based-assays that rely on changes in the expression levels of target mRNAs will not identify translationally repressed
mRNAs, which have been shown to be the primary dir-ect effdir-ect of miRNAs [38]. Results from our luciferase assays, which detect miRNA effects at both the mRNA and protein levels, suggest that imperfect centered sites arebona fidemiRNA-binding sites that can elicit repres-sion. Given that only a small proportion of the imperfect centered sites result in mRNA destabilization (Figure 6E,F), this would explain why these sites failed to validate in microarray-based studies, but did validate here in luciferase assays (Figure 6B).
Further experimental work on a larger number of sites would be required to elucidate precisely the minimal length and maximum number of mismatches required for centered site-mediated interactions. Regardless, the finding that both perfect and imperfect centered sites can repress gene expression has significant implications for understanding miRNA-controlled genetic networks, as the prevalence of centered sites in the mammalian transcriptome dramatically increases the connectivity and complexity of the networks. It may also explain the evolutionary conservation of regions outside of the seed site [7,21], although we cannot formally exclude the hypothesis that these regions are conserved due to pro-cesses related to miRNA biogenesis. Further experimen-tal work would also be required to compare the efficacy of seed versus centered sites. Although the percentage reduction in luciferase activity shown here (Figure 6B) is comparable with that seen in other studies for seed sites [8], a thorough comparison would require thousands of luciferase assays with accompanying RNAseq and prote-omics data.
examine targets of miRNAs without prior expectation of binding modes.
While we have demonstrated here that centered sites are direct targets of miRNAs that result in molecular re-pression of the target, the larger relationship between targeting and functional repression remains an open question. In biological networks, mRNAs can be insu-lated from the effects of miRNAs by simply expressing more copies of the mRNA [8], so whilst individual tran-scripts are still targeted and repressed, the overall pro-tein levels may not change. How many of the targets identified here are functionally repressed versus molecu-larly repressed is currently unknown, but this is not a weakness of the biotin pull-down (or indeed, a weakness of any other transcriptome-wide method). Instead, this presents us with the interaction data necessary to model properly the outcomes of biological networks in different cell types or tissues with different mRNA expression levels. It will be the combination of these transcriptomic methods with proteomics data that will enable the next leap in understanding.
Conclusions
We used a biotin pull-down method to determine the direct targets of 10 human miRNAs, and found that imperfect centered sites are common mediators of miRNA-mRNA interactions. These sites can repress mRNA activity, typically through translational repres-sion, but further work is needed to establish their func-tional importance relative to seed sites. Our findings may explain the evolutionary conservation of the central region of miRNAs, and they have important implications for studying miRNA-regulated genetic networks, and for interpreting putative disease-causing variants that do not alter protein sequence but that may fall inside miRNA binding sites.
Materials and methods
Biotin pull-downs, microarray hybridizations and sequencing
We optimized the biotin pull-down method of Orom
et al. [18] to improve RNA yield and dynamic range. Briefly, 200 pmoles of synthetic biotin-labeled miRNA duplexes (Table S1 in Additional file 1) were transfected into 4 × 10⁶HEK293T cells using HiPerFect Transfection Reagent (QIAGEN, Melbourne, VIC, Australia). Cells were harvested after 24 hours, and lysed in hypotonic lysis buffer (10 mM KCl, 1.5 mM MgCl2,10 mM Tris-Cl
pH 7.5, 5 mM DTT, 0.5% NP-40, 60U/ML SUPERase•In (Ambion, Austin, TX, USA) and 1X Complete Mini pro-tease inhibitor (Roche, Brisbane, QLD, Australia)). Cell debris was cleared by centrifugation (≥10,000 g at 4°C for 2 minutes). The supernatant was transferred to a clean tube, and NaCl was added to a final concentration
of 1 M. myOne C1 Dynabeads (25 μl; Invitrogen) were pre-blocked with 1 μg/μl bovine serum albumin and 1 μg/μl yeast tRNA (Invitrogen), and incubated with the supernatant for 30 minutes at room temperature. Beads were then washed with hypotonic lysis buffer and 1 M NaCl before RNA extraction using an RNeasy Kit (QIAGEN) according to the manufacturer’s instructions. Pull-downs were conducted in duplicate or triplicate for each miRNA, and 50 ng of the captured mRNAs per sample were amplified and labeled using the Illumina TotalPrep RNA Amplification Kit (Invitrogen) as per the manufacturer’s instructions. Samples were profiled on Illumina Human HT-12 chips along with control RNA from mock-transfected cells to which no miRNA had been introduced. In parallel, RNA extracted from the miR-17-5p pull-down was used in RNAseq library con-struction as previously described [39] and 50 bp tags were generated on the Applied Biosystems SOLiD (Melbourne, VIC, Australia). These were mapped to the human genome (GRCh37) using the default parameters of the X-MATE pipeline [40]; 70,714,217 of the 101,137,997 tags aligned to GRCh37 (70%).
Hybrid AGO immuno-precipitations and biotin pull-downs
We transfected cells with either synthetic biotinylated miRNA duplexes or synthetic single-stranded biotinyl-ated miRNAs and lysed the cells as described above. After clearing the cell lysate, we harvested 10 μl to use as the input RNA sample. We then used a Dynabeads Protein G Immunoprecipitation Kit (Invitrogen) com-bined with a ChIP grade mouse monoclonal antibody to AGO2 (ab57113, Abcam, Cambridge, MA, USA) to perform the AGO enrichments according to the manu-facturers’instructions. Briefly, 50μl of beads per precipi-tation were washed prior to incubation with 10 μg of antibody at room temperature for 10 minutes. Cell lysate was added to the bead-antibody complexes, and incu-bated for 10 minutes at room temperature. The super-natant from this step was saved as the AGO2-depleted fraction, and the beads were kept as the AGO2-enriched fraction. The beads were washed three times in 200μl of wash buffer, prior to elution in 30 μl of elution buffer. We then completed the biotin pull-down protocol on both the enriched fractions and the AGO2-depleted fractions, as described above.
Primary analysis of microarray data
a canonical miRNA clustered close to those from the corresponding isomiR pull-down, as expected given the similarity in their sequences. One miR-10b pull-down sample was excluded because it did not cluster with the other replicates. Microarray probes that detected expres-sion above background (detection P-value <0.01) in all control samples were retained (n = 12,008). The lmFit and eBayes functions in the limma package [44] were used to test for differences in RNA abundance ('differen-tial expression') between the pull-down samples and the controls. The FDR was calculated to account for multiple testing [45]. Probes that met the 5% FDR threshold (for one-sided tests) were considered significantly enriched in the pull-down. The transcripts (EnsEMBL V62) to which they matched exactly were considered putative tar-gets of that miRNA.
Analysis of published data on miRNA-mRNA interactions
These lists of targets were compared to results from published datasets, considering miRNA-target interac-tions that had been demonstrated by luciferase assays (Table S3 in Additional file 1) and by various high-throughput methods. Table S5 in Additional file 1 sum-marizes our analysis of the latter. To test whether the biotin pull-down targets were enriched in the target list from another study, a FET was applied to ask whether the biotin pull-down targets were more likely than non-targets to be in the target list from another study. Unless otherwise stated, reported one-sided P-values are from an upper-tailed test, and an OR >1 indicates that genes/ transcripts/probes that are targets in our biotin pull-down are more enriched amongst the targets identified in the experiment being examined than those that are not targets in the pull-down.
Unless otherwise stated, reported one-sided P-values are from an upper-tailed test, which evaluates the hy-pothesis that the odds ratio, wy==zx, is greater than 1. Am-biguous genes/transcripts (those that were detected both by a probe that was significantly enriched and by a probe that was not) were excluded unless otherwise specified. Kolmogorov-Smirnov tests were conducted to compare the distribution of fold-change (expression in biotin pull-down/control) between canonical transcript targets inferred from published experiments and all other ca-nonical transcripts (the caca-nonical EnsEMBL transcript is the longest produced from a gene).
In silicoprediction of miRNA-binding sites
TargetScanS [1] was run on all EnsEMBL transcripts to find seed matches to the miRNAs of interest. A Perl script was also written to count matches to the centered site (11 bp sequence starting at position 3, 4 or 5 of the miRNA). For centered sites, we allowed GU wobble and
up to one mismatch (MM) in the middle of the site. We divided the centered sites into four classes (WC 0MM, WC 1MM, GU 0MM, GU 1MM) for all analyses except those of the combined target sets of isomiRs and their ca-nonical partners, in which we pooled all classes together.
Statistical analysis of predicted binding sites and enrichment status
A FET was applied to ask whether transcripts containing at least one predicted binding site of a particular type were more likely than those with no site to be unam-biguously classified as targets in the pull-down.
To investigate whether the location of the putative miRNA binding sites affected enrichment status, the fol-lowing logistic regression model was fitted on the com-bined data from all pull-downs:
logit pi;m
¼ln pi;m 1−pi;m
!
¼β0þβ1;1x1;1;m:iþβ2;1x2;1;m:iþ… þβj;kxj;k;m:i
where pi,m is the probability that the probe detecting
transcript i is significantly enriched in the pull-down of
miRNAm; xa,b,m,i is the number of miR-m sites of type
a in region b of transcript i (for example, miR-17-5p
seed sites in the 3′ UTR); βa,b is the coefficient (or
weight) corresponding to that count andβ0is some
con-stant. A value of βa,b significantly greater than zero
would indicate that, as the number of sites of typea in
regionb of a transcript increases, so too does the
prob-ability that the transcript is detected as significantly enriched in the pull-down. All coding transcripts with unambiguous enrichment status were included.
Luciferase assays
Luciferase assays were carried out as previously de-scribed [8]. Briefly, complementary oligonucleotides cor-responding to 54 nucleotides surrounding the miRNA binding site were annealed before being cloned into the
efficiency was assessed byβ-galactosidase activity, using the β-Galactosidase Enzyme Assay System (Promega, Sydney, NSW, Australia), and detected on a PowerWave XS spectrophotometer (BioTek, Winooski, VT, USA).
Quantitative RT-PCR
Primers used to determine whether transcripts were de-graded after miRNA transfection are listed in Table S7 in Additional file 1. Cells were either mock-transfected, or transfected with biotinylated miRNAs as described in the Materials and methods section. RNA was purified from cell pellets using an RNeasy Mini Kit (QIAGEN). RNA integrity was assessed using an Agilent Bioanalyzer 2100, cDNA synthesis was carried out using random hexamer primers and SuperScript III (Invitrogen). qRT-PCR was performed using SYBR green qRT-PCR master-mix (Applied Biosystems) on an Applied Biosystems ViiA™7 Real time PCR system. Expression levels were calculated relative to those in the mock-transfected cells.
Bio-layer interferometry
The generation and validation of the MDA-MB-231 miR-182-5p inducible cell line has been previously de-scribed [36]. miRNA expression was induced by the addition of 1 μg/ml doxycycline. Biotin-labeled miRNA duplexes were transfected into MDA-MB-231 cells using Dharmafect 4 (Thermo Fischer, Melbourne, VIC, Australia) according to the manufacturer’s instructions for this cell line. All cells were incubated in 5% CO2for
48 hours prior to harvesting. RISC affinity purification was performed as previously described [46] with the following modifications: (i) the lysis buffer used was 10 mM Tris pH7.5 (Ambion), 10 mM KCl (Ambion), 1.5 mM MgCl2 (Ambion), 0.5 mM DTT (Invitrogen),
0.5% NP40 (Sigma Aldrich, Sydney, NSW, Australia), and 1X EDTA-free Complete protease inhibitor (Roche); (ii) cell lysates were cleared by centrifugation at 16,000 g for 30 minutes at 4°C. The miR-182-5p capture oligo and all binding site oligo sequences are shown in Table S8 in Additional file 1. Association and disassociation profiles were generated using the Octet Red (Forte Bio, Menlo Park, CA, USA) and streptavidin biosensors (Forte Bio) using the following parameters: lysis buffer for 60 seconds; RNA oligo for 10 minutes; saturated bio-tin (Sigma Aldrich) solution for 10 minutes; lysis buffer for 60 seconds; RISC solution for 10 minutes (associ-ation); lysis buffer for 10 minutes (disassociation). Wells were kept at 30°C, and rotated at 1,000 rpm to ensure a homogenous mix.
Accession numbers
Data used in this manuscript are available from the Gene Expression Omnibus (GEO) under accession numbers GSE29101 (miR-10 family and mock transfection microarray
data), GSE38593 (miR-182 microarray data), GSE40406 (miR-424 and miR-199a microarray data), and GSE55059 (all remaining microarray and sequencing data).
Additional files
Additional file 1: Table S1.Sequences of the biotinylated miRNA duplexes.Table S2.miRNA-target interactions demonstrated by reporter assay [8,17,47-112].Table S3.Results from Fisher’s exact tests for over-representation of genes implicated as targets via miRNA over-expression experiments, PAR-CLIP or luciferase assays amongst the set of genes significantly enriched in the pull-downs (5% FDR).Table S4.Results from Fisher’s exact tests examining enrichment of transcripts with a certain site type amongst transcripts targeted by two related miRNAs.Table S5. Summary of analysis of published studies.Table S6.Primers used for construction of pMIR-REPORT luciferase assay constructs.Table S7. Primers used for qRT-PCR analysis of mRNAs after transient transfection with biotinylated miRNA-duplexes.Table S8.Oligos used for RISC affinity purification and bio-layer interferometry.
Additional file 2: Figure S1.Biotin pull-downs enrich for predicted and previously validated targets of miRNAs.(A)Left: two different miRNA duplexes, hsa-miR-424-3p (blue) and hsa-miR-199b-5p (red), were transfected into HEK293T cells, independently replicated three times. Total RNA samples (dotted lines) and pull-down miRNA enrichments (solid lines) were assayed by microarray, and clustered using the plotSam-pleRelations function of lumi. There is a very close relationship between the total RNA samples, even though they have been transfected with two different miRNAs with very different targets. Right: correlation of HEK293T control RNA transfected with either miR-424-3p or miR-199b-5p miRNAs. This demonstrates that there is very little effect of either duplex in this cell line, and that there is no major disruption of the underlying genetic networks upon transfection at this concentration.(B,C)Volcano plots showing the significance of the difference in expression between the indicated pull-down and the mock-transfected control, for all transcripts expressed in control cells. Targets predicted by TargetScan or validated previously via luciferase assay are indicated by orange and green dots, respectively. (B) A comparison between miR-10a biotin pull-down in this study (left) and by Øromet al.[17] (right).P-values for the enrichment of luciferase validated targets or TargetScan predicted targets are indicated. Red dashed lines indicated the significance threshold and the fold-change threshold used in this study. For the pull-downs performed by Øromet al., no enrichment of known or predicted targets was observed. (C) Volcano plots for all 10 miRNAs/ isomiRs used in this study.
Additional file 3: Figure S2.Distribution of log2 fold-change values for the miRNAs/isomiRs used in this study. Canonical miRNAs are plotted as solid lines. IsomiRs are plotted as dashed lines.
Additional file 4: Figure S3.Targets identified through PAR-CLIP show greater enrichment in the biotin pull-down. Cumulative distribution of log fold-change in the biotin pull-down for transcripts identified as targets via PAR-CLIP [12] or not. Red, canonical transcripts containing at least one CLIP cluster (Table S5 in Additional file 1); black, all other canonical transcripts;p, one-sidedP-value from Kolmogorov-Smirnov
test for a difference in distributions.
Additional file 5: Figure S4.RT-PCR of genes previously confirmed by luciferase assay. The bar plot indicates the expression of the indicated gene in HEK293T cells transfected with miR-17-5p relative to mock-transfected cells. These genes had previously been shown to be targeted by miR-17-5p in luciferase assays. Error bars indicate 95% confidence intervals calculated over three biological replicates. Asterisks indicate significantly reduced expression compared to mock-transfected cells (one-sidedt-test).
Additional file 6: Figure S5.Distribution of binding sites in miRNA transcripts. Frequency histograms showing the distribution of the number of each site type per transcript, for each of the 10 miRNAs used in this study (Table 1).
the biotinylated miRNA in each pull-down. SE, significantly enriched in pull-down (5% FDR).
Additional file 8: Figure S7.Effect of site location on enrichment in the biotin pull-down.(A)The odds ratios from Fisher’s exact tests for an enrichment of transcripts with the indicated site type amongst the putative target set including all transcripts.(B,C)Bar plots show the coefficient estimates from a logistic regression of enrichment status on site density (C) or site count (B). Only canonical transcripts were included. Error bars indicate 95% confidence intervals.
Additional file 9: Figure S8.Hierarchical clustering of microarray data. Clustering was performed using the plotSampleRelations function in the lumipackage. Total vertical distance between samples indicates similarity. Arrays A and B were Illumina HT-12 version 4 arrays, and array C was version 3. The miR-10b pull-down sample that clustered on a different branch to the other miR-10a and miR-10b samples (miR-10b_arrayA_1: red circle) was excluded.
Abbreviations
BLI:bio-layer interferometry; bp: base pair; CDS: coding sequence; ChIP: chromatin immunoprecipitation; CI: confidence interval; CLIP: crosslinking immunoprecipitation; FDR: false discovery rate; FET: Fisher’s exact test; HITS-CLIP: high-throughput sequencing of RNAs isolated by crosslinking immunoprecipitation; miRNA: microRNA; OR: odds ratio; PAR-CLIP: photoactivatable-ribonucleoside-enhanced crosslinking and immunoprecipitation; PCR: polymerase chain reaction; qRT-PCR: quantitative RT-PCR; RISC: RNA-induced silencing complex; UTR: untranslated region.
Competing interests
This work was supported by Australian Research Council (ARC) Discovery Project Grants DP1093164 and DP0988754. NC is supported by an ARC Future Fellowship (FT120100453), and SMG is supported by a National Health and Medical Research Council (NHMRC) Senior Research Fellowship. AV is employed by a commercial company that supplies miRNA research and sequencing products. The funders had no role in study design, data collection and analysis, decision to publish, or preparation of the manuscript.
Authors’contributions
HCM analyzed the data and wrote the manuscript together with NC, who designed and supervised the study and conducted some of the experiments. SMG contributed to study design, supervision, and manuscript preparation. SW conducted the biotin pull-downs and AGO immuno-precipitations. ALS and KK performed the luciferase assays. KN ran the microarrays. EN performed the sequencing, and AV provided materials and assisted in experimental design. All authors read and approved the final manuscript.
Acknowledgements
We are grateful for the helpful discussions with all members of QCMG, and we are particularly thankful to John Pearson, Darrin Taylor, and Scott Wood for HPC infrastructure and support, David Miller and Peter Wilson for sequencing infrastructure and support, as well as technical assistance from the QCMG sequencing and QCMG informatics teams. We also wish to thank Michael Yarski for excellent and timely assistance with the bio-layer interferometry, and the anonymous reviewers whose detailed reviews improved this manuscript.
Author details
1Queensland Centre for Medical Genomics, Institute for Molecular Bioscience,
The University of Queensland, Brisbane, St Lucia QLD 4072, Australia. 2Wellcome Trust Centre for Human Genetics, University of Oxford, Oxford
OX3 7BN, UK.3Life Technologies, 2130 Woodward St, Austin, TX 78744, USA. 4Wolfson Wohl Cancer Research Centre, Institute of Cancer Sciences,
University of Glasgow, Glasgow G61 1BD, UK.5QIMR Berghofer Medical Research Institute, Genomic Biology Laboratory, 300 Herston Road, Herston, QLD 4006, Australia.
Received: 1 August 2013 Accepted: 19 February 2014 Published: 14 March 2014
References
1. Friedman RC, Farh KK-H, Burge CB, Bartel DP:Most mammalian mRNAs are conserved targets of microRNAs.Genome Res2009,19:92–105.
2. Fabian MR, Sonenberg N, Filipowicz W:Regulation of mRNA translation and stability by microRNAs.Annu Rev Biochem2010,79:351–379. 3. Bartel DP:MicroRNAs: target recognition and regulatory functions.
Cell2009,136:215–233.
4. Thomas M, Lieberman J, Lal A:Desperately seeking microRNA targets. Nat Struct Mol Biol2010,17:1169–1174.
5. Lewis BP, Burge CB, Bartel DP:Conserved seed pairing, often flanked by adenosines, indicates that thousands of human genes are microRNA targets.Cell2005,120:15–20.
6. Baek D, Villén J, Shin C, Camargo FD, Gygi SP, Bartel DP:The impact of microRNAs on protein output.Nature2008,455:64–71.
7. Grimson A, Farh KK-H, Johnston WK, Garrett-Engele P, Lim LP, Bartel DP: MicroRNA targeting specificity in mammals: determinants beyond seed pairing.Mol Cell2007,27:91–105.
8. Cloonan N, Brown MK, Steptoe AL, Wani S, Chan WL, Forrest ARR, Kolle G, Gabrielli B, Grimmond SM:The miR-17-5p microRNA is a key regulator of the G1/S phase cell cycle transition.Genome Biol2008,9:R127. 9. Krek A, Grün D, Poy MN, Wolf R, Rosenberg L, Epstein EJ, MacMenamin P,
da Piedade I, Gunsalus KC, Stoffel M, Rajewsky N:Combinatorial microRNA target predictions.Nat Genet2005,37:495–500.
10. Selbach M, Schwanhäusser B, Thierfelder N, Fang Z, Khanin R, Rajewsky N: Widespread changes in protein synthesis induced by microRNAs. Nature2008,455:58–63.
11. Chi SW, Zang JB, Mele A, Darnell RB:Argonaute HITS-CLIP decodes microRNA-mRNA interaction maps.Nature2009,460:479–486. 12. Hafner M, Landthaler M, Burger L, Khorshid M, Hausser J, Berninger P,
Rothballer A, Ascano M, Jungkamp A-C, Munschauer M, Ulrich A, Wardle GS, Dewell S, Zavolan M, Tuschl T:Transcriptome-wide identification of RNA-binding protein and microRNA target sites by PAR-CLIP.Cell2010, 141:129–141.
13. Cloonan N, Wani S, Xu Q, Gu J, Lea K, Heater S, Barbacioru C, Steptoe AL, Martin HC, Nourbakhsh E, Krishnan K, Gardiner B, Wang X, Nones K, Steen JA, Matigian NA, Wood DL, Kassahn KS, Waddell N, Shepherd J, Lee C, Ichikawa J, McKernan K, Bramlett K, Kuersten S, Grimmond SM, Legends SF: MicroRNAs and their isomiRs function cooperatively to target common biological pathways.Genome Biol2011,12:R126.
14. Le MTN, Shyh-Chang N, Khaw SL, Chin L, Teh C, Tay J, O’Day E, Korzh V, Yang H, Lal A, Lieberman J, Lodish HF, Lim B:Conserved regulation of p53 network dosage by microRNA-125b occurs through evolving miRNA-target gene pairs.PLoS Genet2011,7:e1002242.
15. Li S, Zhu J, Fu H, Wan J, Hu Z, Liu S, Li J, Tie Y, Xing R, Zhu J, Sun Z, Zheng X:Hepato-specific microRNA-122 facilitates accumulation of newly synthesized miRNA through regulating PRKRA.Nucleic Acids Res2012, 40:884–891.
16. Christoffersen NR, Shalgi R, Frankel LB, Leucci E, Lees M, Klausen M, Pilpel Y, Nielsen FC, Oren M, Lund AH:p53-independent upregulation of miR-34a during oncogene-induced senescence represses MYC.Cell Death Differ 2010,17:236–245.
17. Ørom UA, Nielsen FC, Lund AH:MicroRNA-10a binds the 5′UTR of ribosomal protein mRNAs and enhances their translation.Mol Cell2008, 30:460–471.
18. Orom UA, Lund AH:Isolation of microRNA targets using biotinylated synthetic microRNAs.Methods2007,43:162–165.
19. Chi SW, Hannon GJ, Darnell RB:An alternative mode of microRNA target recognition.Nat Struct Mol Biol2012,19:321–327.
20. Loeb GB, Khan AA, Canner D, Hiatt JB, Shendure J, Darnell RB, Leslie CS, Rudensky AY:Transcriptome-wide miR-155 binding map reveals widespread noncanonical microRNA targeting.Mol Cell2012,48:760–770. 21. Shin C, Nam J-W, Farh KK-H, Chiang HR, Shkumatava A, Bartel DP:Expanding
the microRNA targeting code: functional sites with centered pairing. Mol Cell2010,38:789–802.
22. Reid JG, Nagaraja AK, Lynn FC, Drabek RB, Muzny DM, Shaw CA, Weiss MK, Naghavi AO, Khan M, Zhu H, Tennakoon J, Gunaratne GH, Corry DB, Miller J, McManus MT, German MS, Gibbs RA, Matzuk MM, Gunaratne PH:Mouse let-7 miRNA populations exhibit RNA editing that is constrained in the 5′-seed/ cleavage/anchor regions and stabilize predicted mmu-let-7a: mRNA duplexes.Genome Res2008,18:1571–1581.