Technology (IJRASET)
©IJRASET: All Rights are Reserved
75
Optimal Multi- Level Thresholding for Color
Image Using Kapur’s Entropy and Bacterial
Foraging Algorithm
R. Arthisree1, S. Abinaya2, R. Ashwini3, V. Sweatha4
1,2,3,4
Student, Department of Electronics and Instrumentation Engineering, St. Joseph’s College of Engineering, Chennai 600119, India.
Abstract—This paper presents, a multi-thresholding approach for a class of 481 x 321 sized standard colour test images using Kapur’s entropy function and Bacterial Foraging Optimization (BFO) optimization algorithm. In this work, maximization of the Kapur’s entropy is chosen as the cost function and the BFO algorithm is allowed to explore the RGB histogram, till the threshold value is attained. The performance of the classical BFO algorithm is also enhanced using Brownian Walk (BW) strategy. The capability of BFO assisted segmentation with Kapur’s function is validated in association with Particle Swarm Optimization (PSO) and classical BFO algorithms using Kapur’s entropy value and search iteration taken by the algorithm. Proposed approach also confirmed using the image quality measures, such as RMSE, PSNR, SSIM, NAE and NCC.
Keywords—Colour image; Kapur’s entropy function; BFO algorithm; PSO algorithm; image quality values.
I. INTRODUCTION
Image segmentation based on multi-level thresholding is widely adopted by the researchers and scientists to extract the image features from a digital image frame. Due to its significance, it is widely considered for traditional image segmentation [1-3], hyper-spectral image processing [4], satellite image processing [5] and biomedical image processing [6-8] applications. In general, image multi-thresholding is carried using manual segmentation procedure or by using the processing unit such as a computer. In this method, with the help of a specified guiding procedure, the digital images are separated in to various layers based on the threshold values.
In the literature, a considerable segmentation procedure is available for the gray scale images and colour (RGB) images [9,10]. For the gray scale image, the threshold level will be of the range [0, L-1], where L=256, but for the RGB image, the threshold value is complex and it can be represented mathematically as [0, L-1]3, which is the combination of Red (R) [0, L-1]; Green (G) [0, L-1] and Blue (B) [0, L-1].
Due to the complex threshold value, segmentation of RGB image is a tedious and time consuming work compared to gray scale images. The complexity in RGB image thresholding can be minimised by employing the heuristic search approaches.
Heuristic algorithm based optimization is widely adopted in various engineering optimization problem because of its robustness, cost effectiveness and ease of implementation [10]. Recently, heuristic algorithm based multi-level thresholding is proposed and implemented for a class of RGB images as discussed below;
Technology (IJRASET)
©IJRASET: All Rights are Reserved
76
Optimization (PSO) algorithm and BFO algorithm existing in the literature.
Image quality measures, such as RMSE, PSNR, SSIM, NAE and NCC are also computed to evaluate the quality of the proposed segmentation process.
II.KAPUR’SFUNCTION
In general, the entropy is a fundamental thermodynamic conception that is connected with the order of irreversible processes in the universe. Physically it can be connected with the amount of chaos in a physical system. In this section, a uncertain probability entropy method generally known as Kapur entropy is considered. It was originally proposed in 1985 to segment the gray scale image using the entropy of the histogram [20].
This method finds the optimal Th which maximizes overall entropy. Let, Th = [th1, th2, ..., thk-1 ] is a vector of the image thresholds. The Kapur’s entropy can be expressed as;
1,2,3
C for k 1 j C j H ) Th ( kapur f max J
(1)
Generally, each entropy is computed independently based on the particular Th value. For multi-level thresholding problem, it can be expressed as;
L 1 thj CK 1
C j Ph ln C 1 k C j Ph C k H , th 1 th
j 1C
C j Ph ln C 1 C j Ph C 2 H th 1 j , C 0 C j Ph ln C 0 C j Ph C 1 H k 2 1 1 (2)
wherePhCj is the probability distribution of the intensity levels and C,... kC 1 1
, C
0
probability occurrence for k levels. Detailed explanation for the Kapur’s function can be found in [1,21,22].
III. HEURISTICALGORITHM This section presents the heuristic algorithms considered in this paper.
A. PSO Algorithm
PSO is a widely adopted heuristic procedure to solve various engineering optimization problems [3].
The PSO algorithm has two basic equations such as velocity update and position update equation and is given below;
) t i S t i G ( 2 R 2 C ) t i S t i P ( 1 R 1 C t i V . t W ) 1 t ( i
V (3)
) 1 t ( i V t i X ) 1 t ( i
X (4)
Technology (IJRASET)
©IJRASET: All Rights are Reserved
77
B. BFO Algorithm
The BFO algorithm is initially proposed by Passino in 2002 based on the mathematical model of the foraging manners in Escherichia coli (E.coli) bacteria [23]. Due to its superiority, it is widely considered to solve a variety of engineering optimization problem [24,25]. In this work, the BFO algorithm discussed in [25] is adopted.
The initial BFO parameters are assigned as follows:
N =20 ;Nc=
2
N
; Ns = Nre
3
N
; Ned
4
N
; Nr =
2
N
; Ped =
r ed N N N
; dattract= Wattract =
N s N
; and hrepell= Wrepell = N
c N
(5)
Where, N- number of E.Coli bacteria, Nc-number of chemotactic steps, Ns-Swim length during the search, Ned-number of elimination - dispersal events,Nr-number of bacterial reproduction, Ped- probability of the bacterial elimination, dattract= Wattract -width and depth of attraction, hrepell= Wrepell- height and width of repellent signal.
C. BWBFO Algorithm
It is a recent version of BFO algorithm, in which the chemo-taxis operation is mutated with the Brownian walk strategy [2, 26]. The major advantage of this procedure is that, it offers better convergence compared with the traditional BFO algorithm.
Let us consider the search operation of ith bacterium at jth chemotactic, kth reproductive and lth elimination-dispersal can be represented as; ) i ( ) i ( t ) i ( ) i ( C ) l , k , j ( i ) l , k , 1 j ( i
(6)
where C(i) is the step size in the random direction and Δ(i) is a random vector of size [-1,1]. In this work, eqn. (6) is modified as follows:
) s ( B ) i ( ) i ( t ) i ( ) l , k , j ( i ) l , k , 1 j (
i
(7)
) s ( B ) i ( ) i ( t ) i ( ) l , k , j ( i ) l , k , 1 j (
i
(7) where the symbol represents the entry wise multiplication and B(s) is the BW strategy [2,26].
IV. IMPLEMENTATION
Multi-level thresholding problem is used to find optimal thresholds within the RGB histogram range [0, L−1]3 that maximize an
objective function Jmax. Kapur’s entropy function is employed in this paper to find the R, G, B thresholds based on the assigned Th
value using a chosen heuristic algorithm.
In this work, in order to obtain a reasonable assessment, all the heuristic algorithms are allocated with similar algorithm parameters, such as number of agents (N=20), maximum number of iteration (2000), search dimension (D=Th) and stopping criteria (Jmax). The quality of the segmentation outcome is assessed using the following image quality measures [27,28];
2k , j y k , j x N 1 k M 1 j MN 1 y) (x, MSE
(8)Technology (IJRASET)
©IJRASET: All Rights are Reserved
78
2 G y x 1 G 2 y 2 x ) 2 G xy 2 )( 1 G y x 2 ( y) (x, SSIM 2 2 (10) k , j x N 1 k M 1 j k , j y k , j x N 1 k M 1 j y) (x,
NAE
(11) k , j 2 x N 1 k M 1 j k , j y . k , j x N 1 k M 1 j y) (x,
NCC
(12)
where x- is the original image and y-thresholded image.
V.RESULTSANDDISCUSSIONS
[image:5.612.182.423.81.212.2]This section presents the simulation results obtained with the proposed multi-thresholding process. The simulation work is implemented using Matlab 2010a software. The benchmark RGB images are obtained from the Berkeley image segmentation dada set [29].
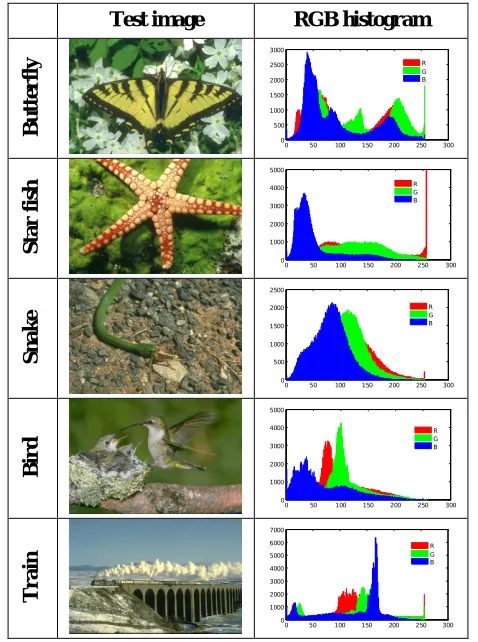
Table I presents the considered 421 x 381 sized RGB dataset and its RGB histogram value. From this, it can be noted that the RGB image is the combination of the Red, Green and Blue colored pixels.
TABLE I. RGB TEST IMAGES AND CORRESPONDING HISTOGRAM VALUES
Test image RGB histogram
Bu
tte
r
fl
y
0 50 100 150 200 250 300 0 500 1000 1500 2000 2500 3000 R G B S tar f is h
0 50 100 150 200 250 300 0 1000 2000 3000 4000 5000 R G B S n ak e
0 50 100 150 200 250 300 0 500 1000 1500 2000 2500 R G B Bi r d
0 50 100 150 200 250 300 0 1000 2000 3000 4000 5000 R G B Tr ai n
[image:5.612.187.426.331.652.2]Technology (IJRASET)
©IJRASET: All Rights are Reserved
79
0 50 100 150 200 250 300
0 250 500 750 1000
Thresholds
P
ix
e
l l
e
v
e
[image:6.612.203.407.84.331.2]ls
Fig. 1 Brownian walk based search
0 500 1000 1500
13 13.05 13.1 13.15 13.2
No. of iteration
K
a
p
u
r'
s
f
u
n
c
ti
o
n
PSO BFO BWBFO
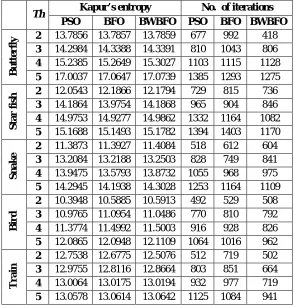
[image:6.612.159.454.385.693.2]Fig. 2 Convergence of optimization search for Th=2 Table II. Comparison of proposed and existing algorithms
Th Kapur’s entropy No. of iterations
PSO BFO BWBFO PSO BFO BWBFO
Bu
tte
r
fl
y 2 13.7856 13.7857 13.7859 677 992 418
3 14.2984 14.3388 14.3391 810 1043 806 4 15.2385 15.2649 15.3027 1103 1115 1128 5 17.0037 17.0647 17.0739 1385 1293 1275
S
tar
f
is
h 2 12.0543 12.1866 12.1794 729 815 736
3 14.1864 13.9754 14.1868 965 904 846 4 14.9753 14.9277 14.9862 1332 1164 1082 5 15.1688 15.1493 15.1782 1394 1403 1170
S
n
ak
e 2 3 11.3873 11.3927 13.2084 13.2188 11.4084 13.2503 518 828 612 749 604 841
4 13.9475 13.5793 13.8732 1055 968 975 5 14.2945 14.1938 14.3028 1253 1164 1109
Bi
r
d
2 10.3948 10.5885 10.5913 492 529 508 3 10.9765 11.0954 11.0486 770 810 792 4 11.3774 11.4992 11.5003 916 928 826 5 12.0865 12.0948 12.1109 1064 1016 962
Tr
ai
n
Technology (IJRASET)
©IJRASET: All Rights are Reserved
80
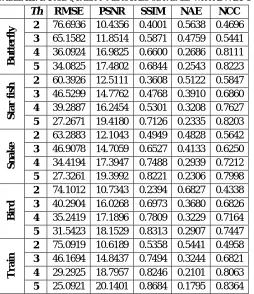
TABLE III.IMAGE QUALITY MEASURES OBTAINED WITH BWBFO
Th RMSE PSNR SSIM NAE NCC
Bu
tte
r
fl
y 2 76.6936 10.4356 0.4001 0.5638 0.4696
3 65.1582 11.8514 0.5871 0.4759 0.5441 4 36.0924 16.9825 0.6600 0.2686 0.8111 5 34.0825 17.4802 0.6844 0.2543 0.8223
S
tar
f
is
h 2 60.3926 12.5111 0.3608 0.5122 0.5847
3 46.5299 14.7762 0.4768 0.3910 0.6860 4 39.2887 16.2454 0.5301 0.3208 0.7627 5 27.2671 19.4180 0.7126 0.2335 0.8203
S
n
ak
e 2 3 63.2883 12.1043 0.4949 0.4828 0.5642 46.9078 14.7059 0.6527 0.4133 0.6250
4 34.4194 17.3947 0.7488 0.2939 0.7212 5 27.3261 19.3992 0.8221 0.2306 0.7998
Bi
r
d
2 74.1012 10.7343 0.2394 0.6827 0.4338 3 40.2904 16.0268 0.6973 0.3680 0.6826 4 35.2419 17.1896 0.7809 0.3229 0.7164 5 31.5423 18.1529 0.8313 0.2907 0.7447
Tr
ai
n
2 75.0919 10.6189 0.5358 0.5441 0.4958 3 46.1694 14.8437 0.7494 0.3244 0.6821 4 29.2925 18.7957 0.8246 0.2101 0.8063 5 25.0921 20.1401 0.8684 0.1795 0.8364
[image:7.612.182.436.85.379.2]Initially the proposed multi-thresholding procedure is implemented on the Butterfly image with PSO, BFO and BWBFO algorithm for Th = 2. Fig. 1 shows the search pattern offered in the BWBFO algorithm. From this, it can be noted that, BW strategy helps the BFO to efficiently explore the entire search space D.
Fig. 2 sows the convergence of the heuristic search for the Butterfly image when Th =2. From this, it can be observed that, BWBFO offers better convergence compared with PSO and BFO algorithms.
The segmentation process is repeated 10 times for each image and for each threshold value and the mean value is presented in Table II and Table III.
The PSO algorithm based search steadily explores the entire the search space in order to find the optimal threshold from [0, L-1]2 thresholds. In BFO based search, finds the value very slowly due to its slow tumbling and swimming operation. In BWBFO algorithm, the tumble-swim operation is enhanced using the BW strategy, which helps to achieve faster convergence.
From Table II, it is confirmed that, for most of the cases, the Kapur’s entropy and number of iterations offered by BWBFO is better compared with the PSO and BFO algorithms.
Table III presents the mean values of Root Mean Square Error (RMSE), Pixel Signal Noise Ratio (PSNR), Structural Similarity Index (SSIM), Normalized Absolute Error (NAE) and Normalized Cross Correlation (NCC) obtained with BWBFO and Kapur’s function for Th = {2,3,4,5}.
From Table IV, it can be noted that, when the required threshold Th = 2, the proposed approach segments the image in to region of interest and back ground. When the Th value increases, based on the assigned Th, the algorithm groups the RGB pixels in order to enhance the required image portion.
Table V presents the SSIM map obtained for the original image (x) and the thresholded image (y) for Th = {2,3,4,5}. SSIM map is used to find the percentage of fit between x and y graphically. This table offers the SSIM map for the Butterfly, Star fish, Snake, Bird and Train for Th = {2,3,4,5}.
From this table, it is evident that, when the threshold value increases, the percentage fit in SSIM map also increases.
Technology (IJRASET)
©IJRASET: All Rights are Reserved
81
problems.
TABLE IV.SEGMENTED RGB IMAGES FOR Th ={2,3,4,5}
Th =2 Th =3 Th =4 Th =5
But
te
rfl
y
S
ta
r
fi
sh
S
na
ke
Bi
rd
T
ra
in
TABLE V.SSIM MAP BETWEEN SEGMENTED AND ORIGINAL IMAGE FORTh ={2,3,4,5}
Th Butterfly Star fish Snake Bird Train
2
3
4
Technology (IJRASET)
©IJRASET: All Rights are Reserved
82
VI. CONCLUSIONS
In this paper, RGB image multi-level thresholding problem is addressed using the Brownian walk based BFO algorithm and Kapur’s function. In this work, the threshold values are chosen as Th={2,3,4,5} and it is implemented for 421 x 381 sized standard RGB benchmark images. In order to verify the effectiveness, proposed method is validated with PSO and BFO algorithm. Initially the Kapur’s function and number of iteration is considered to assess the performance of PSO, BFO and BWBFO. Later the image quality measures, such as RMSE, PSNR, SSIM, NAE, NSS and SSIM map are considered. The simulation result confirms that, BWBFO based segmentation helps to achieve better result compared with the PSO and BFO.
REFERENCES
[1] B. Akay, “A study on particle swarm optimization and artificial bee colony algorithms for multilevel thresholding,” Applied Soft Computing Journal, vol. 13, no. 6, pp. 3066–3091, 2013.
[2] N.S.M. Raja, V. Rajinikanth and K. Latha, “Otsu Based Optimal Multilevel Image Thresholding Using Firefly Algorithm,” Modelling and Simulation in Engineering, vol. 2014, Article ID 794574, 17 pages, 2014.
[3] V. Rajinikanth, N.S.M. Raja, and K. Latha, “Optimal multilevel image thresholding: an analysis with PSO and BFO algorithms. Aust. J. Basic Appl. Sci., vol. 8, pp. 443-454, 2014.
[4] P. Ghamisi, M.S. Couceiro, and J.A Benediktsson, “Classification of hyperspectral images with binary fractional order Darwinian PSO and random forests,” SPIE Remote Sensing, 88920S-88920S-8, 2013.
[5] A.K. Bhandari, A.Kumar, and G.K Singh, “Modified artificial bee colony based computationally efficient multilevel thresholding for satellite image segmentation using Kapur’s, Otsu and Tsallis functions,” Expert Systems with Applications, vol. 42, pp.1573–1601, 2015.
[6] Palani T. Krishnan, Parvathavarthini Balasubramanian, and Chitra Krishnan, “Segmentation of Brain Regions by Integrating Meta Heuristic Multilevel Threshold with Markov Random Field,” Current Medical Imaging Reviews, vol.12, no.1, pp. 4-12, 2016.
[7] K. Kamalanand, and S. Ramakrishnan, “Effect of gadolinium concentration on segmentation of vasculature in cardiopulmonary magnetic resonance angiograms,” Journal of Medical Imaging and Health Informatics, vol.5, pp. 147-151, 2015.
[8] K. Manickavasagam, S. Sutha, and K. Kamalanand, “Development of Systems for Classification of Different Plasmodium Species in Thin Blood Smear Microscopic Images, Journal of Advanced Microscopy Research, vol. 9, pp.86-92, 2014.
[9] M. Sezgin, and B.Sankar, “Survey over image thresholding techniques and quantitative performance evaluation,” Journal of Electronic Imaging, vol. 13, pp.146 – 165, 2004.
[10] M. Tuba, “Multilevel image thresholding by nature-inspired algorithms: A short review,” Computer Science Journal of Moldova, vol. 22, pp.318-38, 2014.
[11] S. Sarkar and S. Das, “Multilevel image thresholding based on 2D histogram and maximum Tsallis entropy—a differential evolution approach,” IEEE Transactions on Image Processing, vol. 22, no. 12, pp. 4788–4797, 2013.
[12] Q. Su and Z.Hu, “Color image quantization algorithm based on self-adaptive differential evolution,” Computational Intelligence and Neuroscience, vol. 2013, Article ID 231916, 8 pages, 2013.
[13] V. Rajinikanth, and M.S. Couceiro, “RGB Histogram Based Color Image Segmentation Using Firefly Algorithm,” Procedia Computer Science, vol.46, pp.1449–1457, 2015.
[14] V. Rajinikanth, and M.S. Couceiro, “Multilevel Segmentation of Color Image using Lévy driven BFO Algorithm,” Proceedings of the 2014 International Conference on Interdisciplinary Advances in Applied Computing, ICONIAAC '14, Article No. 19, 2014.
[15] V. Rajinikanth, N.S.M. Raja, and S.C. Satapathy, “Robust Color Image Multi-thresholding Using Between-Class Variance and Cuckoo Search Algorithm,” in Information Systems Design and Intelligent Applications, Advances in Intelligent Systems and Computing, vol.433, pp. 379-386, 2016.
[16] B. Joyce Preethi, and V. Rajinikanth, “Improving Segmentation Accuracy in Biopsy Cancer Cell Images using Otsu and Firefly Algorithm,” International Journal of Applied Engineering Research, vol.9, no.24, pp. 8502-8506, 2014.
[17] N.S.M. Raja, S.A. Sukanya, and Y. Nikita, “Improved PSO Based Multi-level Thresholding for Cancer Infected Breast Thermal Images Using Otsu,” Procedia Computer Science, vol. 48, pp.524-529, 2015.
[18] N. Siva Balan, A. Sadeesh Kumar, N.S.M. Raja, and V. Rajinikanth, “Optimal Multilevel Image Thresholding to Improve the Visibility of Plasmodium sp. in Blood Smear Images,” in Proceedings of the International Conference on Soft Computing Systems, Advances in Intelligent Systems and Computing, vol. 397, pp. 563-571, 2016.
[19] N.S.M. Raja and V. Rajinikanth, “Brownian distribution guided bacterial foraging algorithm for controller design problem,” in ICT and Critical Infrastructure: Proceedings of the 48th Annual Convention of Computer Society of India- Vol I, vol.248 of Advances in Intelligent Systems and Computing, pp. 141–148, 2014.
[20] J. N. Kapur, P. K. Sahoo, and A. K. C. Wong, “A new method for gray-level picture thresholding using the entropy of the histogram,” Computer Vision, Graphics, and Image Processing, vol. 29, no. 3, pp. 273–285, 1985.
[21] P. D. Sathya and R. Kayalvizhi, “Comparison of intelligent techniques for multilevel thresholding problem,” International Journal of Signal and Imaging Systems Engineering, vol. 5, no. 1,pp. 43–57, 2012.
Technology (IJRASET)
©IJRASET: All Rights are Reserved
83
[23] K.M. Passino, “Biomimicry of bacterial foraging for distributed optimization and control,” IEEE Control Systems Magazine, vol.22, pp. 52–67, 2002.
[24] V. Rajinikanth and K. Latha, “I-PD Controller Tuning for Unstable System Using Bacterial Foraging Algorithm: A Study Based on Various Error Criterion,” Applied Computational Intelligence and Soft Computing, vol. 2012, Article ID 329389, 10 pages, 2012.
[25] V. Rajinikanth and K. Latha, “Controller Parameter Optimization for Nonlinear Systems Using Enhanced Bacteria Foraging Algorithm,” Applied Computational Intelligence and Soft Computing, vol. 2012, Article ID 214264, 12 pages, 2012.
[26] N. Sri Madhava Raja, K. Suresh Manic, and V. Rajinikanth, “Firefly algorithm with various randomization parameters: an analysis,” in Proceedings of the 4th International Conference on Swarm, Evolutionary, and Memetic Computing (SEMCCO ’13), B. K. Panigrahi, P. N. Suganthan, S. Das, and S. S. Dash, Eds., Lecture Notes in Computer Science, vol. 8297, pp. 110–121, 2013.
[27] Z. Wang, A.C. Bovik, H.R. Sheikh and E.P. Simoncelli, “Image Quality Assessment: From Error VisibilitytoStructural Similarity,” IEEE Transactions on Image Processing, vol. 13, no. 4, pp. 600 – 612, 2004.
[28] S. Grgic, M. Grgic and M. Mrak, “Reliability of objective picture quality measures,” Journal of Electrical Engineering, vol. 55, no. 1-2, pp. 3–10, 2004.