s y n t h e si s
D avi e s, WJ, B r u c e , N S a n d M u r p hy, JE
h t t p :// dx. d oi.o r g / 1 0 . 3 8 1 3 /AAA. 9 1 8 7 0 8
T i t l e S o u n d s c a p e r e p r o d u c tio n a n d sy n t h e si s
A u t h o r s D avi e s , WJ, B r u c e , N S a n d M u r p hy, JE
Typ e Ar ticl e
U RL T hi s v e r si o n is a v ail a bl e a t :
h t t p :// u sir. s alfo r d . a c . u k /i d/ e p ri n t/ 3 0 8 7 7 /
P u b l i s h e d D a t e 2 0 1 4
U S IR is a d i gi t al c oll e c ti o n of t h e r e s e a r c h o u t p u t of t h e U n iv e r si ty of S alfo r d . W h e r e c o p y ri g h t p e r m i t s , f ull t e x t m a t e r i al h el d i n t h e r e p o si t o r y is m a d e f r e ely a v ail a bl e o nli n e a n d c a n b e r e a d , d o w nl o a d e d a n d c o pi e d fo r n o
n-c o m m e r n-ci al p r iv a t e s t u d y o r r e s e a r n-c h p u r p o s e s . Pl e a s e n-c h e n-c k t h e m a n u s n-c ri p t fo r a n y f u r t h e r c o p y ri g h t r e s t r i c ti o n s .
1
William J. Davies
Neil S. Bruce
Jesse E. Murphy
Acoustics Research Centre, University of Salford, Salford M5 4WT
Abstract
The aims of this work were to investigate (i) whether soundscape perceptual dimensions are
correctly reproduced by ambisonic loudspeaker playback, (ii) whether soundscape
dimensional analysis is robust to changes of location and from the field to laboratory
playback, and (iii) whether a simple soundscape synthesis can be used to interactively design
a soundscape. The first two aims were addressed by an experiment which attempted to repeat
the dimensional analysis made by Kang (Kang, J. (2007), Urban Sound Environment.
London: Taylor and Francis). Kang used semantic differential scales to conduct an in-situ
survey of two urban soundscapes in Sheffield, UK. He used factor analysis to derive four
perceptual dimensions from the responses. The present work repeated this approach, but the
fifteen participants were judging ambisonic recordings of four soundscapes in Manchester,
UK. The present work found very similar dimensions to Kang but with more variance
explained: relaxation/calmness (41%), dynamics/vibrancy (10%), communication (7%) and
spatiality (7%). The dimensions from the two studies load onto the semantic scales in a
2
similar results to field experiments, though with more variance explained. They also show
that dimensional analysis of soundscape response is robust enough to produce similar results
for different locations in different cities.
To investigate the third aim, the ambisonic reproduction was extended to a system which
allowed independent interactive control of sixteen foreground sounds set in an ambisonic
background soundscape. Eight participants were able to use this system to successfully
design a soundscape that expressed their intentions. It was found that the designed
soundscapes seemed to be based more on participant expectation of typical urban
soundscapes than on their preference for individual sounds. These results suggest that a more
sophisticated soundscape synthesiser might be suitable for real design problems.
1. Introduction
Several important aspects of soundscape perception and cognition have been described in
the literature. The major elements discovered to date are: soundscape dimensions [1-4];
sound and soundscape categories [5, 6]; soundscape components [7], semantic meaning of
soundscapes [8] and soundscape expectation [9]. Most of these results have been produced
from fieldwork: the researcher asks the listener(s) some questions while they are in a real
soundscape, or immediately afterwards. A few studies (for example [4]) have used laboratory
reproduction: recordings are made of a soundscape and later reproduced to listeners. The
merits of fieldwork and laboratory tests contrast: fieldwork seems to offer realism, in that
listeners are exposed to a real soundscape in a real environment and all the sensory stimuli
are thus authentic. Laboratory tests offer control, not least in that each listener can be exposed
to exactly the same sound stimulus. Scientific research usually prefers closely controlled
experimental conditions, so the preponderance of fieldwork studies in the literature suggests
3
laboratory. This question was directly addressed by Guastavino et al. [10] who showed that a
first-order ambisonic loudspeaker system successfully reproduced soundscapes, in the sense
that semantic aspects of user experience were similar in the original soundscape and its
reproduction. Guastavino et al. introduced the term ecological validity to soundscape research
and used it as a way of exploring how well soundscape reproduction works. They explained
that an ecologically valid laboratory experiment is one in which participants respond in the
same way as they would under ecological conditions. Guastavino et al. measured the
similarity of participants’ linguistic responses between field and laboratory reproduction and
used this as a measure of ecological validity. This revealed that the ecological validity of
different soundscape reproductions was found to vary somewhat with the type and content of
the soundscape. Despite this result, reproduction has not been widely used in soundscape
research since, and most work continues to rely on field experiments. This might be because
ecological validity of soundscape reproduction would depend on the successful reproduction
of all the aspects of soundscape perception and cognition of interest to a researcher, and not
just those studied by Guastavino et al. Guastavino et al. focussed on the reproduction of
semantic and cognitive aspects of soundscapes, including semantic categories and realism.
The first aim of the work reported in this paper is to test the reproduction of a different
feature of soundscape perception, namely whether the perceptual dimensions of soundscapes
are correctly reproduced in laboratory listening tests.
Decomposing soundscape perception into its constituent dimensions is an attractive
analysis technique because it holds the possibility that soundscapes could be classified by
their position in the dimensional space, that changes in the soundscape could be measured by
changes in this position, and that the psychological dimensions might even be related to
physical metrics and thus predicted by them [1]. Dimensional analysis of outdoor
4
eighteen semantic differential scales with 223 subjects in two urban squares. He extracted
four principal factors. All the factors have significant relationships with many of the eighteen
scales, so attempting to summarise the factors in one word leads to some generalisation.
Nevertheless, Kang’s perceptual factors can be described as: relaxation, communication,
spatiality and dynamics. Three other soundscape dimensional results exist in the literature [1,
3, 4]. These research groups found similar but not identical dimensions to Kang (their results
are discussed in more detail later in this paper). This raises the question of how robust a
dimensional model of soundscape perception is. Are the dimensions specific to a location, or
a country, or do they depend on the scales used in the data collection? Does it matter if the
soundscapes were experienced in situ (Kang) or if they were reproduced by an audio system
in a laboratory (Cain et al.)?
If soundscapes can be successfully reproduced by a spatial audio system, then this
may open up possibilities of mixing a soundscape and even simulating a soundscape. These
techniques might be useful both for researching soundscape preference and ultimately for
soundscape design. There is considerable interest in using soundscape concepts to actively
design the acoustic environment of a location. Brown and Muhar [11] suggested a way of
deriving acoustic criteria and using them for soundscape design. Zhang and Kang [12] used
an analysis of the important aspects of existing soundscapes to make suggestions for how
soundscapes could be deliberately designed. Davies et al. [13] described a simple tool for
evaluating existing soundscapes and suggested how it could be used to support design
decisions to intervene in or change a soundscape. Compared to visual design, however, there
is a striking lack of creative tools for soundscape designers. There is no equivalent of the
architect’s sketch pad for soundscape design. A valid soundscape synthesis where the user
can interact with and change the soundscape might offer a way towards a useful creative
5
This paper reports the results of two experiments. The first experiment directly
addresses the questions of whether a spatial audio system can correctly reproduce soundscape
dimensions and how reproducible those dimensions are between locations, listeners and
experimenters. The second experiment employs a method for synthesising a soundscape and
examines whether it can be used to interactively design a soundscape.
2. Experiment 1: Soundscape reproduction
2.1Method
The first experiment sought to reproduce the soundscape dimensions found by Kang in the
field, but in a different city, some years later, using a spatial audio system rather than in-situ
exposure. Recordings were made of the soundscape in four urban locations in Manchester
city centre (in the UK). A soundfield microphone was used to make first-order ambisonic
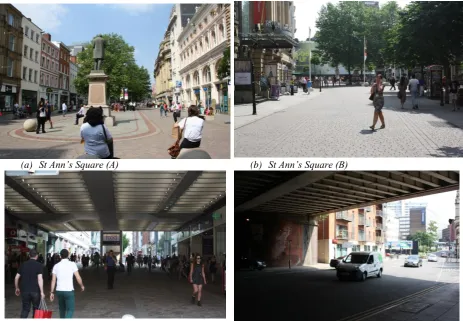
recordings. Two of the locations were at opposite ends of St Ann’s Square, a pedestrianised
shopping area bounded on one side by a cobbled road. The first recording (A) was near the
cobbled road, and the second (B) was near a busking musician. (St Ann’s Square was much
studied by the Positive Soundscape Project [7].) The third location was a pedestrianised
underpass, and the fourth was on a busy road with a railway bridge going over it. Figure 1
shows snapshots of the four locations. The recordings were reproduced using an
eight-loudspeaker three-dimensional first-order ambisonic system in a semi-anechoic chamber at
Salford University. Sound levels at the listener’s position were the same as at the point of
recording (LAeq). One 30-second recording was used for each of the four locations. Fifteen
participants, all students or lecturers in acoustics, completed the experiment. The participants
were allowed to replay each recording as many times as they wished. No visual stimulus was
6
Kang used 11-point two-sided semantic differential scales to collect responses to the
soundscapes in his field study. We followed this method with the nineteen response scales
shown in Table 1. Some alterations were made to Kang’s scales to better fit this experiment.
A scale of calming-agitating was added because results from the Positive Soundscape Project
had shown that calmness plays a significant role in soundscape evaluation [4]. Kang’s finding
that communication was a significant factor resulted in the addition of the communal-private
scale. Kang’s scale of echoed-deadly was deemed confusing, and altered to
reverberant-anechoic. Far-close was also changed to far-near as the word near does not possess the dual
meaning that close does. Lastly, the scale of directional-everywhere was replaced with
directional-universal.
2.2Results and Discussion
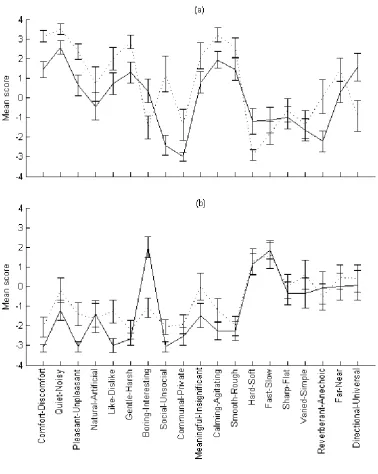
The completed experiment resulted in nineteen scale values for each of four
soundscapes, for each of fifteen participants. Figure 2 shows the scale values averaged across
participant for each soundscape. As expected, the soundscapes produce different ratings on
most scales. For example, it is not surprising to find that St Ann’s Square (B) is more
comfortable than the busy road. More interestingly, there seem to be two pairs of
soundscapes: The pedestrian underpass and St Ann’s Square (B) in Fig. 2 (b) have similar
values on several scales and are more liked than the busy road and St Ann’s Square (A) in
Fig. 2 (a). This might be explained by the presence of foreground traffic sounds in the latter
two soundscapes. It is worth noting that caution must be exercised in using the mean values
of scale responses to evaluate a soundscape. In a study of urban soundscapes, Raimbault [14]
found that some semantic scales produced responses which were not normally distributed, as
participants sometimes formed two different groups with their responses. No evidence was
7
important for the purposes of comparison with Kang’s earlier experiment that the same
method is followed here.
The software package SPSS was used to conduct a principal component analysis
(PCA) on this data. The analysis was first partitioned into the four soundscapes, and then
combined for an overall view. For the partitioned PCA, similar results were found for each
soundscape. For each location, four components explain 71 to 74% of the variance in the
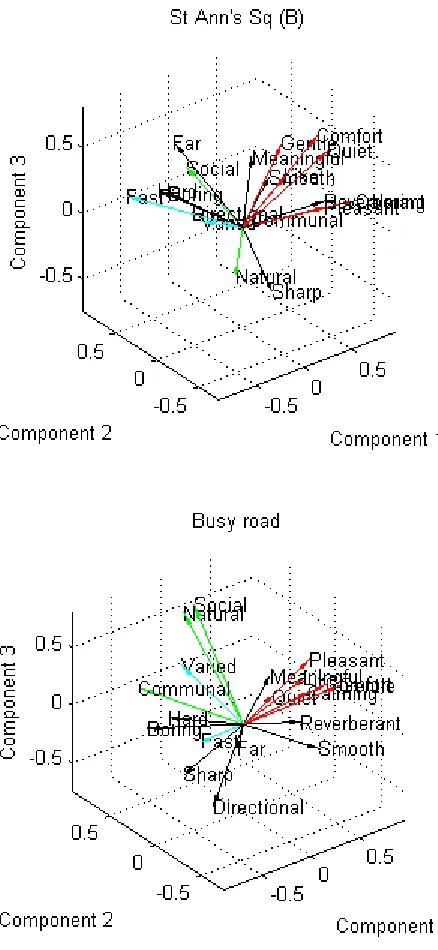
scale values. Figure 3 illustrates the relationship between the input semantic scales and the
first three output components for each of the four soundscapes. For all the locations apart
from St Ann’s Square (A), the first component loads highly onto the scales Comfort, Quiet,
Pleasant, Like, Gentle and Calming. Component one thus seems to be a consensus judgement
on pleasantness. Component 2 seems to be assessing the dynamics of the soundscapes,
because for the same three locations it is associated with the scales Fast and Varied.
Component three seems to be assessing the meaning of the soundscape because it is
associated with the scales Social, Communal and Natural.
The broad similarities between the component spaces in Fig. 3 suggest that the
soundscapes are being judged by the participants with the same perceptual framework. The
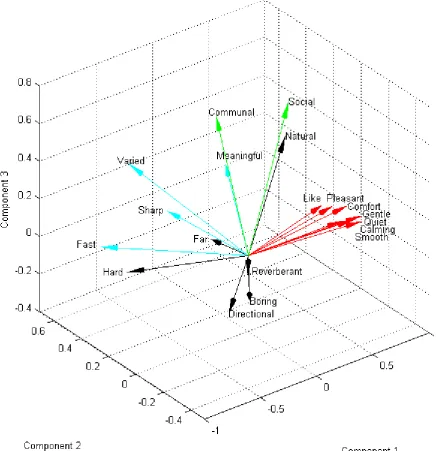
whole set of data was therefore combined for one overall PCA across the four soundscapes.
This resulted in four dimensions that explain 65% of the variance in the scale values. The
dimensions load onto the scales with the factors shown in Table 2 and Figure 4 shows the
scales plotted as vectors in the first three dimensions. Combining the soundscapes tends to
produce a clearer picture of the dimensions in Fig. 4. The first dimension is strongly
associated with Like, Pleasant, Comfort, Gentle, Quiet, Calming and Smooth. It could
tentatively be called Relaxation/Calmness. The second dimension is associated with Varied,
Meaningful, Fast and Sharp. It could be called Dynamics/Vibrancy. The third dimension is
8
final dimension is associated with Directional and Far, so it could be named Spatiality. These
loadings are not identical to those found by Kang [2] but they are similar. Kang found
dimensions of relaxation (26% of variance explained), communication (12%), spatiality (8%)
and dynamics (7%). The main difference between our results and Kang’s is the increased
variance explained by the first factor. The most likely explanation for this is that the
controlled laboratory conditions, especially the exposure of participants to identical stimuli,
have reduced the influence of extraneous factors. In our experiments, the four soundscapes
produced similar but not identical dimensions when analysed individually. This effect is
perhaps due to a different mix of sound sources in each soundscape and this probably
accounts for some of the small remaining differences between our results and Kang’s.
The dimensions found in three other studies in the literature are not much more different.
In a large project, Axelsson et al. used 116 semantic scales to characterise the response of 100
listeners to fifty soundscapes [1]. They produced a three-dimensional space with factors
pleasantness (50%), eventfulness (18%) and familiarity (6%). Guillén and López Barrio [3]
reported three dimensions, named emotional evaluation and strength (42%), activity (14%),
and clarity (10%). Finally, Cain et al. found two principal dimensions: calmness (60%) and
vibrancy (20%); with visual stimulus having little effect on the dimensions in this binaural
reproduction [4]. The first dimension in all the studies seems to be very similar:
calmness/pleasantness. All the studies except Kang’s have the same second dimension:
activity/eventfulness. (Kang also has this dimension, but places ‘dynamics’ as dimension 4.)
The effect of the ambisonic reproduction in this experiment can be compared to
results reported by Guastavino et al. [10]. They exposed participants to soundscapes in situ
and via an ambisonic reproduction. A linguistic analysis of the subsequent interviews found
9
soundscape. The present results add to the confidence we can have in ambisonic reproduction
by showing that the reproduction also seems to be faithful for the perceptual dimensions.
It is interesting that some of the dimensional studies discussed above included visual
stimulus (e.g. Kang) and some did not (e.g. Cain et al.). The broad agreement of the findings
between the various studies suggests that visual stimulus is not very important in determining
the auditory dimensions, as suggested by Cain et al. However, there is also evidence in the
literature that seems to contradict this. For example, Viollon et al. [15] found that visual
scenes influenced judgements of soundscape pleasantness and relaxation. One possible way
of resolving this disagreement might be to consider the role of attention. It has been
previously reported that the attention mechanism has a significant role to play in soundscape
perception [16]. Top-down attention can be focused on different sensory attributes at a range
of different scales: on the overall impression of a place (sights, sounds, smells), on the
soundscape, or on a particular sound or sound source. In one kind of study, participants might
be asked to assess their impression of a place using both audible and visual stimuli. Attention
is drawn to both sensory modes and a visual stimulus could influence the rating of an
auditory stimulus. In another kind of study participants might be asked only to listen to the
soundscape and evaluate that. Determining their attentional set in this way might then reduce
the importance of other senses.
3. Experiment 2: Soundscape Synthesis
3.1Method
Experiment 1 has shown that ambisonic reproduction works well enough to produce
expected responses in listeners for a real soundscape. This form of reproduction represents
the sound field as spatial components and so it is a small step to ask if it could be adapted so
that individual components of the soundscape could be manipulated in a meaningful way –
10
of a soundscape by combining recordings of ‘real’ sounds made in the field. The method for
the soundscape synthesis is described in detail elsewhere [17] and summarised briefly here.
Separate recordings were made of the background ambient soundscape (with a four-channel
soundfield microphone) and individual foreground sources, such as footsteps (with a close
mono microphone). For playback, an eight-loudspeaker first-order ambisonic system was
used, in a semi-anechoic chamber. The foreground sounds are each looped as appropriate,
mapped to a specific location and layered over the background track. It is important to note
that the foreground sources are not limited to the loudspeaker positions but can appear at any
point around the listener. This arrangement allowed for the amplitude and position of each
sound source to be controlled independently. Additional processing, such as reflection and
reverberation could also be applied to each source independently. These parameters could all
be varied in real time during playback, allowing direct interaction with the synthesised
soundscape. A small mixing desk was used as the user interface. As the participant changed
the position of each control on the mixing desk, the value of this parameter was continuously
recorded, allowing us to build up a picture of how participants interacted with the synthesised
soundscape.
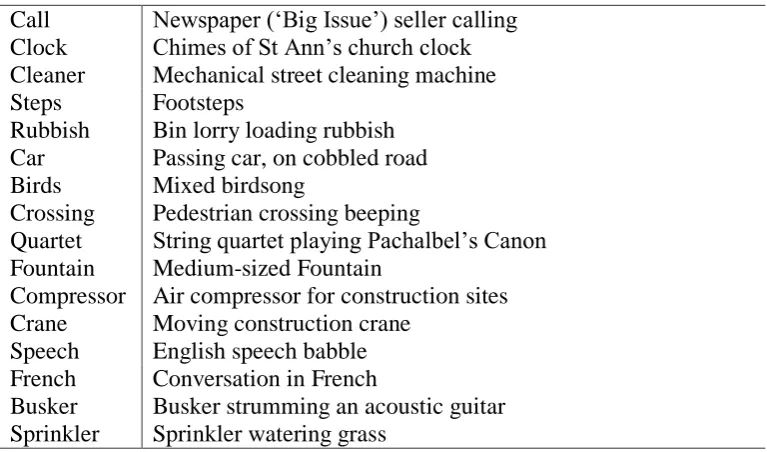
In the experiment reported here, there were eight participants, aged 20-37, and all were
naïve listeners. The recordings were made in St Ann’s Square in Manchester. Sixteen
foreground sounds were recorded and these are briefly described in Table 3. The participants
were told to imagine they were in an urban location. The task for the participants was to
synthesise what they considered to be the most appropriate soundscape for St Ann’s Square.
Participants were provided with a verbal description of the square. One soundscape was
synthesised by each participant. Each sound source could be listened to in context with the
background ambient track or on its own. In pilot experiments [17] it was found that allowing
11
experience for them, they were able to familiarise themselves with the simulator control and
operation, as well as try their own ideas out in soundscape design. Throughout the
experiment, the ambient track was looped over a two minute period and was the background
upon which foreground sounds were added. Once the experiment began, the participants were
first asked which of the sixteen sound sources they wanted to keep. They were also asked if
they would expect to hear this sound in St Ann’s Square. Participants were then asked to rate
the pleasantness of each sound in context using a semantic differential scale (pleasant –
unpleasant). Once the source sounds had been selected the participant was asked to adjust the
level of each sound source in relation to the ambient track and to a level which they thought
was acceptable. The participant was also asked to adjust the overall level of the ambient track
using the controller. Participants were informed at the beginning of the experiment how to
adjust the sound levels. The material was looped as many times as necessary for the
participant to be satisfied with their soundscape design. The experiment stopped when the
participant was satisfied with their soundscape design. The experimental variables derived
from this experiment were: selecting or deselecting each sound source (a binary variable),
adjusting the level of each source (a continuous variable), rating whether they expected each
source to be present (a binary variable), and rating the pleasantness of each source (a
nine-point integer semantic differential scale).
3.2Results and Discussion
All the participants reported that they enjoyed the experiment, approaching the
soundscape design task as a creative activity. Several remarked on the educative aspects.
Intuitive controls are probably necessary for this to work; in another experiment,
participants were asked to vary the position of each source using three controls at once
12
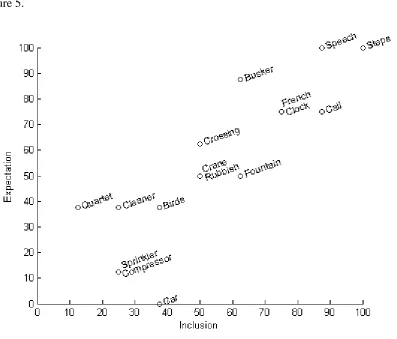
Figure 5 shows that there is a clear relationship between whether a sound was
expected and whether it was selected for the user’s soundscape design. Both expectation
and inclusion are binary variables, so the values shown in Fig. 5 are mean values from the
subject group. The extreme ends of the scale therefore represent agreement across the
group to include or exclude. The sounds in the middle produced individual differences
between participants. For example, everyone included footsteps and all but one person
excluded the string quartet. But half the group included the crane and half excluded it.
Informal verbal responses from the participants suggest that the meaning of the source
may play a significant role in sound selection. (For example, the string quartet playing
Pachalbel’s Canon was felt to be associated with Christmas, while the experiment was
conducted in Spring.)
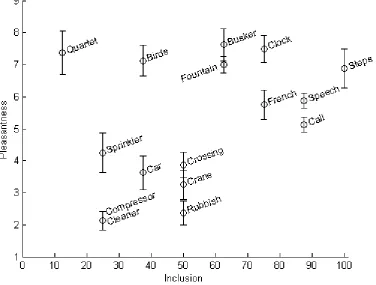
Figure 6 shows that there is a bi-modal distribution of pleasantness, with no strong
relationship to inclusion. As several other studies have found, participants dislike
mechanical and transport sounds and like human and natural sounds. The graph seems to
show that participants include or exclude a sound independently of whether they find it
pleasant or not. This suggests that they designed the soundscape based on what was
expected or appropriate rather than on simply what they liked.
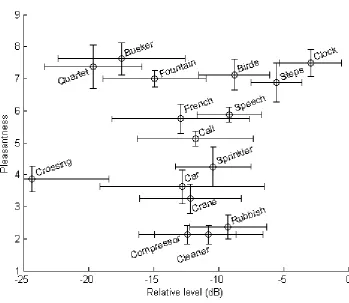
Figure 7 shows that there is also no clear relationship between pleasantness and the
level set by the participants. Again, this independence indicates that participants did not
use pleasantness in the soundscape design. There is, however, a large spread of levels,
indicating that the ‘mix’ of the soundscape varied considerably between participants.
When given the opportunity, participants will produce an individual soundscape. This is
perhaps analogous to individual preference in positioning oneself in a real environment in
order to influence the relative level of each sound. Figure 7 also shows that participants
13
dB over all settings). This is perhaps because they were conducting the experiment in the
very quiet setting of a semi-anechoic chamber.
4 Conclusion
The attempt to replicate a soundscape dimensional experiment has been successful.
Using similar semantic differential scales in different soundscape locations has resulted in
similar psychological spaces. The dimensions found in the reproduction are similar to those
in the field, and the four different soundscapes reproduced have similar dimensions. It is
suggested that the weight of evidence in the literature is now sufficient for the first two
dimensions of calmness/pleasantness and activity/eventfulness to be regarded as a ‘standard
model’ for the perceptual dimensions of soundscapes. The main effect of conducting a
soundscape listening experiment with laboratory ambisonic reproduction seems to be to
increase the variance explained (that is, to reduce the error). We therefore conclude that this
form of reproduction is ecologically valid for dimensional as well as semantic aspects of the
soundscape experience.
Ambisonic reproduction can also be used as the basis for a simple soundscape
synthesis with an ambient background and foreground sounds mapped as point sources in the
reproduction. This allows real-time continuous manipulation of the soundscape and
participants were able to use this system to design a soundscape that expressed their
intentions. It was found that the designed soundscapes seemed to be based more on
participant expectation than on their preference for individual sounds. The success of this
simple synthesis suggests that further research into more accurate simulation of complex
acoustic environments might eventually lead to a system for auralising and designing the
14
References
[1] O. Axelsson, M.E. Nilsson, B. Berglund, A principal components model of
soundscape perception, Journal of the Acoustical Society of America 128(5) (2010)
2836-2846.
[2] J. Kang, Urban Sound Environment. London: Taylor and Francis. 2007.
[3] J.D. Guillen, I. Lopez-Barrio, The soundscape experience, in: 19th International
Congress on Acoustics, Madrid, 2007.
[4] R. Cain, P. Jennings, J. Poxon, The development and application of the emotional
dimensions of a soundscape, Applied Acoustics 74(2) (2013) 232-239.
[5] A.V. Maffiolo, M. Castellengo, D. Dubois, Qualitative judgements of urban
soundscapes., in: Inter-Noise 99, Fort Lauderdale, Florida, USA, 1999.
[6] D. Dubois, C. Guastavino, M. Raimbault, A cognitive approach to urban soundscapes:
Using verbal data to access everyday life auditory categories, Acta Acustica United
with Acustica 92(6) (2006) 865-874.
[7] W.J. Davies, M.D. Adams, N.S. Bruce, M. Marselle, R. Cain, P. Jennings, J. Poxon,
A. Carlyle, P. Cusack, D.A. Hall, A. Irwin, K.I. Hume, C.J. Plack, Perception of
soundscapes: An interdisciplinary approach, Applied Acoustics 74(2) (2013) 224-231.
[8] C. Guastavino, The ideal urban soundscape: Investigating the sound quality of French
cities, Acta Acustica United with Acustica 92(6) (2006) 945-951.
[9] N.S. Bruce, W. Davies, M.D. Adams, Expectation as a factor in the perception of
soundscapes, in: Euronoise 2009, Edinburgh, U.K., 2009.
[10] C. Guastavino, B.F.G. Katz, J.D. Polack, D.J. Levitin, D. Dubois, Ecological validity
of soundscape reproduction, Acta Acustica United with Acustica 91(2) (2005)
15
[11] A.L. Brown, A. Muhar, An Approach to the Acoustic Design of Outdoor Space,
Journal of Environmental Planning and Management, 47(6) (2004) 827–842.
[12] M. Zhang, J. Kang, Towards the evaluation, description, and creation of soundscapes
in urban open spaces, Environment and Planning B: Planning and Design 34(1)
(2007) 68-86.
[13] W.J. Davies, M.D. Adams, N.S. Bruce, R. Cain, P. Jennings, A. Carlyle, P. Cusack,
K. Hume, C. Plack, A positive soundscape evaluation system, in: Euronoise 2009,
Edinburgh, U.K., 2009.
[14] M. Raimbault, Qualitative Judgements of Urban Soundscapes: Questionning
Questionnaires and Semantic Scales, Acta Acustica united with Acustica 92 (2006)
929-937.
[15] S. Viollon, C. Lavandier, C. Drake, Influence of visual setting on sound ratings in an
urban environment, Applied Acoustics 63(5) (2002) 493-511.
[16] D. Botteldooren, B. De Coensel, A model for long-term environmental sound
detection, in,2008 Ieee International Joint Conference on Neural Networks, Vols 1-8,
Ieee, New York, 2008 pp. 2017-2023.
[17] N.S. Bruce, W.J. Davies, M.D. Adams, Development of a soundscape simulator tool,
16
Table 1. Semantic differential scales used in the experiment.
Comfort 5 4 3 2 1 0 1 2 3 4 5 Discomfort
Quiet-Noisy Calming-Agitating
Pleasant-Unpleasant Smooth-Rough
Natural-Artificial Hard-Soft
Like-Dislike Fast-Slow
Gentle-Harsh Sharp-Flat
Boring-Interesting Varied-Simple
Social-Unsocial Reverberant-Anechoic
Communal-Private Far-Near
Meaningful-Insignificant Directional-Universal
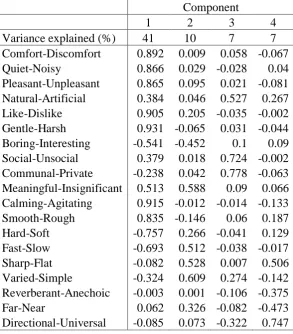
Table 2. PCA Pattern matrix showing how each semantic scale loads onto the four
dimensions from all soundscapes combined (the rotation method was Oblimin with Kaiser normalisation).
Component
1 2 3 4
Variance explained (%) 41 10 7 7
Comfort-Discomfort 0.892 0.009 0.058 -0.067
Quiet-Noisy 0.866 0.029 -0.028 0.04
Pleasant-Unpleasant 0.865 0.095 0.021 -0.081
Natural-Artificial 0.384 0.046 0.527 0.267
Like-Dislike 0.905 0.205 -0.035 -0.002
Gentle-Harsh 0.931 -0.065 0.031 -0.044
Boring-Interesting -0.541 -0.452 0.1 0.09
Social-Unsocial 0.379 0.018 0.724 -0.002
Communal-Private -0.238 0.042 0.778 -0.063
Meaningful-Insignificant 0.513 0.588 0.09 0.066
Calming-Agitating 0.915 -0.012 -0.014 -0.133
Smooth-Rough 0.835 -0.146 0.06 0.187
Hard-Soft -0.757 0.266 -0.041 0.129
Fast-Slow -0.693 0.512 -0.038 -0.017
Sharp-Flat -0.082 0.528 0.007 0.506
Varied-Simple -0.324 0.609 0.274 -0.142
Reverberant-Anechoic -0.003 0.001 -0.106 -0.375
Far-Near 0.062 0.326 -0.082 -0.473
[image:17.595.70.364.403.738.2]17
Table 3. Foreground sounds recorded for the soundscape synthesis.
Call Newspaper (‘Big Issue’) seller calling
Clock Chimes of St Ann’s church clock
Cleaner Mechanical street cleaning machine
Steps Footsteps
Rubbish Bin lorry loading rubbish
Car Passing car, on cobbled road
Birds Mixed birdsong
Crossing Pedestrian crossing beeping
Quartet String quartet playing Pachalbel’s Canon
Fountain Medium-sized Fountain
Compressor Air compressor for construction sites
Crane Moving construction crane
Speech English speech babble
French Conversation in French
Busker Busker strumming an acoustic guitar
18
Figure titles
Figure 1. Snapshots of the four locations; (a) St Ann’s Square (A); (b) St Ann’s Square (B); (c) Pedestrian underpass; (d) Busy road.
Figure 2. Mean scale values for the four soundscapes; (a) St Ann’s Sq (A) (-) and Busy road (...); (b) St Ann’s Sq (B) (-) and Pedestrian underpass (...). Negative values on the scale are associated with the first word in the semantic pair, and positive values with the second word.
Figure 3. Semantic scales plotted as vectors on the first three principal components for each location. Vectors associated with component 1 are in red, those with component 2 in cyan and those with component 3 in green.
Figure 4. Semantic scales plotted as vectors on the first three principal components for all locations combined. Vectors associated with component 1 are in red, those with component 2 in cyan and those with component 3 in green.
Figure 5. Each foreground sound in the synthesised soundscape could be included or excluded, and was also rated as expected or not by the participants. Expectation is plotted against inclusion (r=0.86).
Figure 6. Foreground sound pleasantness rating against inclusion in the synthesised soundscape. The error bars show standard error.
2 Figure 1
(a) St Ann’s Square (A) (b) St Ann’s Square (B)