PERPUSTAKAAN
UNIVERSITI
MALAYA
International Symposium on Polymer Electrolytes
(XII: 29 August - 3 September 2010: Padova, Italy)
1. PMMA-LiBOB gel electrolyte for lithium ion
batteries, by M.Z. Kufian, S.N.F. Yusuf, S.R. Majid
and A.K.Arof.
2.
Preparation and characterization of magnesium
ion gel polymer electrolytes for application in
electrical double layer capacitors, by M.Z. Kufian,
A.A.S. Nabila, S.R. Majid and A.K. Arof.
3. Characteristics of plasticized PEMA/PVdF-HFP
blend polymer electrolyte films doped with lithium
triflate salt in electrochromic device, by L.N. Sim,
S.R. Majid and A.K. Arof.
I~llir~rlj~~iiljl~ljiril~iiilliliil]i1111
~II
PERPUSTAKAAN UNIVERSITI
MALAVA
t .1'
)
PMMA-LillOB Gel Electrolyte for lithium Ion Batteries
M.Z. Kufian, S.N.F. Yusuf, S.R. Majid, A.K. Arof*
Center for lonics University of Malaya. Department of Physics, University of Malaya, 50603
Kuala Lumpur, Malaysia
*Corresponding Author: [email protected]
Tel: +603-79674085
Fax: +603-79674146
ABSTRACT
Different amounts of lithium bis(oxalate) borate (LiBOB) have been added into a mixture of
equal amounts of ethylene carbonate (EC) and propylene carbonate (PC) by weight. The highest
conducting liquid electrolyte is 0.6 M LiBOB in ECiPC with room temperature conductivity of
4.1 X 10'3 S cm'l. Different amounts of PMMA are then added to this composition and heated
between 70-80 °C for 20 min to obtain gel polymer electrolytes. The sample containing 18,67
wt.% PMMA was chosen for characterization and fabrication of lithium ion battery.
Transference number measurements for lithium ion from Bruce-Vincent and DC polarization
methods are 0,26 and 0.22, respectively. Linear sweep voltammetry indicates that the gel
electrolyte decomposition voltage is approximately 4,7 V. Cyclic voltammetry shows an
anodic peak at 1.30 V, 1.31 V and 2.45 V vs Li at a scan rate of 1, 5 and 7.5 rnv s",
respectively, indicating decomposition of LiBOB. Battery performance over 20 cycles shows
discharge capacity of about 130 mAhg'l,
PERPUSTA (AAN UNIVERSITI
MALAYA
1. INTRODUCTION
Much attention has been paid to gel electrolytes since liquid electrolytes pose many
problems such as solvent vaporization, electrochemical corrosion and leakage. Conductivity of
gel electrolytes can be as high as 10-3Sern"at room temperature. Using gel electrolytes, good
electrode-electrolyte interfacial contact can be maintained during the battery cycling [I].
A great number of lithium salts have been extensively studied for its application in
lithium ion batteries. These include LiAsF6 [2], which is highly toxic, LiC104 [3] that gives
excellent conductivity, but difficult to handle, LiBF~ [4]. which tends to produce a solid
electrolyte interphase (SEI) layer of bad quality, LiCFJS03 that produces electrolytes with quite
low conductivity and LiN(SO~F3h and LiC(S02CF3
h
that can corrode the aluminium current collector. Research has focused on a different lithium salt based on a chelated borate anionnamely, lithium bis(oxalate) borate or LiBOB. UBOB consists of a large anion with delocalized
charge [5]. LiBOB is non-toxic, low cost and has wide electrochemical window and high thermal
stability [5-lOJ. LiBOB is stable until 302QC.LiPF6 that is being used in commercial batteries is
comparatively less stable at high temperatures and decomposes to UF and PF; [11-14]. This can
result in electrode passivation and poor battery performance. UBOB has been actively used as a
doping salt in a number of polymer electrolytes systems. UBOB has doped in a blend of PVC
and PVdF by Arivandan et al. [14] resulting in a conductivity of 5 x 10⁻⁶ S em". When doped in
PEO [S], the maximum conductivity obtained is of the order 10.5S cm·l• A conductivity of 4.22
x 10-1 has been reported by Reiter et al. lIS
J
when LiBOB was doped in poly(2-ethoxyethylmethacrylate). PEOEMA. The presence of methacrylate in PEOEMA led us to use
poly(methylmethacrylate), PMMA in this work. Methacrylate-based electrolyte exhibits high
electrochemical stability, which allows their application in lithium ion batteries [15]. PMMA
has high boiling point (473 K), good impact strength, easy to dissolve and has excellent
environmental stability. Ramesh et al. [16] reported a conductivity of 9.88 x 10⁻⁵ S em" for
PMMA doped with LiCF3S03. Ali et al. [17J reported a maximum conductivity of 1.25 x 10⁻⁴ S
cm-l for PMMA-UNtCF3S02
h
system. Conductivity of - 10-3and - 10-4S cm-l were obtainedwhen PMMA was doped with UCI04 and UAsF6, respectively [18-19].
In this work, gel polymer electrolytes have been prepared with PMMA as the polymer
host and UBOB as the doping salt. A mixture of ethylene carbonate (EC) and propylene
carbonate (PC) in a 1: 1 weight ratio is the solvent. The performance of the
PMMA-EC-PC-UBOB as a separator/electrolyte inlithium batteries ispresented and discussed.
2. EXPERIMENTAL
2.1 Preparation of liquid electrolytes
Different amounts of UBOB were introduced into the EC:PC (1:1) to prepare liquid
electrolytes with concentration 0.2, 0.4, 0.6, 0.8, and 1.0 M LiBOB in EC/PC (w/w = I). The
mixtures were stirred tor 24 h to obtain homogeneous solutions.
2.2 Preparation of gel electrolyte
Five samples of gel electrolyte were prepared. 12.4 mLof propylene carbonate and 11.4
mL ethylene carbonate were mixed together and stirred for about 30 min. 2.67 g of LiBOB was
added to the homogeneous ECIPC solution (equivalent to 0.6 M UBOB in EC/PC) with
========================~
~~===x~~~~_~~
wt. %, 37.97 wt. %, and 47.87 wt. %) were added to the 0.6 M LiBOB liquid electrolyte. All the
solutions were cast into glass petri dishes and heated between 70 to 80° C for 20 min.
2.3 Samples characterization
2.3.1 Electrochemical Impedance Spectroscopy
EIS measurements were performed using HIOKI 3531 Z Hitester, in the frequency range
between 50 Hz to I MHz. The films were sandwiched between two stainless steel disc
electrodes. The impedance data are presented in a complex impedance plot where the
imaginary part, Z, of impedance was plotted against its real part, Z; From the plot, with the
horizontal and vertical axes having the same scale, the bulk resistance, R8can be obtained. The l
i".
electrical conductivity, (Jof the sample can be calculated using this equation,where tis the thickness of the sample andA is the area of the sample.
2.3.2 Transference number measurement
2.3.2.1 Bruce-Vincent Method
A constant DC potential (10 mY) was applied across a symmetrical LilGPEILi cell, The
current was monitored as a function of time until it reached a constant value. AC impedance
spectroscopy was carried out before and after the applied voltage pulse to estimate the effect of
2.3.2.2 DC Polarization Method
In this technique, the DC current is monitored as a function of time on application of
fixed DC voltage across the sample with electrode. In this study, stainless steel and lithium metal
were used as blocking and non-blocking electrode respectively. 10 mV DC was used as applied
voltage.
2.3.2.3 Solid electrolyte interphase (SET) layer
In order to determine the thickness of the SEilayer a Li/GPEILi cell was assembled in a glove
box with argon environment.
The
cell was stored at 60 °C for about 24 hours and the impedanceof the cell was measured using HIOKI 3531 Z Hi tester in the frequency range between SO Hz to
1 MHz with applied voltage of 0.5 V. This step was repeated until the interfacial resistance of the
GPE cell was constant. The thickness of the SEllayer can be calculated using equation below:
1==
liJmax £0£rAR
where l=thickness of the SEllayer, eo=permittivity of vacuum, e,= permittivity of lithium -based materials which is taken as 10 [20]. A is area of the electrode andRis measured resistance.
Samples have been characterized by linear sweep voltammetry (LSV) and cyclic 2.3.3 Linear Sweep Yoltammetry and Cyclic Yoltammetry
voltammetry (CV) in order to investigate the electrochemical behavior of the polymer
t=
(jc
u
..
::
electrolyte. LSV and CV measurements were performed by using Electrochemical Analyzer
Autolab. For both methods, nickel plates were used as working electrodes while lithium metals
were used as reference and counter electrodes. LSV was done at scan rate of 5 mV s-I.
:;
2.3.4 Battery Fabrication and characterization
In this work, lithium half-cells were fabricated using lithium cobalt oxide, LiCo02 and
lithium foil as cathode and anode respectively. The cathode (LiCo02 as the active material) was
coated on aluminium foil. The cathode film was punched into small discs with an effective
electrode area of 2.27 cm2 and dried at llO'C under vacuum for 16 h before use. GPE was used
as the separator and sandwiched between the cathode and anode. The cells were fabricated by
packing in CR 2032 coin cell. The theoretical capacity of the cell is 130 mAh g '. The cells were
characterized at constant charge-discharge current (I mA) at room temperature.
Charge-discharge measurements and cycling tests were carried out using Neware battery cycler.
3 RESULTS AND DISCUSSIONS
3.1 Electrochemical Impedance Spectroscopy
The variation of room temperature conductivity for liquid electrolytes with different
molarities of LiBOB in EC and PC is shown in Figure 1. It is observed that the conductivity of
0.2 M LiBOB salt in EC:PC (I:I)is 2.7 X 10⁻³S cm-'. The conductivity further increases until
the maximum value of 4.1 x 10⁻³Scm" for the0.6M LiBOB liquid electrolyte. This is attributed
to the increase in the number density of free ions as the salt concentration increases. However, on
addition of more LiBOB salt, the conductivity begins to decrease and drops to-3.7 x 10.3S cm-'
at 0.8 M. After the optimum concentration, an increase in salt concentration results in higher ion
aggregation and higher viscosity of the solution, which reduces the free-ion number and the ionic
mobility, respectively [21], leading to the decrease in conductivity.
6.
< <
..
~
(
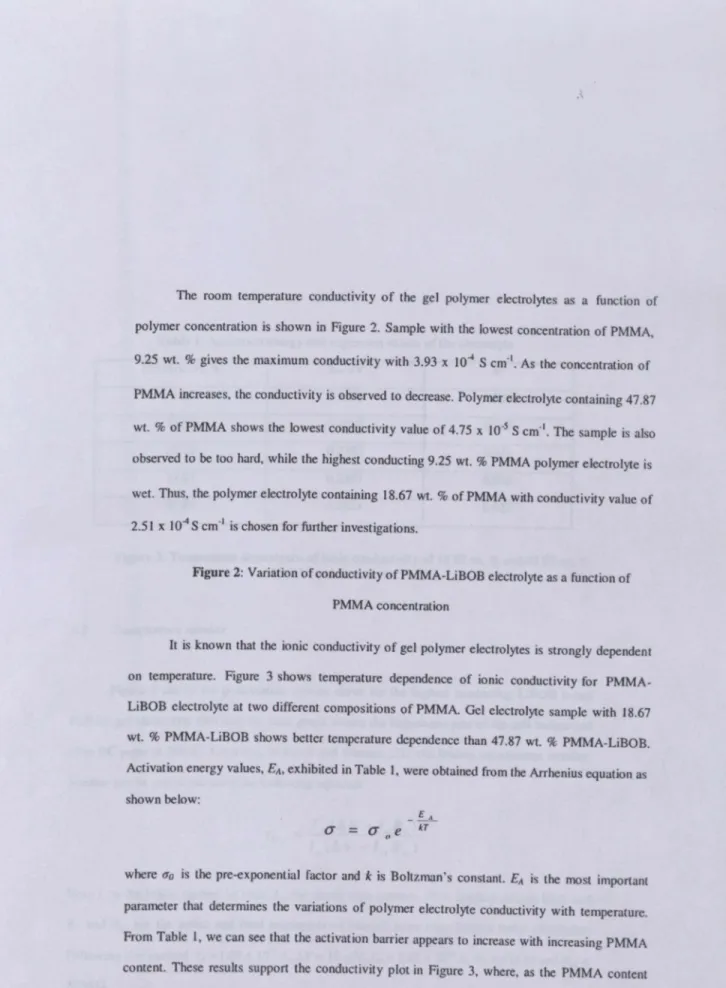
The room temperature conductivity of the gel polymer electrolytes as a function of
polymer concentration is shown in Figure 2. Sample with the lowest concentration of PMMA,
9.25 wt. %gives the maximum conductivity with 3.93 x 10⁻⁴ Scm-I. As the concentration of
PMMA increases, the conductivity is observed to decrease. Polymer electrolyte containing 47.87
wt. % of PMMA shows the lowest conductivity value of 4.75 x 10⁻⁵S ern". The sample is also
observed tobetoo hard, while the highest conducting 9.25 wt.%PMMA polymer electrolyte is
wet. Thus, the polymer electrolyte containing 18.67 wt. %ofPMMA with conductivity value of
2.51 X 10⁻⁴S ern" is chosen for further investigations.
Figure 2: Variation of conductivity of PMMA-LiBOB electrolyte as a function of
PMMA concentration
It is known that the ionic conductivity of gel polymer electrolytes is strongly dependent
on temperature. Figure 3 shows temperature dependence of ionic conductivity for
PMMA-LiBOB electrolyte at two different compositions of PMMA. Gel electrolyte sample with 18.67
wt. %PMMA-LiBOB shows better temperature dependence than 47.87 wt, %PMMA-LiBOB.
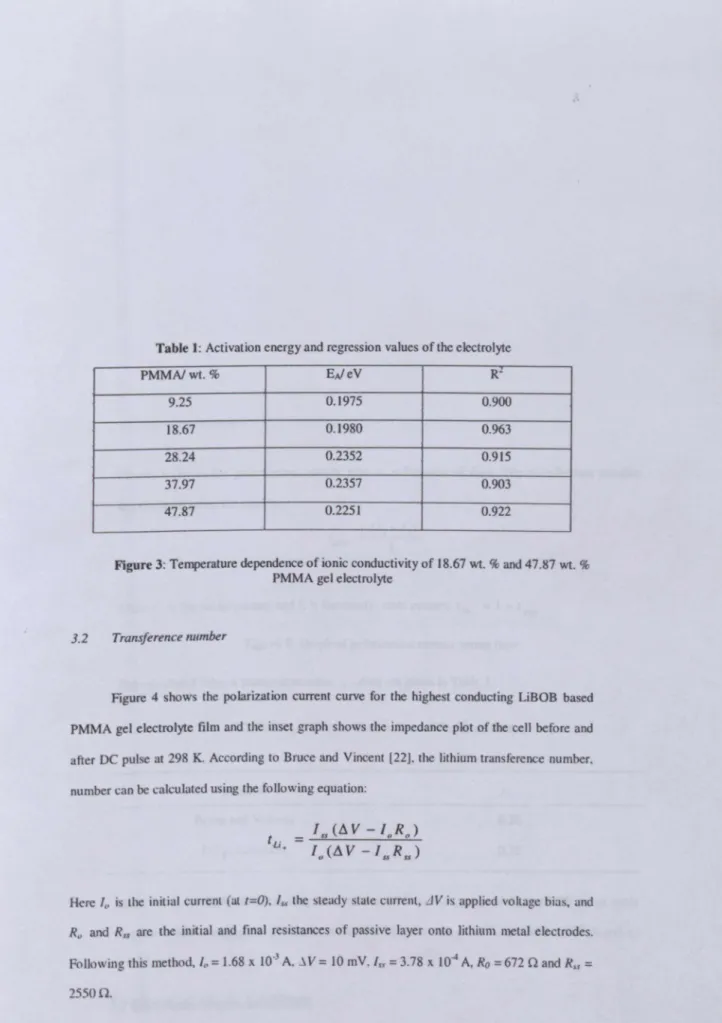
Activation energy values, EA, exhibited in Table I, were obtained from the Arrhenius equation as
shown below:
a
=
where (10 is the pre-exponentiaJ factor and Ie is Boltzrnan's constant. EA is the most important
parameter that determines the variations of polymer electrolyte conductivity with temperature.
From Table I, we can see that the activation barrier appears to increase with increasing PMMA
content. These results support the conductivity plot in Figure 3, where, as the PMMA content
Table 1: Activation energy and regression values ofthe electrolyte
PMMAlwt.% EAleV
R-9.25 0.1975 0.900
18.67 0.1980 0.963
28.24 0.2352 0.915
37.97 0.2357 0.903
47.87 0.2251 0.922
Figure 3: Temperature dependence of ionic conductivity of 18.67 wt. % and 47.87 wt.% PMMA gel electrolyte
3.2 Transference number
Figure 4 shows the polarization current curve for the highest conducting LiBOB based
PMMA gel electrolyte film and the inset graph shows the impedance plot of the cell before and
after DC pulse at 298 K. According to Bruce and Vincent [22]. the lithium trans terence number,
number can be calculated using the following equation:
Here I,. is the initial current (aL (=0), /s:, the steady state current, .Jl' is applied voltage bias, and
R; and Rss are the initial and tinal resistances of passive layer onto lithium metal electrodes.
Following this method, 10
=
1.68X 10.3A. -"V=
10 mV.I",=
3.78 X 10'" A,Ro=
672 0 and R" =25500.
r._,.~-.,...."..,
--DC polarization method
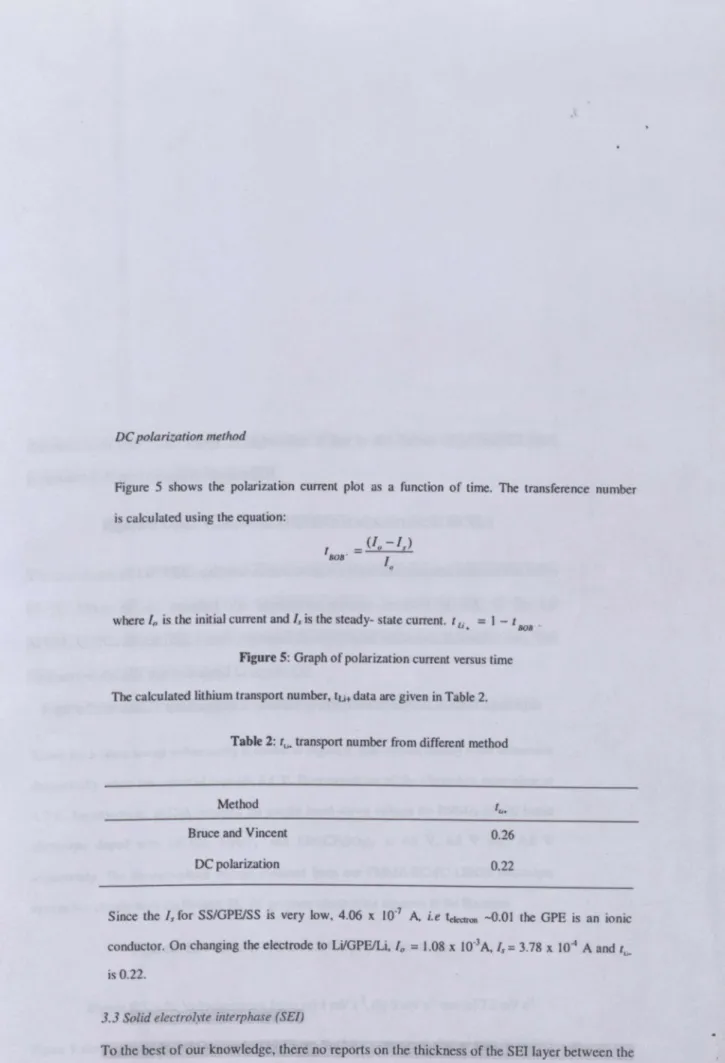
Figure 5 shows the polarization current plot as a function of time. The transference number
is calculated using the equation:
where In is the initial current and I,is the steady- state current. t u+
=
I -IBOB •Figure 5: Graph of polarization current versus time
The calculated lithium transport number, tli+data are given in Table 2.
Table 2:Ie;.transport number from different method
Method
Bruce and Vincent 0.26
DC polarization 0.22
Since the Isfor SS/GPEISS is very low, 4.06 x 10⁻⁷ A i.e telcctron-0.01 the GPE is an ionic
conductor. On changing the electrode to LilGPElLi, 10
=
1.08X 10⁻³A,Is=3.78 X 10⁻⁴A and tl~is 0.22.
3.3 Solid electrolyte interphase (SEI)
To the best of our knowledge, there no reports on the thickness of the SETlayer between the
lithium metal electrodes and gel polymer electrolyte using LiBOB salt. Figure 6 shows the
Cole - Cole plot of Li/GPEILi for various times at 60
°c.
The highest conducting sampleincreases with time. The change in impedance is due to the formation of the SEI layer
between the electrolyte and electrodes [23].
Figure 6: Cole - Cole plot of LilGPFlLi at various time at 60 °C.
The impedance of LilGPFlLi cell was almost constant after 60 hours and attained the value
84 Q. Sloop et al., reported the impedance remain constant at 100
n
for LilXPEM2~LiCIOJLi cell [23]. Figure 7 showed the interfacial resistance, R, versus time. The
thicJcness of the SEI was calculated to be 1.6 A0.
Figure 7: Interfacial resistance as a function of time for the highest conducting sample
Result from linear sweep voltammetry is shown in Figure 8. The current density starts to increase
dramatically when the potential exceeds 4.5 V. Decomposition of the electrolyte takes place at
4.7 V. Appetecchi et. al [24], reported the anodic break-down voltage for PMMA-EC-PC based
electrolyte doped with LiCI04, LiAsF6 and LiN(CF3S03h is 4.6 V, 4.8 V and 4.8 V
respectively. The decomposition voltage obtained from our PMMA-EC-PC-LiBOB electrolyte
system lies closely with the PMMA-EC-PC polymer electrolytes reported in the literature.
Figure 8: LSV curve ofPMMA-LiBOB polymer electrolyte
Figure 9: Cyclic Voltammogram for at (a) I mV s", (b) 5 mVs" and (c) 7.5 mV s
Figure 9 shows the cyclic voltammograms of 20 wt, %PMMA-80 wt. % (0.6 M LiBOB ECIPC
(w/w=l» at 1 mV s", 5 mV s' and 7.5 mV s·'. CV scanned at 1 mV s' shows peaks at 1.16 V
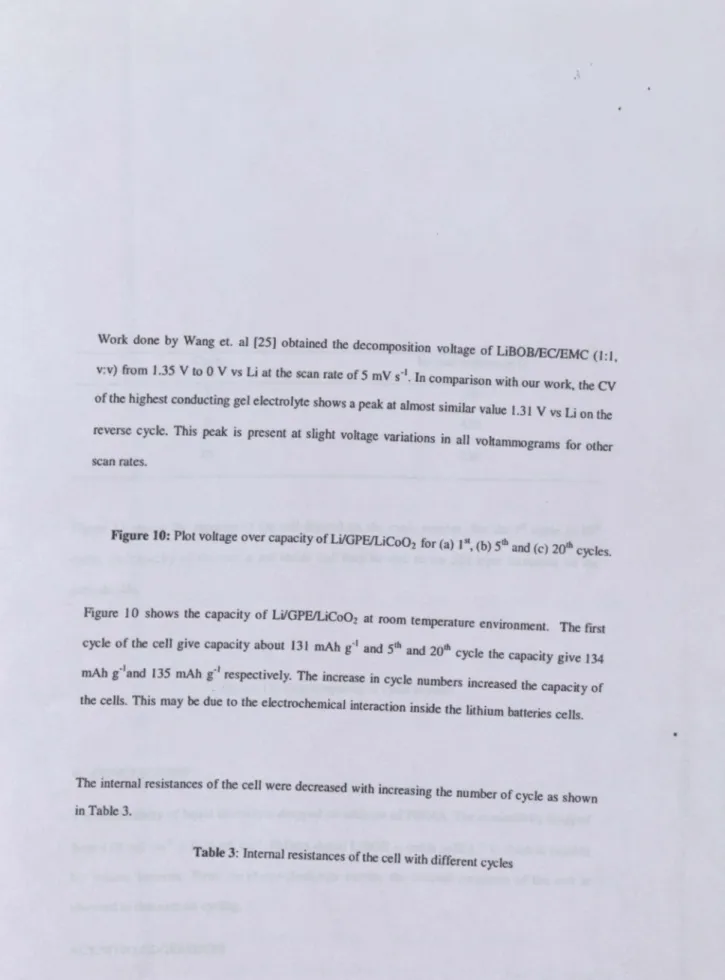
Work done by Wang et. al [25J obtained the decomposition voltage of LiBOBIECIEMC (1:1,
v:v) from 1.35 V to 0 V vs Liatthe scan rate of 5 mV S-I. In comparison with our work, the CV
of the highest conducting gel electrolyte shows a peak at almost similar value 1.31 V vs Li on the
reverse cycle. This peak is present at slight voltage variations in all voltammograms for other
scan rates.
Figure 10: Plot voltage over capacity of LilGPFJLiCo02 for (a) Ist,(b)51band (c)20'h cycles.
Figure 10 shows the capacity of LilGPFJLiCo02 at room temperature environment. The first
cycle of the cell give capacity about 131 mAh g-I and 5'h and 20'h cycle the capacity give 134
mAh g-Jand 135 mAh
s'
respectively. The increase in cycle numbers increased the capacity ofthe cells. This may be due tothe electrochemical interaction inside the lithium batteries cells.
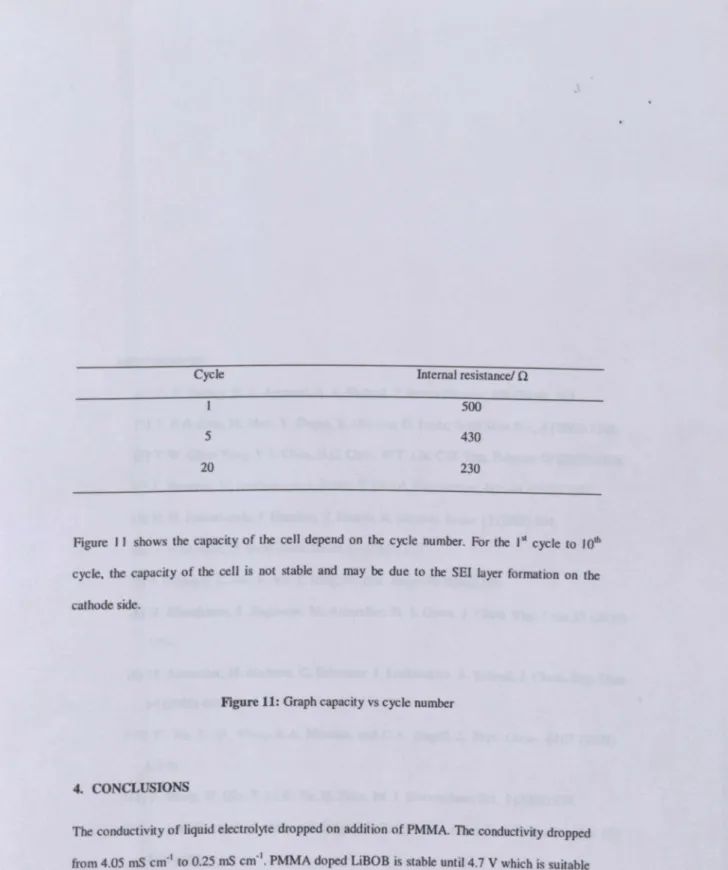
The internal resistances of the cell were decreased with increaSing the number of cycle as shown
in Table 3.
Cycle Internal resistance!
n
5
20
500
430
230
Figure II shows the capacity of the cell depend on the cycle number. For the I" cycle to 10'h
cycle, the capacity of the cell is not stable and may be due to the SEI layer formation on the
cathode side.
Figure11: Graph capacity vs cycle number
4. CONCLUSIONS
The conductivity of liquid electrolyte dropped on addition of PMMA. The conductivity dropped
from 4.05 mS cnfl to 0.25 mS cm'l. PMMA doped LiBOB is stable until 4.7 V which is suitable
for lithium batteries. From the charge-discharge curves, the internal resistance of the cell is
observed to decrease on cycling.
ACKNOWLEDGEMENTS
REFERENCES
[I J G. P. Pandey, R. C. Agrawal, S.A.Hashmi, I.Power Sources, 190 (2009), 563.
[2J T. Nakajima, M. Mori, V. Gupta, Y. Ohzawa, H. IWata, Solid State Sci., 4 {2(02) 1385.
[3J Y.W. Chen-Yang, Y.T. Chen, H.C. Chen, W.T. Lin, C.H. Tsai, Polymer 50 (2009) 2856.
[4] I. Vondrak, M. Sedlarikova, I. Reiter, T. Hodal, Electrochim. Acta 44 (1999) 3067.
[5] H. H. Sumathipala, I.Hassoun, S. Panero, B. Scrosati, Ionics 13 (2007) 281.
[61 V. Aravindan, P. Vickrarnan, Jonics 13(2007) 277.
[71 I. Huang, L.Z. Fan. B. Yu. T. Xing, W. Qiu, Jonics 16 (2010) 509.
[8J D. Moosbauer, S. Zugmann, M. Amereller, H. I.Gores, I.Chem. Eng. Data 55 (2010)
1794.
{9] M. Amereller, M. Multerer, C. Schreiner, I.Lodermeyer, A.Schmid, I.Chern. Eng. Data 54 (2009) 468.
[10] W. Xu, L.-M. Wang, R.A. Nieman, and C.A. Angell, I.Phys. Chern. B 107 (2003)
11749.
r
II] S. Wang, W. Qiu, T. Li, B. Yu, H. Zhao, Int.I.Electrochem. Sci., 1 (2006) 250.[121 L. Larush-Asraf, M. Biton, H. Teller, E. Zinigrad, D. Aurbach, 1. Power Sources 174
(2007) 400.
[13] W. Lu, Z. Chen, H. loachin, 1. Prakash, 1. Liu, K.Amine, I.Power Sources 163 (2007) 1074.
[141 V. Aravindan, P. Vickraman, T.P. Kumar, I.Membr. Sci. 305 (2007) 146.
(J5] 1. Reiter, O. Krejza, M. Sedlankova, Solar Energy Materials &Solar Cells 93 (2009)
r
16J S. Rarnesh, Koay Hang Leen, K. Kumutha, A.K. Arof, Spectrochim. Acta 66A (2007)1237.
[17] A.M.M. Ali, M.Z.A. Yahya, H. Bahron, R.H.Y. Subban, M.K. Harun, I.Atan, Mater.
Letts. 61 (2007) 2026.
[18] Hsien-Wei Chen, Tzu-Pin Lin, Feng-Chih Chang, Polymer 43 (2002) 5281.
[19] S. Rajendran, T. Uma, T. Mahalingam, Euro. Polym. J. 36 (2000) 2617
[20] A.M. Stephan, T. P. Kumar, M. A. Kulandainathan, N .. A. Lakshrni, J. Phys. Chem.
B (113) 2009 1963
[21J F. Azeez, P. S. Fedkiw, J. Power Sources 195 (2010) 7627.
[22] P.G. Bruce, M.T. Hardgrave, C.A. Vincent, Electrochim. Acta 37 (1992) 1517.
[23J S. E. Sloop, M. M. Lerner, Solid State lonics 85 (1996) 251
[24J G.B. Appetecchi, F. Croce, R. Marassi, L. Persi, P. Romagnoli, B.
Scrosati, Elecrrochim. Acta 45 ([999) 23.
----List of figures
's
u
Vl
15
5.00E..()3
4.50E-03
4.00E-03
3.50E-03
3.00E-03
2.50E-03
2.00E-03
1.50E..()3
1.00E..()3
0 0.2 0.4 0.6 0.8 1.2
Molarity/ mol L-1
-3
-3.2
-3.4
•
-
8
-3.6•
•
utr.
-
I> -3.8""
.s
-4-4.2
•
•
-4.4
0 10 20 30 40 50
WI. %PMMA
Figure 2
-2.0
-2.5
-8
-3.0u
til
t5
co
•
.3
-3.5-4.0
-4.5 2.6
.18.67%
• •
•
•
•
•
2.9 3 3.1
(IOOO{f)/KI
2.7 2.8
Figure 3
3.2 3.3
I
10E+{)O
1.6E+{)O
~ 1::E+{)O
g
8
8 OE-O12.5OE'"
..
•
2.00E'"
r.5OE.o.
c:
N t.OOE'"
5.00E.o3
O.OOE.ooo.OOE.oo 5.00E.03 '.OOE'" •. 5OE.04 2.00E.04 2.50E.04
Z.Hl
1..
.tOE-Ol
.f--~/::.---,,_~~----o
OE+{)O .t000:-;000 (,000
o
10001000 :;000
Timels
1.8E.Q3
1.4E.Q3 .
l.OE.Q3
.(
fi
t::::l
u 6.0E.Q4 LilGPFJLi
2.0E.Q4
1
L---
SS/GPFJSS-2.0E.Q4 ...
o
200 400 600 800TiID!ls
1000 1200 1400
250 150 C
N
-..
_...
_...- -_.. ---_.---200 --- ---100 ---50o
o .20 hourst.60 hours X 100 hours
0140 hours
+180 hours
.200 hours .0hour -- --- - -_ _' .. -- --- - --p X .ct
#:~+
•• • t.
300
250
-c
8
200e
"
;;.~ 150
--;;
~
]
100•
•
•
•
•
•
•
50-0
0 50
100 150 200
Time (hours)
1.0
0.5
, , , , ,
-e 0.0
:l.
':> ,
c ,
.,
,t: ,
:> ,
U
..{),S
-1.0
..( -1.0E-04
E
~
U _2.0E-04 2.0E-041
1.0E-04 ~
I
5 6
FJVvsLi
,
,
/
,
.-3.0E-04 /
1/
-4.0E-04
I
-5.0E-04
J
4.4 4.2 4 3.8 :> <; ~ 3.6 '0 :> 3.4 32 3 0 50 4.4 4.2 4 :> <;
..
3.8'"
~ 3.6 3.4 3.2 3 0 50/:J.V =0.5 V
100 150 200
Capacity! mAh
s'
250 300
/:J.V =0.43 V
100 150 200 250 300
Capacity! mAh got
4.4
-4
]. 3.8 "
..
~
:> 3.6
-3.4 ~
i
3.2i
3L---~--~~--~--~~~
o 50 100 150 200
Capacity! mAh
s"
250 300
180
160
..,
140 01)~
.§ 120
z-'u 100
...
fir 80
U
60
40
20
0
0
X Chagre capacity
o
Disharge capacity5 10 15
20
Cycle number
List
or
Fjgure captionsFigure 1: Effects of LiBOB concentration onthe conductivity atroom temperature.
Figure 2: Variation of conductivityofPMMA-LiBOB electrolyte as a function ofPMMA
concentration
Figure 3: Temperature dependence of ionic conductivity of 18.67 wt. % and 47.87 WI. %
PMMA gel electrolyte
Figure 4: DC polarization curve forthe highestconducting LiBOB-based PMMA gel electrolyte
Figure 5: Graph of polarization current versus time
Figure 6: Cole - Cole plot of LilGPFlLi at various time at 60°C.
Figure 7: Interfacial resistance as a function of time for the highest conducting sample
Figure 8: LSV curve of PMMA-LiBOB polymer electrolyte
Figure 9: Cyclic Voltammogram for at (a) I mVS·I,(b) 5 mV S·Iand (c) 7.5 mVS·I
Figure 10: Plot voltage over capacity of LilGPElLiCo02 for (a) 1st,(b) 5thand (c) 20th cycles.