comm
en
t
re
v
ie
w
s
re
ports
de
p
o
si
te
d r
e
se
a
rch
refer
e
e
d
re
sear
ch
interacti
o
ns
inf
o
rmation
Clustering analysis of SAGE data using a Poisson approach
Li Cai
¤
*
, Haiyan Huang
¤
†¶
, Seth Blackshaw
‡¥
, Jun S Liu
§
, Connie Cepko
‡
and Wing H Wong
†§
Addresses: *Department of Research Computing, Dana-Farber Cancer Institute, 44 Binney Street, Boston, MA 02115, USA. †Department of
Biostatistics, Harvard School of Public Health, 66 Huntington Avenue, Boston, MA 02115, USA. ‡Department of Genetics, Harvard Medical
School, 77 Avenue Louis Pasteur, Boston, MA 02115, USA. §Department of Statistics, Harvard University, Science Center, 1 Oxford Street,
Cambridge, MA 02138, USA. ¶Current address: Department of Statistics, University of California, Berkeley, 367 Evans Hall, Berkeley, CA
94720, USA. ¥Current address: Department of Neuroscience, Johns Hopkins University School of Medicine, 773 N Broadway Ave, Baltimore,
MD 21287, USA.
¤ These authors contributed equally to this work.
Correspondence: Wing H Wong. E-mail: [email protected]
© 2004 Cai et al.; licensee BioMed Central Ltd. This is an Open Access article: verbatim copying and redistribution of this article are permitted in all media for any purpose, provided this notice is preserved along with the article's original URL.
Clustering analysis of SAGE data using a Poisson approach
<p>Serial analysis of gene expression (SAGE) data have been poorly exploited by clustering analysis owing to the lack of appropriate sta-tistical methods that consider their specific properties. We modeled SAGE data by Poisson statistics and developed two Poisson-based dis-tances. Their application to simulated and experimental mouse retina data show that the Poisson-based distances are more appropriate and reliable for analyzing SAGE data compared to other commonly used distances or similarity measures such as Pearson correlation or Euclidean distance.</p>
Abstract
Serial analysis of gene expression (SAGE) data have been poorly exploited by clustering analysis owing to the lack of appropriate statistical methods that consider their specific properties. We modeled SAGE data by Poisson statistics and developed two Poisson-based distances. Their application to simulated and experimental mouse retina data show that the Poisson-based distances are more appropriate and reliable for analyzing SAGE data compared to other commonly used distances or similarity measures such as Pearson correlation or Euclidean distance.
Background
Serial analysis of gene expression (SAGE) is an effective tech-nique for comprehensive gene-expression profiling. It has been used in studies of a wide range of biological systems [1-5]. Several SAGE analysis methods have been developed, pri-marily for extracting SAGE tags and identifying differences in mRNA levels between two libraries [2,3,6-11]. However, searching for patterns and grouping transcripts into expres-sion clusters provides additional insight into the biological function and relevance of genes that show different expres-sion. Thus, it is essential to investigate appropriate and relia-ble clustering methods for analyzing SAGE data.
Successful clustering analysis depends on choosing an appro-priate distance or similarity measure [12] that takes into account the underlying biology and the nature of the data. Commonly used measures include the Pearson correlation
and Euclidean distance for data with a normal distribution [12]. Those measures have been successful in microarray expression data analysis. However, SAGE data are generated by sampling, which results in 'counts', and are governed by different statistics from those of microarray data. Thus, the distance metrics suitable for measuring dissimilarity of microarray data may not be suitable for SAGE data. In this regard, SAGE data have been poorly exploited owing to a lack of appropriate statistical methods that consider the specific properties of SAGE data.
In this paper, we assume that the tag counts follow a Poisson distribution. This is a natural assumption seeing how SAGE data are generated (see Materials and methods for details). We use the chi-square statistic as a measure of the deviation of observed tag counts from expected counts, and employ it within a K-means clustering [13] procedure. We call this Published: 29 June 2004
Genome Biology 2004, 5:R51
Received: 19 January 2004 Revised: 14 April 2004 Accepted: 3 June 2004 The electronic version of this article is the complete one and can be
newly developed algorithm PoissonC. To evaluate the Pois-sonC algorithm, we applied it to a simulated dataset and a set of experimental mouse retinal SAGE libraries. The simulation results demonstrate clear advantages of using the chi-square statistic over Pearson correlation and Euclidean distance when the data are sampled from Poisson distributions. When applied to the mouse retinal SAGE libraries, PoissonC pro-duced clusters of more biological relevance than clusters gen-erated by some other popular clustering methods. This superior performance of PoissonC partially confirms the validity of the Poisson model.
In addition to the chi-square statistic, we also studied the use of the log-likelihood: that is, the logarithm of the joint proba-bility of the observed counts under the expected model as a measure of similarity in the K-means clustering procedure. We call this algorithm PoissonL. The PoissonL algorithm is based purely on the Poisson assumption; thus it would not work well unless the data follow at least an approximate Pois-son distribution. PoisPois-sonL and other methods, including PoissonC, K-means using Pearson correlation distance (Pear-sonC), and K-means using Euclidean distance (Eucli), were applied to a set of 143 mouse SAGE tags with known func-tional annotations. The clustering results show that PoissonL performs the best and PoissonC second (both within 5% error rate). Both PoissonL and PoissonC outperform PearsonC and Eucli. The success of Poisson-based algorithms further con-firms the validity of Poisson model.
Although PoissonL performs best, it is also the slowest. It is at least 10 times slower than any of the other algorithms. Thus, PoissonC is more practical and appropriate for large SAGE datasets, providing results comparable to PoissonL but com-putationally much more efficient. The software of K-means procedure using the above distances and similarity measures is available to researchers at [14].
In this study, we implemented the Poisson-based distances in the K-means procedure to show that the Poisson-based dis-tances perform better than Pearson correlation and Eucli-dean distance in clustering SAGE data. In addition to K-means, many other popular clustering methods are being used for revealing patterns of gene expression, including hier-archical clustering [15,16], self-organizing maps (SOMs) [17] and model-based cluster methods [18-20]. The Poisson-based distances can be implemented in those clustering pro-cedures as well.
Results
Clustering results of the simulation data
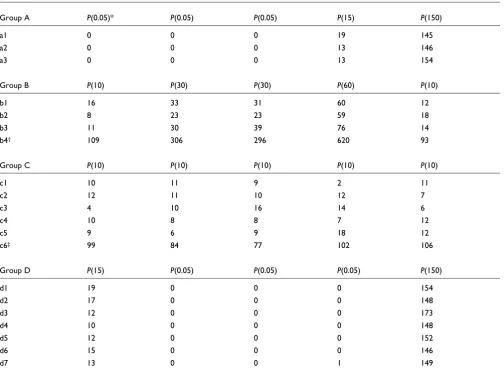
To evaluate the performance of the PoissonC algorithm, we first applied it to simulated data. An illustrative example of the simulated dataset is shown in Table 1, which consists of simulated counts of 20 tags at five time points. All the counts are generated independently from Poisson distributions, and
the 20 tags belong to four groups - A, B, C, and D - according to the models they are generated from. The four groups are of size three, four, six, and seven, respectively. The tags from the same group have the same expression profile, and the expres-sion profile is determined by the relative expresexpres-sion across different time points rather than the absolute expression level. For instance, b4 from group B is generated from the
Poisson distributions with means µ =
(100,300,300,600,100), while other members of group B are
generated from the Poisson distributions with mean µ' =
(10,30,30,60,10); µ= 10 µ'.
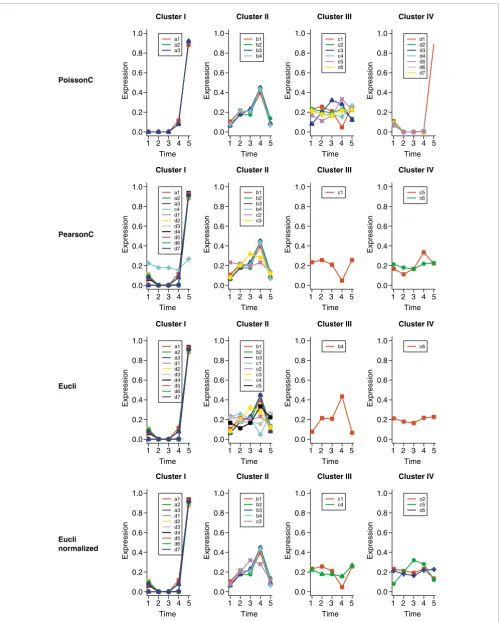
For comparison, we applied PoissonC, PearsonC and Eucli to the simulated data. The clustering results from different methods are shown in Figure 1. Data were normalized before plotting. For each tag, the count vector (tag frequency in each SAGE library) is rescaled to make the sum of the elements of the count vector equals 1; for example, b4 =
(109,306,296,620,93) is rescaled to b4' = b4/θ, where θ= 109
+ 306 + 296 + 620 + 93.
In Figure 1, only PoissonC clustered the tags correctly into four groups. PearsonC and Eucli incorrectly assigned most of the tags to clusters I and II. The poor performance of Pear-sonC may be due to the fact that the Pearson correlation dis-tance only compares the shape of the curves, but neglects the magnitude of changes. For instance, the Pearson correlation coefficient (PCC) between c4 = (10,8,8,7,12) and c5 = (9,6,9,18,12) is only -0.16 while the PCC between c4 = (10,8,8,7,12) and d1 = (19,0,0,0,154) is 0.89. The Eucli algo-rithm identified two single-member clusters (III and IV in Figure 1). This is because Euclidean distance takes the differ-ence between data points directly; thus it may be overly sen-sitive to the magnitude of changes. So, b4 and c6 are clustered alone because of their large magnitudes. To reduce the mag-nitude effects, we apply Eucli to the normalized data. Data normalization was performed in the same way as we did for plotting. Figure 1 shows that the clustering results on normal-ized data were cleaner and more accurate than the results on un-normalized data, although there were still many tags incorrectly grouped in clusters I and II.
We performed an additional 100 replications of the above simulation. PoissonC correctly clustered 90 of the 100 repli-cate datasets. Eucli on normalized data correctly clustered 49 of the 100 datasets while PearsonC or Eucli on un-normalized data never generated correct clusters.
To further test these methods, we applied the different algo-rithms to a larger simulated dataset containing 2,000 tags with counts at five different time points. Results were similar to those observed for the smaller dataset (data not shown).
comm
en
t
re
v
ie
w
s
re
ports
refer
e
e
d
re
sear
ch
de
p
o
si
te
d r
e
se
a
rch
interacti
o
ns
inf
o
rmation
Eucli algorithm can be improved to some extent when it is applied to normalized data.
Clustering results of experimental SAGE data
To validate our newly developed PoissonC algorithm on experimental SAGE data, we applied PoissonC, PearsonC and Eucli to a set of mouse retinal SAGE libraries. The raw mouse retinal data consists of 10 SAGE libraries (38,818 unique tags
with tag counts ≥ 2) from developing retina taken at 2-day
intervals, ranging from embryonic day 12.5 (E12.5) to postna-tal day 6.5 (P6.5), P10.5 and adult [21]. Of the 38,818 tags, 1,467 with counts equal to or greater than 20 in at least one of the 10 libraries were selected. These 1,467 tags were the potentially most biologically relevant SAGE tags because of their high tag frequencies. These 1,467 tags were grouped into 30 clusters using each of the algorithms, PoissonC, PearsonC and Eucli on original and normalized data. Clusters from each
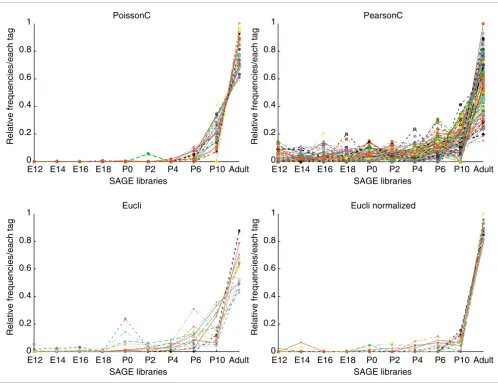
algorithm were compared and analyzed in detail. In general, the patterns revealed by the clusters under different algo-rithms roughly agreed with each other. SAGEmap (tag to gene mapping) [22] was used to evaluate the biological relevance for all clusters. Analysis of a set of clusters corresponding to mouse photoreceptor genes is presented in Figure 2 as an illustrative example. The comparison statistics are summa-rized in Table 2.
[image:3.612.55.559.114.482.2]The clusters in Figure 2 show high tag counts in late retinal development, that is, P6, P10 and adult, and their gene-expression pattern correlates with photoreceptor cell differ-entiation. The cluster generated by PoissonC contains 28 tags, and 78.6% (22 of 28) of those tags mapped to photore-ceptor genes, for example rhodopsin, cone opsin and recov-erin. Importantly, all five of the 'rhodopsin' tags were grouped together. The clusters generated by PearsonC or Eucli are Table 1
List of simulated data
Group A P(0.05)* P(0.05) P(0.05) P(15) P(150)
a1 0 0 0 19 145
a2 0 0 0 13 146
a3 0 0 0 13 154
Group B P(10) P(30) P(30) P(60) P(10)
b1 16 33 31 60 12
b2 8 23 23 59 18
b3 11 30 39 76 14
b4† 109 306 296 620 93
Group C P(10) P(10) P(10) P(10) P(10)
c1 10 11 9 2 11
c2 12 11 10 12 7
c3 4 10 16 14 6
c4 10 8 8 7 12
c5 9 6 9 18 12
c6‡ 99 84 77 102 106
Group D P(15) P(0.05) P(0.05) P(0.05) P(150)
d1 19 0 0 0 154
d2 17 0 0 0 148
d3 12 0 0 0 173
d4 10 0 0 0 148
d5 12 0 0 0 152
d6 15 0 0 0 146
d7 13 0 0 1 149
* P(0.05): Poisson distribution with mean 10. †b4 is generated by P(100), P(300), P(300), P(600), P(100). ‡c6 is generated by P(100), P(100), P(100),
Figure 1 (see legend on next page)
Expression Expression Expression Expression
Expression Expression Expression Expression
Expression Expression Expression Expression
Expression Expression Expression Expression
a1 a2 a3 Cluster II b1 b2 b3 b4 Cluster III c1 c2 c3 c4 c5 c6 Cluster IV d1 d2 d3 d4 d5 d6 d7 a1 a2 a3 c4 d1 d2 d3 d4 d5 d6 d7 Cluster II b1 b2 b3 b4 c2 c3 Cluster III c1 Cluster IV c5 c6 a1 a2 a3 d1 d2 d3 d4 d5 d6 d7 Cluster II b1 b2 b3 c1 c2 c3 c4 c5 Cluster III b4 Cluster IV c6 Cluster I Cluster I Cluster I Cluster I a1 a2 a3 d1 d2 d3 d4 d5 d6 d7 Cluster II b1 b2 b3 b4 c3 Cluster III c1 c4 Cluster IV c2 c5 c6 1.0 0.8 0.6 0.4 0.2
1 2 3 4 5 Time 0.0 1.0 0.8 0.6 0.4 0.2
1 2 3 4 5 Time 0.0 1.0 0.8 0.6 0.4 0.2
1 2 3 4 5 Time 0.0 1.0 0.8 0.6 0.4 0.2
1 2 3 4 5 Time 0.0 1.0 0.8 0.6 0.4 0.2
1 2 3 4 5 Time 0.0 1.0 0.8 0.6 0.4 0.2
1 2 3 4 5 Time 0.0 1.0 0.8 0.6 0.4 0.2
1 2 3 4 5 Time 0.0 1.0 0.8 0.6 0.4 0.2
1 2 3 4 5 Time 0.0 1.0 0.8 0.6 0.4 0.2
1 2 3 4 5 Time 0.0 1.0 0.8 0.6 0.4 0.2
1 2 3 4 5 Time 0.0 1.0 0.8 0.6 0.4 0.2
1 2 3 4 5 Time 0.0 1.0 0.8 0.6 0.4 0.2
1 2 3 4 5 Time 0.0 1.0 0.8 0.6 0.4 0.2
1 2 3 4 5 Time 0.0 1.0 0.8 0.6 0.4 0.2
1 2 3 4 5 Time 0.0 1.0 0.8 0.6 0.4 0.2
1 2 3 4 5 Time 0.0 1.0 0.8 0.6 0.4 0.2
comm
en
t
re
v
ie
w
s
re
ports
refer
e
e
d
re
sear
ch
de
p
o
si
te
d r
e
se
a
rch
interacti
o
ns
inf
o
rmation
much noisier. The percentages of photoreceptor-specific genes were 35.8%, 66.7% and 70.6% for PearsonC and Eucli on original and normalized data, respectively (Table 2). Only two of the five rhodopsin tags were correctly grouped by Pear-sonC or Eucli, or Eucli on normalized data (Table 2).
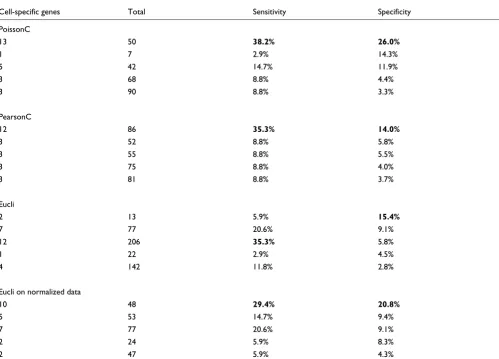
To test the sensitivity and specificity of PoissonC for
cluster-ing SAGE data, four sets of clusters (number of clusters (K) =
25) were generated for the 1,467 tags by each of the different algorithms. Thirty-four tags that showed the most dynamic and cell-specific expression in the mouse neonatal retina (developmental stages P0-P6 [21]) were selected to compare the ability of each of the four algorithms to cluster these 34 'cell-specific' tags into appropriate clusters (see Additional data file). For these 34 tags, PoissonC generated clusters that are most enriched for cell-specific genes (Table 3).
It is impossible to judge the performance of the algorithms on clustering SAGE tags with unknown biological function(s). Many SAGE tags have not been annotated in the current release of SAGEmap (the version used was last updated on 3 April, 2004); for example, 126,111 of the 508,202 mouse tags are RIKEN cDNAs. For the 1,467 mouse retinal SAGE tags, 247 tags are RIKEN cDNAs (with unknown biological func-tion) and 32 tags have no matches with SAGEmap. To com-pare the clustering algorithms effectively, a subset of 143 SAGE tags all with known biological functions were selected. These 143 tags fall into six clusters on the basis of their bio-logical function(s), cell-type specific gene expression, or tim-ing of gene expression durtim-ing mouse retinal development.
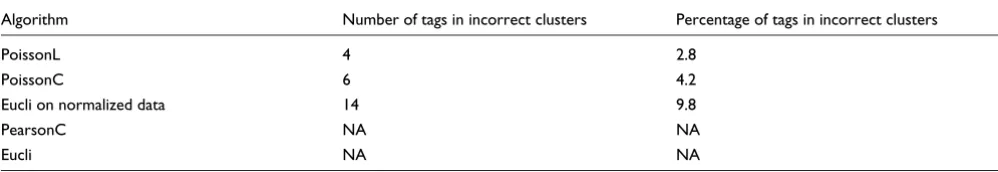
PoissonC, PoissonL, PearsonC, and Eucli were applied to group these 143 tags in six clusters. Results show that 4, 6 and 14 of the 143 tags were in the incorrect clusters for PoissonL, PoissonC, and Eucli on normalized data, respectively (Table 4). There were too many tags in the incorrect clusters for PearsonC and Eucli on original data to perform a correct sta-tistical study (data not shown). The performance of PoissonL and PoissonC were very close: PoissonL and PoissonC cor-rectly grouped 97.2% (139 of 143) tags and 95.8% (137 of 143), respectively. Both algorithms have an error rate of less than 5% (Table 4).
Discussion
In this study, we have implemented the Poisson-based dis-tances into the K-means procedure and demonstrated that the Poisson-based distances have advantages over the Pear-son correlation and Euclidean distance in clustering SAGE
data. The poor performance of PearsonC and Eucli may be due to the fact that the Pearson correlation distance only cares about the shape of the curves, but neglects the magni-tude of changes, while the Euclidean distance takes the differ-ence between data points directly and may be overly sensitive to the magnitude of changes.
An unsolved issue in K-means clustering analysis is the
esti-mation of K, the number of clusters. If K is unknown, starting
with arbitrary random K is a relatively poor method. Hartigan
[23] proposed a stage-wise method to determine the K value.
However, when sporadic points are present in the dataset, Hartigan's method may fail. The recently introduced method of TightCluster [24] partially solves this problem by a resam-pling method to sequentially attain tight and stable clusters in order of decreasing stability.
The Poisson-based methods PoissonC and PoissonL are
appropriate for clustering analysis of data with Poisson distri-bution, for example SAGE data, data from the massive paral-lel signature sequencing (MPSS) profiling [25], and digital gene expression un-normalized EST datasets. MPSS is simi-lar to SAGE in that it is a sampling method that permits quan-tification of the number of specific mRNAs in an RNA sample.
Conclusions
From the analysis of simulation data and the experimental mouse retinal SAGE data, we demonstrate that the Poisson-based methods, PoissonC and PoissonL, are more appropri-ate for analyzing SAGE data. The success of PoissonC and PoissonL indicates that an effective method for analyzing large-scale gene-expression data must be based on an under-standing of the biological and statistical nature of the experi-mental data.
Materials and methods
Poisson assumption
In a SAGE experiment, a subset of transcripts from a cell or tissue is sampled for tag extraction. The number of sampled transcripts of a particular type is binomially distributed when the sampling process is random. In this multinomial process, the selection probability of a particular type of transcript at each draw should be very small considering the numerous types of transcripts in a particular cell or tissue. Thus the binomial distribution is well approximated by a Poisson limit [26], and we can assume that the number of sampled tran-scripts of each type is approximately Poisson distributed. Graphs of clustering results for simulation data
Figure 1 (see previous page)
Graphs of clustering results for mouse retinal SAGE data Figure 2
Graphs of clustering results for mouse retinal SAGE data. The x-axis represents the time points of the developing mouse retina SAGE libraries; the y-axis represents the relative frequency for each tag scaled as a percentage. Data were normalized before plotting. Each tag from the 10 libraries was rescaled to make the sum of all 10 tags equal to 1. Different colors represent different tags. See Additional data file 1 for more details.
Table 2
Statistics of photoreceptor-generated clusters by four different algorithms
Algorithm Number of total members Number of specific genes Percentage of specific genes
Number of rhodopsin tags
PoissonC 28 22 78.6 5 of 5
PearsonC 67 24 35.8 2 of 5
Eucli 12 8 66.7 2 of 5
Eucli on normalized data 17 12 70.6 2 of 5
See Additional data file 1 for more details.
Relative frequencies/each tag
SAGE libraries
E12 E14 E16 E18 P0 P2 P4 P6 P10 Adult
0 0.2 0.4 0.6 0.8 1
Relative frequencies/each tag
SAGE libraries
E12 E14 E16 E18 P0 P2 P4 P6 P10 Adult
0 0.2 0.4 0.6 0.8 1
Relative frequencies/each tag
SAGE libraries
E12 E14 E16 E18 P0 P2 P4 P6 P10 Adult
0 0.2 0.4 0.6 0.8 1
Relative frequencies/each tag
SAGE libraries
E12 E14 E16 E18 P0 P2 P4 P6 P10 Adult
0 0.2 0.4 0.6 0.8 1
PoissonC PearsonC
[image:6.612.55.556.602.685.2]comm
en
t
re
v
ie
w
s
re
ports
refer
e
e
d
re
sear
ch
de
p
o
si
te
d r
e
sea
rch
interacti
o
ns
inf
ormation
Probability model
We assume that the count of each tag in a SAGE library is Poisson distributed. These Poisson distributions are inde-pendent of each other across different tags and libraries.
Let Yi(t) be the count of tag i in library t, and Yi(t) ~
Pois-son(λi(t)θi). The expected count λi(t)θi consists of two factors:
θi is the expected sum of counts of transcript i (tag i) over all
libraries; λi(t) is the contribution of transcript i in library t to
the sum θi expressed in percentage.
when a total of T libraries are considered. So λi(t)θi
redistrib-utes the tag counts according to the cluster profile (λ) but keeps the sum of counts across libraries constant.
The goal is to group the transcripts with similar relative expression patterns across different libraries, that is to cluster
tags by their λi(t) values. We assume that the tags within a
cluster share the same λ = (λ (1),λ(2), ..., λ (T)), and l
uniquely represents the cluster profile. Letting Yi = (Yi(1),...,
Yi(T)), we have the following joint likelihood function for a
cluster consisting of tags 1, 2, ..., m:
[image:7.612.56.555.120.479.2]The maximum likelihood estimate of λs and θs are:
Table 3
Statistics of the 34 cell-specific genes
Cell-specific genes Total Sensitivity Specificity
PoissonC
13 50 38.2% 26.0%
1 7 2.9% 14.3%
5 42 14.7% 11.9%
3 68 8.8% 4.4%
3 90 8.8% 3.3%
PearsonC
12 86 35.3% 14.0%
3 52 8.8% 5.8%
3 55 8.8% 5.5%
3 75 8.8% 4.0%
3 81 8.8% 3.7%
Eucli
2 13 5.9% 15.4%
7 77 20.6% 9.1%
12 206 35.3% 5.8%
1 22 2.9% 4.5%
4 142 11.8% 2.8%
Eucli on normalized data
10 48 29.4% 20.8%
5 53 14.7% 9.4%
7 77 20.6% 9.1%
2 24 5.9% 8.3%
2 47 5.9% 4.3%
The numbers in the first column are the numbers of cell-specific genes in a cluster; total, the total number of cluster members; sensitivity, the number of cell-specific genes/34; specificity, the number of cell-specific genes/total number of cluster members. The top five clusters that contain the 34 cell-specific genes are listed. The numbers in bold are the highest percentage in sensitivity and specificity in that method. See Additional data file 2 for more details.
t T
i t
=
∑
1λ( )=1L f m t i t i
Y ti
( , | ) ( | , ,..., ) exp( ( ) )( ( ) )
(
λλ θθ Y ∝ Y ,...,Y1 m λλθ θ = −
λ θ λ θ
1
))
( )! Y ti t
T i
m
= =∏
∏ ( )
1 1
1
θi i λ θ
t i i
m
i i
m i i
m
i t
Y t t Y t Y t Y t
l=
∑
=∑
∑
l=∑
= = =
( ), and ( ) ( ) ( ) ( )
1 1 1
∑
i=∑
∑
( )
m
1
For a set of tags assumed to be in the same cluster, we then
can estimate the cluster model λand the total count θfor each
tag by formula (2). It is natural to use the joint likelihood
to evaluate how well the observed counts
Y1,...,Ym fit the expected Poisson models. The larger the like-lihood is, the more likely that the observed counts are
gener-ated from the expected model. Then the tags 1, 2, ..., m share
the same pattern of expression. We can also use the chi-square test statistic to evaluate how well the observed tag count fits the estimated cluster model, which is to calculate
.
The larger the value of S, the less likely that the tags within a cluster share the same pattern of expression. Using the chi-square test statistic, the penalty for deviation from a large expected count is smaller than that for a small expected count. This is consistent with the Poisson probability function
, which has the property of mean = variance.
PoissonC/PoissonL algorithm
The K-means cluster algorithm [23] generates good clusters
by specifying a desired number of clusters, say, K, and then
assigning each object to one of the K clusters in such a way as
to minimize a measure of dispersion within clusters. In this work, we modified the K-means clustering algorithm by using the chi-square statistic or the joint likelihood as distance/ similarity measures instead of using the Pearson correlation, Euclidean distance or other distances. The PoissonC/Pois-sonL algorithm is sketched below:
1. All SAGE tags are assigned at random to K sets. Estimate θj
for each tag by formula (2).
2. Set cluster centers λk(0) from formula (2). If tag j belongs to
cluster k, Yj is expected to be generated from joint Poisson
distribution with mean λk(0) θ
j, the expected counts of tag j.
Current iteration i = 0.
3. In the ith iteration, assign each tag j to the cluster with the
best fit model.
(a) When the chi-square statistic is used, tag j is assigned to
the cluster with minimum
.
(b) When joint likelihood is used, tag j is assigned to the
clus-ter with minimum
.
4. Set new cluster centers λk(i + 1).
5. Go to step 3 until convergence.
In total, if c(j) denotes the cluster number that tag j is
assigned to, the PoissonC or PoissonL algorithm is to mini-mize the within-cluster dispersion
or
,
respectively.
[image:8.612.57.556.122.208.2]When data are Poisson distributed, PoissonL is expected to perform better than PoissonC. Experimental SAGE data anal-ysis confirms that PoissonL was slightly better than PoissonC. However, PoissonL is too slow to apply to large datasets. Table 4
Comparison of algorithms on 143 tags
Algorithm Number of tags in incorrect clusters Percentage of tags in incorrect clusters
PoissonL 4 2.8
PoissonC 6 4.2
Eucli on normalized data 14 9.8
PearsonC NA NA
Eucli NA NA
Clusters generated by PearsonC and Eucli were too messy.
f(Y ,...,Y1 m| , )λλ θθl
S = ( ( )Y ti ( ) ) ( ( ) )t i t i
t i
−
∑
∑
λ θ l 2 λ θ lf(Y ,...,Y1 m| , )λλ θθl
Sj k Y tj ki t j ki t j
t
, =
∑
( ( )−λn( )( ) )θl 2 (λn( )( ) )θlLj k, = −logf(Yj|λλ θθl k, j)
Sj c j
j , ( )
∑
Lj c j
j , ( )
comm
en
t
re
v
ie
w
s
re
ports
refer
e
e
d
re
sear
ch
de
p
o
si
te
d r
e
se
a
rch
interacti
o
ns
inf
o
rmation
Implementation
The algorithms are implemented in both C++ and Java. The routines for the EM algorithm for reassigning cluster mem-bers are from the work of Michiel de Hoon and colleagues at the Human Genome Center at the University of Tokyo. The algorithm described here is available from [14].
Additional data files
The following additional files are available with the online version of this article: Further details for Figure 2 and Table 2 and a list of 28, 67, 12, and 17 members of the photoreceptor clusters generated by PoissonC, PearsonC, Eucli, and Eucli on normalized data, respectively (Additional data file 1); addi-tional data for Table 3 and a list of the 34 'cell-specific' mouse SAGE tags (Additional data file 2).
Additional data file 1
Further details for Figure 2 and Table 2 and a list of 28, 67, 12, and 17 members of the photoreceptor clusters generated by PoissonC, PearsonC, Eucli, and Eucli on normalized data, respectively Further details for Figure 2 and Table 2 and a list of 28, 67, 12, and 17 members of the photoreceptor clusters generated by PoissonC, PearsonC, Eucli, and Eucli on normalized data, respectively Click here for additional data file
Additional data file 2
Additional data for Table 3 and a list of the 34 'cell-specific' mouse SAGE tags
Additional data for Table 3 and a list of the 34 'cell-specific' mouse SAGE tags
Click here for additional data file
Acknowledgements
We thank members of the Department of Research Computing at Dana-Faber Cancer Institute and Feng X. Zhao for converting the C++ version of the algorithm to a Java program. S.B. was a Howard Hughes Medical Insti-tute Fellow of the Life Sciences Research Foundation. This research was supported by NSF grant GMS-0204674, NIH grant R01 HG02518-01 to J.S.L; the Howard Hughes Medical Institute, NIH grant EY08064, the Foun-dation for Retinal Research to C.L.C.; and NIH grant P20 CA96470 to W.H.W.
References
1. Blackshaw S, Fraioli RE, Furukawa T, Cepko CL: Comprehensive analysis of photoreceptor gene expression and the identifica-tion of candidate retinal disease genes.Cell 2001, 107:579-589. 2. Zhang L, Zhou W, Velculescu VE, Kern SE, Hruban RH, Hamilton SR, Vogelstein B, Kinzler KW: Gene expression profiles in normal and cancer cells.Science 1997, 276:1268-1272.
3. Velculescu VE, Zhang L, Vogelstein B, Kinzler KW: Serial analysis of gene expression.Science 1995, 270:484-487.
4. Buckhaults P, Zhang Z, Chen YC, Wang TL, St Croix B, Saha S, Bardelli A, Morin PJ, Polyak K, Hruban RH, et al.: Identifying tumor origin using a gene expression-based classification map. Can-cer Res 2003, 63:4144-4149.
5. Porter D, Weremowicz S, Chin K, Seth P, Keshaviah A, Lahti-Domen-ici J, Bae YK, Monitto CL, Merlos-Suarez A, Chan J, et al.: A neural survival factor is a candidate oncogene in breast cancer.Proc Natl Acad Sci USA 2003, 100:10931-10936.
6. Margulies EH, Innis JW: eSAGE: managing and analysing data generated with serial analysis of gene expression (SAGE). Bioinformatics 2000, 16:650-651.
7. van Ruissen F, Jansen BJ, de Jongh GJ, van Vlijmen-Willems IM, Schalk-wijk J: Differential gene expression in premalignant human epidermis revealed by cluster analysis of serial analysis of gene expression (SAGE) libraries.FASEB J 2002, 16:246-248. 8. Audic S, Claverie JM: The significance of digital gene expression
profiles.Genome Res 1997, 7:986-995.
9. Madden SL, Galella EA, Zhu J, Bertelsen AH, Beaudry GA: SAGE transcript profiles for p53-dependent growth regulation. Oncogene 1997, 15:1079-1085.
10. Man MZ, Wang X, Wang Y: POWER_SAGE: comparing statis-tical tests for SAGE experiments. Bioinformatics 2000, 16:953-959.
11. Blackshaw S, Kuo WP, Park PJ, Tsujikawa M, Gunnersen JM, Scott HS, Boon WM, Tan SS, Cepko CL: MicroSAGE is highly representa-tive and reproducible but reveals major differences in gene expression among samples obtained from similar tissues. Genome Biol 2003, 4:R17.
12. Quackenbush J: Computational analysis of microarray data. Nat Rev Genet 2001, 2:418-427.
13. Tavazoie S, Hughes JD, Campbell MJ, Cho RJ, Church GM:
System-atic determination of genetic network architecture.Nat Genet 1999, 22:281-285.
14. SAGE data analysis using a Poisson approach [http:// genome.dfci.harvard.edu/sager]
15. Eisen MB, Spellman PT, Brown PO, Botstein D: Cluster analysis and display of genome-wide expression patterns. Proc Natl Acad Sci USA 1998, 95:14863-14868.
16. Wen X, Fuhrman S, Michaels GS, Carr DB, Smith S, Barker JL, Som-ogyi R: Large-scale temporal gene expression mapping of central nervous system development.Proc Natl Acad Sci USA 1998, 95:334-339.
17. Tamayo P, Slonim D, Mesirov J, Zhu Q, Kitareewan S, Dmitrovsky E, Lander ES, Golub TR: Interpreting patterns of gene expression with self-organizing maps: methods and application to hematopoietic differentiation. Proc Natl Acad Sci USA 1999, 96:2907-2912.
18. Li C, Wong WH: Model-based analysis of oligonucleotide arrays: expression index computation and outlier detection. Proc Natl Acad Sci USA 2001, 98:31-36.
19. Ramoni MF, Sebastiani P, Kohane IS: Cluster analysis of gene expression dynamics.Proc Natl Acad Sci USA 2002, 99:9121-9126. 20. Fraley C, Raftery AE: How many clusters? which cluster
method? answers via model-based cluster analysis.Computer J 1998, 41:578-588.
21. Blackshaw S, Harpavat S, Trimarchi J, Cai L, Huang H, Kuo WP, Fraioli RE, Cho S-H, Yung R, Asch E, et al.: Genomic analysis of mouse retinal development.PLoS Biol 2004 in press.
22. SAGEmap [http://www.ncbi.nlm.nih.gov/SAGE]
23. Hartigan J: Clustering Algorithms New York and London: Wiley; 1975. 24. Tseng GC, Wong WH: A resampling method for tight cluster-ing: with an application to microarray analysis.Biometrics 2004 in press.
25. Brenner S, Johnson M, Bridgham J, Golda G, Lloyd DH, Johnson D, Luo S, McCurdy S, Foy M, Ewan M, et al.: Gene expression analysis by massively parallel signature sequencing (MPSS) on microbead arrays.Nat Biotechnol 2000, 18:630-634.