C o m p r e s s e d n a t u r a l g a s : g a s
d i s t ri b u tio n o p ti o n fo r S u
b-S a h a r a n We s t Afric a
E n yi, GC, Wel e k w e , D a n d Ap p a h , D
T i t l e C o m p r e s s e d n a t u r a l g a s : g a s d i s t ri b u ti o n o p tio n fo r S u b-S a h a r a n We s t Afric a
A u t h o r s E n yi, GC, Wel e k w e , D a n d Ap p a h , D
Typ e Ar ticl e
U RL T hi s v e r si o n is a v ail a bl e a t :
h t t p :// u sir. s alfo r d . a c . u k /i d/ e p ri n t/ 4 7 9 0 4 / P u b l i s h e d D a t e 2 0 1 8
U S IR is a d i gi t al c oll e c ti o n of t h e r e s e a r c h o u t p u t of t h e U n iv e r si ty of S alfo r d . W h e r e c o p y ri g h t p e r m i t s , f ull t e x t m a t e r i al h el d i n t h e r e p o si t o r y is m a d e f r e ely a v ail a bl e o nli n e a n d c a n b e r e a d , d o w nl o a d e d a n d c o pi e d fo r n o
n-c o m m e r n-ci al p r iv a t e s t u d y o r r e s e a r n-c h p u r p o s e s . Pl e a s e n-c h e n-c k t h e m a n u s n-c ri p t fo r a n y f u r t h e r c o p y ri g h t r e s t r i c ti o n s .
Compressed Natural Gas: Gas Distribution Option for Sub-Saharan West
Africa
Chimagwu G Enyi a *, David Welekwe a, Dulu Appah b a Petroleum and Gas Engineering Division, University of Salford, UK.
b Institute of Petroleum Studies, University of Port Harcourt, Nigeria
Abstract: Natural gas production in Sub-Saharan West African is projected to grow annually by 5% from 2010 to 2040. The distribution of this gas is vital to economic growth in the sub region. Compressed Natural Gas (CNG) which is natural gas that has been compressed under high pressure and held in hard containers is proposed as an alternative method of natural gas distribution option for the sub-region to pipeline and LNG options especially for short distances within marine environments. The economic prospects of marine distribution of CNG within the West African region was studied and compared to the present West African Gas Pipeline (WAGP) distribution option. A discounted cash flow model was used to compare the economic viability of both projects. The CNG project had higher net present value of $1914 compared to $695 for the WAGP project. Payback period of 4.7 years and 11 years were respectively obtained for the CNG and WAGP projects.
Based on these economic indicators, it could be concluded that the CNG project surpassed the economic performance of the WAGP project. Results from this work could be applied in the study of CNG marine distribution for similar geographical locations around the world.
Keywords: Compressed Natural Gas, Gas distribution option, Economic analysis
Corresponding author
1 Introduction
Natural gas shares 23% of world primary energy consumption [1-4]. According to the report of BP Energy Economics, projection of the future energy demands shows that natural gas is the fastest growing primary energy source in the future and its consumption is forecast to be doubled between 2020 and 2040 [5]. Sub-Saharan Africa has 221.6 trillion cubic feet (TCF) of proved natural gas reserves and produces an average of 1.69 trillion cubic feet yearly. Out of the produced amount 1.22 trillion cubic feet of gas was exported via pipeline and liquefied natural gas (LNG) and the rest are flared [4],[6].
Natural gas production in sub-Saharan African is projected to grow at an annual average rate of around 5% from 2010 to 2040 with West Africa projected to dominate natural gas production in the sub-Saharan African. The IEA report shows that natural gas contributed to 9% of total electricity generation by fuel in 2012 as shown in Figure 1(a). Gas consumption in the sub-region is projected to increase to 25% in 2040. This will account for 81% of natural gas growth in the region from 2012 to 2040 as shown in Figure 1(b) [4].
i. An additional $450 billion in power sector investment: reducing power outages by half and achieving universal electricity access in urban areas.
ii. Deeper regional co-operation and integration: facilitating new large scale generation and transmission projects and enabling a further expansion in cross-border trade.
iii. Better management of energy resources and revenues: adopting robust and transparent processes that allow for more effective use of oil and gas revenues.
As well as boosting economic growth, these actions will result in the development of more oil and gas projects in the sub region to sustain her energy need.
[image:3.595.84.465.348.578.2]The West African Gas pipeline (WAGP) which transports natural gas from Escravos region of Niger Delta area in Nigeria to Benin, Togo and Ghana is the first regional natural gas transmission system in sub-Saharan Africa and it is the only gas transmission pipeline that is in the sub-region. The pipeline is unable to deliver the much needed natural gas to customers for power generation and other industrial use [7]. Ghana is the major customer with over 80% of her natural gas supplied by the pipeline. The initial contracted volume was 123 million standard cubic feet per day (MMscfd), but the average gas delivered to Ghana from Nigeria by the pipeline stands at 62 MMscfd [8].
Figure 1: Electricity generation by fuel in sub-Saharan Africa with projections to 2040
The introduction of marine transportation of compressed natural gas in the West Africa sub-region would increase access to modern forms of energy and also unlock faster economic and social development in sub-Saharan West African [9-30]. Compressed natural gas remains in its gaseous state but the volume reduction is at high pressures. This high pressure gas is then stored in vessels that have been designed to withstand such high pressures of 200 – 248 bar.
Marine transportation of natural gas using CNG technology has been a long standing proposition, but has yet to commercially materialise for a number of reasons. The most important is risk aversion, as even a very small marine CNG project would require significant
investment and would require that all the parameters for success such as natural gas source, CNG ships, natural gas delivery site and a fairly long contract should be in place [31].
Studies carried out by Wagner and Wagensveld [16], Nikolaou et al [18] and Economides et al
[25] show that CNG is better distribution option and proven to be more economically attractive than LNG for marine transportation of natural gas over short distances of less than 3500 nautical miles and large capacity of 50 – 500 MMscfd.
Unlike LNG technology, shipping accounts for about 89% of capital costs allocation for CNG projects, while compression/loading and offloading accounts for about 5% and 6% respectively [25]
The compressed natural gas marine transportation chain includes the following basic steps [30], [31].
i. The loading operation which involves storing natural gas into the carrier vessels at
optimal temperatures and pressures
ii. The transportation of the natural gas from the loading facility to the receiving facility by
sea
iii. The offloading operation in the receiving facility at the determined rates
iv. The sailing back of the vessel to the loading facility
2 Prospect of Marine CNG in Sub-Saharan Africa
Sub-Saharan Africa has the potential to utilize the potential of CNG marine technology since it has the natural gas resources, the marine transport routes, and an ever increasing demand for energy. There have been several studies involving the various CNG marine technologies available and their capacity to deliver on promises [25-29], [31-32]. These took into consideration several factors such maximum attainable distance, the vessel capacity, safety and the economic implication. A comparative study of sea-going natural gas transport technologies which include LNG and CNG was carried out by Economides et al [25]. By comparing the net present values of pipelines, CNG and LNG, they observed that pipelines and CNG technologies are best suited to shorter distance gas transport projects, and LNG is best suited to long distances [25] [31].
Economides et al [25] considered compressed natural gas as an alternative to liquefied natural gas. They concluded that for CNG marine transportation has a better transportation tariff (between $0.9 per MMBtu – $2.23 per MMBtu) compared to that of LNG ($1.5 per MMBtu to $2.5 per MMBtu) depending on the distance. However, above 2500 miles the cost of CNG transportation becomes significantly higher because of the disparity in volumes of natural gas transported [21].
plans of building new pipelines and expanding existing ones and same goes for LNG trains in the region. Hence there is the need for this study.
3 Compressed Natural Gas Transport Model
The CNG marine transport model consists of compressed natural gas shuttle ships that will be used to transport the gas from feed terminal in Nigeria to the supply terminal in Ghana. This model covers same distance as the pipeline (421 miles or 678 km) and has a capacity of 350 MMscfd. For the purpose of this analysis, a Coselle CNG ship was used and an appropriate ship capacity was selected from a range of different ship sizes. Table 1 shows a range of Coselle CNG ship sizes and their net capacity [12], [29].
Nikolaou [31] has suggested that small rather than large ships offer better economics in terms of smaller fixed and operating costs; this study will consider the ship size that will deliver the same quantity of natural gas as the pipeline to the end user.
Table 1: Coselle CNG ship sizes
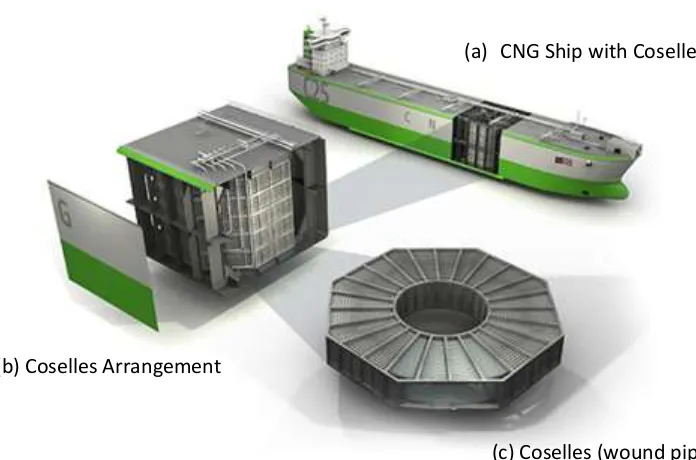
From the available ship sizes and their corresponding capacities, the C84 ship was selected as it closely matches the CNG project specifications. Figure 2(a) shows the layout of the Coselle CNG ship. Figures 2(b) and 2(c) show different types of coselle arrangement. A Coselle consists of several kilometres of small diameter high pressure pipe (tubing) coiled into a carousel on a spindle which is then fitted into the ship. A typical CNG distribution cycle is described as follows [29].
1 The ship will arrive at the loading facility with an average cargo pressure of 16 barg
(231 psig) and an average temperature of -11oC (12 F). The ship is then moored and
connected to the loading facility.
2 The ship is loaded with gas from the loading facility to a capacity of 337 MMscfd.
The average temperature and pressure of the gas at the end of loading is 36oC (96.2
F) and 276 barg (4000 psig). The total filling time for the ship is 15 hours. For a
round trip, the C84 ship consumes 4 MMscf for ship fuel, hence delivers 333MMscf
of gas to the receiving facility.
3 The ship disconnects from the loading facility and is ready to depart. The time for
mooring and disconnection is estimated to be 6 hours per cycle.
4 The ship sails to the receiving facility at an average speed of 16 knots (30 km/h or
18.5 mph) which takes approximately 23 hours.
Ship Size C20 C25 C30 C36 C42 C49 C84 C112 C128
Coselles 20 25 30 36 42 49 84 112 128
Net capacity (MMscf) 83 104 125 149 174 203 349 465 531
Length (m) 137 160 160 180 201 201 234 257 278
Breadth (m) 23.5 23.5 28.5 28.5 29.5 31.0 46.0 46.0 48.0
5 The ship docks at the jetty on the receiving facility and discharges the compressed
gas at an average rate of 314 MMscfd which takes approximately 25.5 hours. To
ensure a continuous supply of gas to the receiving facility, there is an overlap period
between two offloading ships. The receiving facility is configured in a way that
there is no interruption of gas discharge.
6 The ship then sails from the receiving facility with an average cargo pressure of
17.2 barg (250 psig) and arrives the loading facility with a cargo pressure of 16 barg
(231 psig). The pressure reduction is due to the ship’s fuel consumption on the
[image:6.595.125.473.264.494.2]return trip.
Figure 2: Sea NG coselle CNG ship and coselle arrangement
The total fuel consumption for a round trip is 4 MMscfd for ship fuel and 1 MMscfd for the scavenging compressor, a total of 5 MMscfd this represents 1.5% of the capacity of the ship.
For a C84 ship, the total cycle time is 92.5 hours made up of:
i. 15 hours of loading
ii. 23 hours of sailing to the receiving terminal
iii. 3 hours of mooring and connecting
iv. 25.5 hours of discharging
v. 23 hours of sailing back to the loading facility
vi. 3 hours of mooring and connecting
(c) Coselles (wound pipes) (b) Coselles Arrangement
With 4 ships, a delivery rate of 339 MMscfd to the receiving facility can be achieved, but for a robust design, 5 ships were used for the economic model.
4 Economic Evaluation
For the purpose of economic evaluation, the time value of money was considered. This mean both the capital, operation and maintenance costs will be worth more at a future date. As a result, these costs are brought to their present worth using the formula [33]
𝐹𝑛 = 𝑃(1 + 𝑖)𝑛 (1)
Where
𝐹𝑛 = the future value of the principal ($)
P = the present value ($)
n = project life (yr) and
i = interest rate (%).
The interest rate for this report was given as 10% and for the sake of comparison; the project life for both the pipeline and the compressed natural gas marine transportation model is 20 years. If the inflation rate (fr) of 10% is considered in the economic evaluation, Equation 1
becomes:
𝐹𝑛 = 𝑃(1 + 𝑖 + 𝑓𝑟)𝑛 (2)
4.1 The West African Gas Pipeline
For the pipeline base case scenario, it will be assumed that pipeline is operating at an optimistic value of 75% of its proposed full compression capacity, which is a capacity of 350MMscfd. For the sake of comparative study and analysis, this capacity will be used for the compressed natural gas transportation model. Since over 80 % of the gas supply is to Ghana, it was assumed that Ghana is the commercially viable customer.
The capital cost of the pipeline was $1,200 million in 2007. Bringing the capital cost of the pipeline to its present worth, with an average interest rate of 10% value gives a capital cost of $2,572 million.
The operation and maintenance cost of the pipeline is assumed to 5% of the capital cost per year. This gives a value of $128.6 million per year or $1.07/MMbtu.
4.2 The CNG Model
i. Five C84 ships was used in this model. Each of the ships costs $210 million which
gives a total of $1,050 million. Bringing this cost to the present value gives a present
cost for the five ships as $1,400 million.
ii. At the loading facility, a 48,000 HP compression power is required (assuming an 800
psig suction and a 33% sparing). An estimated value of the compression station $170
million with a present value of $230 million.
The operating and maintenance cost were estimated to be $6.1 million per year per ship. For the five ships, the total operation and maintenance cost is $30.5 million which has a present value of $40.6 million per year. An estimate of $45 million per year ($0.41/MMbtu) was used.
4.3 Natural Gas Price
The feed gas price was taken as $2.5/MMbtu from the supplier and the sales price of the gas in destination is $8.5/MMbtu [8]
Other parameters used in this economic evaluation are:
i. Inflation rate as 10%
ii. Tax rate as 35%
iii. Capacity utilization factor as 90%
iv. Cost of capital as 10 %
v. Heating value = 1000 Btu/SCF
vi. No of working days = 350 days/yr
vii. Project Life = 20 years
5 Economic Model of the Projects
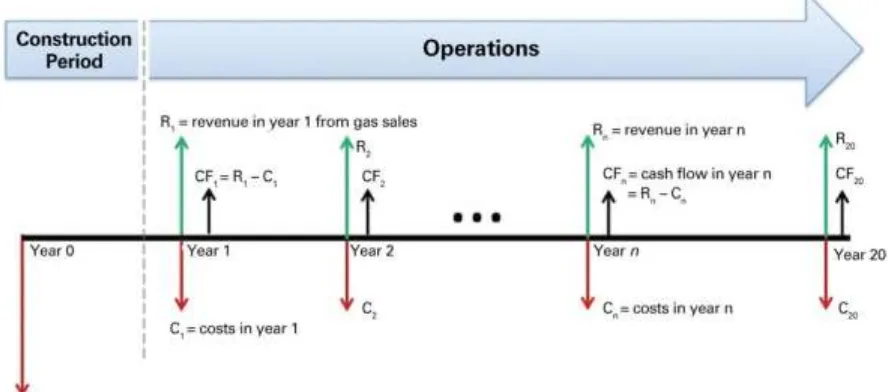
The economic model used was the discounted cash flow model (DCF model). The method involves forecasting the future cash flows, choosing the appropriate cost of capital (discount rate), inflation rate and finding the present value of the expected net cash flows. This model evaluates the financial performance of pipeline system as well as the CNG model. This work assumes a project life of 20 years. The DCF model accounts for the cash flows during the life of a project and discounts them in order to evaluate the project’s net present value (NPV). Figure 3 illustrates the cash flow for a project over a period of time. The project net present value is calculated using the discounted cash flow formula expressed as:
𝑁𝑃𝑉 = 𝐶𝐹1
(1+𝑑+𝑓𝑟)1+ 𝐶𝐹2
(1+𝑑+𝑓𝑟)2+ ⋯ +
𝐶𝐹𝑛
(1+𝑑+𝑓𝑟)𝑛 (3)
Where
𝐶𝐹 = the net cash flow in the year of evaluation ($), n = project life (yr)
Figure 3: Project cash flows
In the project, the revenue is gotten from gas sales while the cost include the capital investment, operation and maintenance costs, tax payment and feed gas costs. In the DCF model, capital costs are incurred in year 0 and revenue from gas sales begins in year 1.
5.1 Input Parameters for the Pipeline and CNG Projects
[image:9.595.76.520.65.261.2]Table 2 shows the different inputs and values for the WAGP and CNG projects. These values present the base case values for the purpose of economic analysis.
Table 2: Input parameters for the economic analysis
Input Parameters
Unit WAGP Project CNG Project
Project Life Years 20 20
Capacity MMscfd 337 337
CAPEX $ (million) 2,572 1,630
O & M Cost $/MMBtu 1.07 0.41
Utilisation Rate % 90 90
Feed Gas Cost $/MMBtu 2.5 2.5
Gas Sales Price $/MMBtu 8.5 8.5
Tax Rate % 35 35
Inflation % 10 10
Cost of Capital % 10 10
5.2 Economic Analyses of the Pipeline and CNG Projects
inflation rates of 10% each for both projects. A plot of the cumulative discounted cash flow against time gives the payback period for the projects as shown in Figure 4.
Table 3: Pipeline and CNG discounted and cumulative cash flow
Year WAGP Discounted CashFlow ($ Million) WAGP Cumulative DCF ($ Million) CNG Discounted CashFlow ($ Million) CNG Cumulative DCF ($ Million)
0 -2,572.00 -2,572.00 - 1,630.00 -1,630.00
1 376.62 -2,195.38 396.03 -1,233.97
2 337.26 -1,858.12 356.78 -877.18
3 302.36 -1,555.76 321.67 -555.52
4 271.38 -1,284.38 290.21 -265.31
5 243.81 -1,040.56 261.99 -3.32
6 219.26 -821.31 236.66 233.34
7 197.35 -623.95 213.89 447.23
8 177.78 -446.18 193.41 640.64
9 160.27 -285.91 174.97 815.62
10 144.58 -141.33 158.36 973.98
11 130.52 -10.81 143.38 1,117.36
12 117.89 107.08 129.86 1,247.22
13 100.25 207.33 113.67 1,360.89
14 91.14 298.46 103.34 1,464.23
15 82.85 381.31 93.94 1,558.17
16 75.32 456.63 85.40 1,643.57
17 68.47 525.10 77.64 1,721.21
18 62.25 587.35 70.58 1,791.79
19 56.59 643.94 64.16 1,855.95
20 51.44 695.38 58.33 1,914.28
5.3 Project Risk Analysis
The risk analysis considered in this work takes into consideration the probabilities of success or failure of a project, which was done by simulating different project scenarios in ten thousand trials using Crystal Ball software which relies on developing mathematical model in Excel that represents our situation of interest [33]. The simulation reports are in Appendices A and B.
The various project components were varied and grouped into three categories: the base case, the pessimistic and the optimistic values. The pessimistic and optimistic values were derived from the base case by choosing a value above and/or below the base case values. For this project, 80% and 120% of the base case values were used for the pessimistic and optimistic values respectively. While 90% and 110 % was used for the plant utilization rate. These pessimistic and optimistic values with their respective net present values are presented in Tables 4 and 5 for the pipeline and CNG projects respectively. Both Tables 4 and 5 also show the spreadsheet models in PipelineNPV.xls and CNGNPV.xls for both projects. The inputs to be varied and their base-case values are in cells A4:D12. The model represented in cells A14:C35 is the cumulative cash flow for each of the projects.
Table 5: CNG NPV.xls
distribution because it describes natural phenomena such as sales revenue and rate of return on investment. The forecast distributions for the NPV are shown in Fig 6 and Fig 7 for the pipeline and CNG respectively. The certainty of 44.73% for the range from 695 to infinity is the Crystal Ball estimate of the probability of positive NPV for pipeline project while for the CNG project, the certainty of 50.82% for the range from 1914 to infinity was observed.
The effects of the input variables on NPV of the two projects were analysed and they are represented in Figures 8 and 9 from top to bottom in decreasing order of their impact on the NPV. The Figures show that most of the variation in NPV arises from the gas price at destination and the cost of capital. The model shows that NPV can be increased by increasing the gas price at destination.
6 Results and Discussion
The results from the discounted cash flow model for both projects for a period of 20 years were compared and sensitivity analyses were carried out to determine the percentage contribution of each parameter to the overall project net present value, and the break-even gas price.
6.1 Payback Period
[image:12.595.131.474.421.684.2]From Figure 4, the payback periods for the pipeline and CNG projects are 11 years and 4.7 years respectively. The CNG project showed better alternative to pipeline project. The difference in payback is due to the huge capital investment and high operation and maintenance costs for the pipeline project compared to the CNG project.
6.2 Net Present Value of the Projects
The net present value for the pipeline project for the base case scenario was obtained as $695 million for the duration of the project while that of the CNG is $1,914 million. Hence on the basis of net present value, the CNG project is a better project compared to the pipeline project as shown in Table 3.
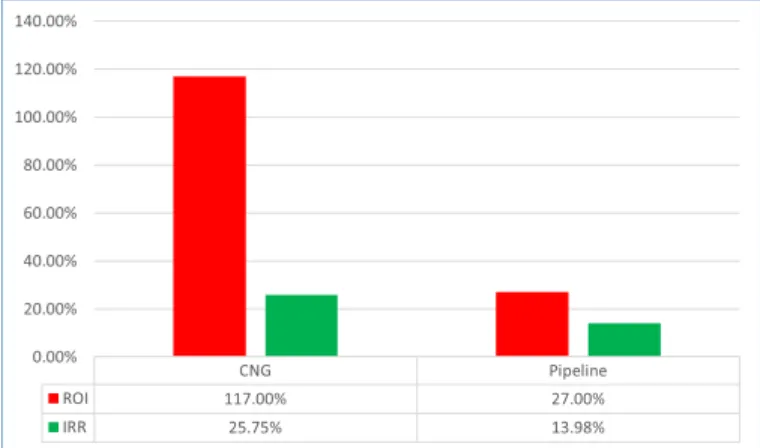
6.3 Return on Investment (ROI) and Internal Rate of Return (IRR)
[image:13.595.110.490.295.519.2]The return on investment for the pipeline project was derived as 27% as compared to that of the CNG project which was derived as 117%. On the other hand, the internal rate of return for the pipeline and the CNG projects were derived as 13.98% and 25.75% respectively. The higher the return on investment (or the profitability index), the more profitable the project will be and the higher the internal rate of return, the better the project [33]. Therefore it is a clear indication that the CNG project is the preferable project on both bases. Figure 5 gives a summary of these economic markers.
Figure 5: ROI and IRR of both Investments
6.4 Project Risk Analysis
[image:14.595.73.479.379.638.2]
Figure 6: Probability of success of the pipeline project (at least base case)
Figure 7: Probability of success of the CNG project (at least base case)
Figure 8: Pipeline sensitivity rank correlation
Figure 9: CNG sensitivity rank correlation
7 Conclusion
[image:15.595.117.486.371.629.2]WAPG project took a significantly longer period of 11 years. The CNG project also obtained a significantly higher net present value of $1914 compared to the WAGP project which had net present value of $695. The Return on Investment and the Internal Rate of Return of the CNG project was also remarkably better than that of the WAGP project. Therefore based on these analyses it could be concluded that the CNG marine transportation project is a better alternative to the WAGP project. The CNG project did not just exhibit promising prospects, but surpasses the economic performance of the existing WAGP project by a wide margin.
Nomenclature
CNG compressed natural gas IRR internal rate of return LNG liquefied natural gas MMBtu million British thermal unit
MMscfd million standard cubic feet per day NPV net present value
psig pound per square inch gauge. ROI return on investment
TCF trillion cubic feet
WAGP West Africa gas pipeline
APPENDIX A: PIPELINE SENSITIVITY REPORT
Crystal Ball Report - Full
Simulation started on 2/2/2018 at 19:18:51
Simulation stopped on 2/2/2018 at 19:18:53 Run preferences:
Number of trials run 10,000
Extreme speed Monte Carlo Random seed
Precision control on
Confidence level 95.00%
Run statistics:
Total running time (sec) 1.07
Trials/second (average) 9,372
Random numbers per sec 74,977
Crystal Ball data:
Assumptions 8
Correlations 0
Correlated groups 0
Decision variables 0
Forecasts 1
Statistics: Forecast values
Trials 10,000
Mean 651
Median 639
Mode ---
Standard Deviation 424
Variance 179,880
Skewness 0.1324
Kurtosis 3.09
Coeff. of Variability 0.6520
Minimum (1,014)
Maximum 2,262
Range Width 3,276
Mean Std. Error 4
Forecast: Net Present Value (Pipeline) (cont'd)
Percentiles: Forecast values
0% (1,014)
10% 121
20% 292
30% 424
40% 535
50% 639
60% 744
70% 863
80% 1,007
90% 1,198
100% 2,262
APPENDIX B: CNG SENSITIVITY REPORT
Crystal Ball Report - Full
Simulation started on 2/2/2018 at 21:44:27
Simulation stopped on 2/2/2018 at 21:44:32 Run preferences:
Number of trials run 10,000
Extreme speed Monte Carlo Random seed
Precision control on
Confidence level 95.00%
Run statistics:
Total running time (sec) 1.35
Trials/second (average) 7,427
Random numbers per sec 59,413
Crystal Ball data:
Assumptions 8
Correlations 0
Correlated groups 0
Decision variables 0
Forecasts 1
Trials 10,000
Mean 1,931
Median 1,921
Mode ---
Standard
Deviation 410
Variance 167,920
Skewness 0.1405
Kurtosis 3.07
Coeff. of Variability 0.2122
Minimum 436
Maximum 3,631
Range Width 3,195
Mean Std. Error 4
Forecast: Net Present Value (CNG) (cont'd)
Percentiles: Forecast values
0% 436
10% 1,414
20% 1,585
30% 1,712
40% 1,817
50% 1,921
60% 2,029
70% 2,135
80% 2,268
90% 2,464
100% 3,631
References
[1] Economides. M.J and Wood D.A, “The state of natural gas” Journal of Natural Gas Science and Engineering, vol. 1, issues 1-2, pp. 1-13, 2009.
[2] BP Energy Economics, “BP Energy Outlook Country and regional insights –Africa” Internal Report, BP Statistical Review of World Energy and the BP Energy Outlook, London, UK, 2018. {https://www.bp.com/content/dam/bp/en/corporate/pdf/energy-economics/energy-outlook/bp-energy-outlook-2018-region-insight-africa.pdf} [Accessed on July 8, 2018].
[3] DNV GL Report, “Energy Transition Outlook - Oil and Gas Forecast to 2050”, DNV GL, 1363 Hovik, Norway, 2017. {https://eto.dnvgl.com/2017/oilgas} [Accessed July 10, 2018]
[4] IEA, “Africa Energy Outlook: A Focus on Energy Prospects in Sub-Saharan
Africa”, Internal Report, International Energy Agency, Paris, 2017.
[5] EIA, “Annual Energy Outlook 2017 with projections to 2050” US Energy Information Administration, 2017 {https://www.eia.gov/outlooks/aeo/pdf/0383(2017).pdf} [Accessed on July 15, 2018].
[6] Koso. I. I and Onwuachi-Iheagwara. P.N, “Optimizing Natural Gas Assets from Marginal Fields in Nigeria” Journal of Science and Multidisciplinary Research, vol. 5, No. 1, 2013.
[7] Raza. H.A, “The Role of Natural Gas in the Transport Sector for Sustainable Development” in International Symposium on Natural Gas and Sustainable Development, Doha, Qatar, February 6-8, 2006.
[8] Ghana Energy Commission, “2018 Energy (Supply and Demand) Outlook for Ghana”
Ghana Energy Commission, Accra, Ghana.
{http://www.energycom.gov.gh/planning/data-center/energy-outlook-for-ghana} [Accessed on July 8, 2018].
[9] Thomson. H, Corbett. J.J and Winebrake. J.J, “Natural Gas as a Marine Fuel” Energy
Policy, vol. 87, pp. 153-167, 2015.
[10] Capitta. G, Damiano. L, Laudani. S, Revetria. R and Morra. E, “Mechanical design of an
Innovative method for CNG Transporting over long distances: Logistics, Executive and Operative Aspects”, in Proc. of the International Multiconference of Engineers and Computer Scientists, vol. II, March 15-17, 2017.
[12] S and P Global Platts, “Marine CNG Transportation”, in 13th Annual Platts Caribbean Energy Conference, Atlantis, Paradise Island, The Bahamas, January 24 -25, 2013. {https://www.platts.com/IM.Platts.content/ProductServices/…/Lyndon_Ward}[Accesse d on July 10, 2018].
[13] Kirk. J.L, Bristow. A.L and Zanni. A.M, “Exploring the market for Compressed Natural Gas light commercial vehicles in the United Kingdom” Transportation Research Part D: Transport and Environment, vol. 29, pp. 22-31, 2014.
[14] Ramoo. R and Parthasarathy. M, “A new concept for CNG carriers and Floating CNG/Oil Processing and Storage Offshore Platforms” Internal Report, Altair Product Design Inc; Michigan, USA, 2011.
{http://citeseerx.ist.psu.edu/viewdoc/summary?doi=10.1.1.452.2789} [Accessed on July 11, 2018].
[15] The World Bank Group, “CNG for Commercialization of Small Volumes of Associated Gas” Working Paper, Washington, D.C. 2015.
{http://documents.worldbank.org/curated/en/727861474994769719/executive-summary} [Accessed on July 8, 2018].
[16] Wagner. J.V and Wagensveld. S.V, “Marine Transportation of Compressed Natural Gas a
viable alternative to Pipeline or LNG” in SPE Asia Pacific Oil and Gas Conference and Exhibition, Melbourne, Australia, October 8-10, 2002.
[17] Gwilliam. K.M, “The role of natural gas in the transportation sector” The World Bank, Washington DC; 2014.
{http://siteresources.worldbank.org/INTTRANSPORT/Resources/336291-1119275973157/td-ut8.pdf} [Accessed on July 9, 2018].
[18] Nikolaou. M, Wang. X and Economides. M.J, “Optimisation of Compressed Natural Gas Marine transportation with Composite Material Containers” in SPE Asia Pacific Oil and Gas Conference and Exhibition, Jakarta, Indonesia, October 22-24, 2013.
[19] Le Fevre. C, “The Prospects for Natural Gas as a Transport Fuel in Europe” OIES Paper No 84, Oxford Institute for Energy Studies, University of Oxford, UK, 2014. {https://www.oxfordenergy.org/wpcms/wp-content/uploads/2014/03/NG-84.pdf}
[Accessed on July 11, 2018].
[20] Van Puyvelde. D, “Natural gas as a transport fuel – the economic and environmental
[21] Marongiu-Porcu. M, Economides. M.J and Wang. X, “The Economics of Compressed Natural Gas Sea Transport” in SPE Russian Oil and Gas Technical Conference and Exhibition, Moscow, Russia, October 28-30, 2008.
[22] Gallagher. M, “The Future of Natural Gas as a Transportation Fuel” DOE EIA 2013 Energy Conference, Washington, DC; June 17, 2013.
[23] Apolinario I, Lisbon P and Ferreira L,” Efficient Pricing on Distribution Network Tariffs” in Proc. of the 9th International Conference on European Energy Market;
Florence, Italy. May 10–12, 2012.
[24] Sircar. A, Sahajpal. S and Yadav. K, “Challenges & Issues in Natural Gas Distribution Industry” Journal of Petroleum Engineering & Technology, vol. 7, Issue 2, 2017.
[25] Economides. M.J, Kai. S and Subero. G, “Compressed Natural Gas (CNG): An Alternative to Liquefied Natural Gas (LNG)” SPE Production and Operations, vol. 21, Issue 2, May 2006.
[26] Economides. M.J, Wang. X, Colafemmina. F and Tomaselli. V.N, “Upstream Stranded
Raw gas management as Compressed Natural Gas” in International Petroleum Technology Conference, Beijing, China, March 26-28, 2013.
[27] Global Energy Ventures, “Delivering Integrated CNG Projects – Acquisition of Sea NG
Corporation and Investor Update, Internal Reports, West Perth, Australia, 2017.
{https://gev.com/wp-content/uploads/2017/12/gev-completion-of-seang-acquisition-and-capital-raising-07-dec-17.pdf} [Accessed on July 8, 2018].
[28] Stenning. D, Ward. L, Trebble. M and Major. F, “Combine FLNG and CNG vessels to
exploit stranded gas reservoirs”, Gas Processing and LNG, Gulf Publishing Holdings LLC, Houston, Texas, USA, 2018.
29] Stenning. D and Cran. J.A, “The Coselle CNG Carrier: The Shipment of Natural Gas by
Sea in Compressed Form” in 16th World Petroleum Congress, Calgary, Alberta, Canada,
June 11-15, 2000.
[30] Cavazzoni. L, Cristofaro. R and Meninno. P, “How Gas Quality Affects the Compressed Natural Gas Delivery Chain” in Offshore Mediterranean Conference and Exhibition, Ravenna, Italy, March 20-22, 2013.
[31] Nikolaou. M, “Optimizing the Logistics of Compressed Natural Gas transportation by
marine vessels” Journal of Natural Gas Science and Engineering, vol. 2, issues 1, pp. 1-20, 2010.
[32] Stenning. D, Fitzpatrick. J and Trebble. M, “Floating CNG: A simpler way to monetize
offshore gas” Offshore Technology Conference, Houston, Texas, USA, April 30 - May 3, 2012.