International Journal of Emerging Technology and Advanced Engineering
Website: www.ijetae.com (ISSN 2250-2459, ISO 9001:2008 Certified Journal, Volume 9, Issue 9, September 2019)
19
Performance Modeling of Horizontal-shaft Rotary Palm Kernel
Cracking Machines
Engr. Amaechi O. Joseph
Department of Industrial Technology, Ignatius Ajuru University of Education, Port Harcourt, Rivers State, Nigeria Abstract - The performance modeling of horizontal-shaft
rotary palm kernel cracking machines were carried out to increase the machine’s cracking efficiency. The physical crop parameters that affect machine cracking performance were identified as: the type and size of nut, moisture content, shell thickness, nut particle density and bulk density. Similarly the Engineering parameters are feed rate, cracking shaft rotational speed, throughout capacity, and machine age were all investigated. The kernel species tested were the Dura, Tenera and mixture of Tenera and Dura. Buckingham Theorem in conjunction with dynamic and kinematic analysis of machines were employed to obtain the regression equation that were used for modeling the machine performance. It was discovered that the physical crop and engineering parameter such as type of nut, size of nut, moisture content, shell thickness, nut particle density, bulk density, federate, throughout capacity, machine age etc could affect the machine performance. An estimated regression model using multiple linear regression was developed thus: c = a1 + a21 + a32 +
a43 + a54 + a65 + a76 + a812 + a922 + a1032 + a1142 +
a1252 + a136-2+ a1413 + a1523 + a1633 + a1743 + a1853 + a196 -3
. The predicted and measured R2 = 82.1%. This shows that the regression model is highly adequate and could be used for modeling the performance of horizontal-shaft Rotary palm kernel cracking machines.
Keywords – Cracking Machines, Dura, Linear Regression Model, Parameters Tenera,
I. INTRODUCTION
A field study experiment was carried out at three different palm kernel cracking installations to understudy the performances of 27 machines. The parameters that affect the machine performance were classified into two viz (i) Crop physical properties and machine or Engineering properties (Ndukwu, 1998; Simonyan et al, 2006; Asoegwu et al, 2010). In all the following crop physical and engineering or machine properties were identified as feed rate, throughout capacity, shaft rotational speed, age of machine, type of nut, size of nut moisture content, nut hardness, shell thickness, nut particle density, bulk density etc. The output paraters includes the cracking efficiency, fully cracked nut, partially cracked nut, un cracked nut etc.
In all over 20 parameters that affect the performance of commercial palm kernel cracking machines were identified and only (12) twelve were measureable and selected for further experimental evaluation. The size and shape of palm nut are important in the modeling of commercial palm kernel cracking machines. According to Moshin (1978) as reported in Olakunle (2000), knowledge of physical and engineering properties constitutes important and essential engineering data which could help in the design of machines kernel cracking. Also Alkali and Guyan (1990) as reported in Olaoye (2000) that a rational approach of the design of agricultural or mechanical machinery equipment and facilities involves a theoretical analyses of the effects of the physical properties of agricultural products on the characteristics of machinery, facilities and operation. It is important to understand the engineering properties of materials in the analyses and sorting of crops during handling and separation and from undesirable materials.
Moisture content of palm kernel has been reported as having a greater influence in machine cracking performance. Accordingly, (Oluwole et al 2007), Ndukwu 1995, Gbadamosi, 2006; Faroogh et al 2008; Fathollahzadeh, 2008; Okunle 2011; and Feizolla, 2012), maintained that moisture content plays important role and has major influence on agro materials such as shelling and cracking. To reduce the possibility of cracking of kernel during cracking the nut, the nuts are subjected to heat treatment whereby its temperature is periodically increased to reduce the moisture content of the nut before cracking as the temperature increases, the moisture content of the nut before cracking.
Subsequently, as the temperature increase, the palm nut shell expands while the kernel contracts, creating sufficient clearance between kernel and shell. As a result of this, the kernel becomes loose from the shell and as the kernel shrinks, cracks are initiated on the shell due to thermal stress.
International Journal of Emerging Technology and Advanced Engineering
Website: www.ijetae.com (ISSN 2250-2459, ISO 9001:2008 Certified Journal, Volume 9, Issue 9, September 2019)
20
Similarly, Ezeoha (2012), Akubuo & Eje (2002) and Koya et al (2004), determined the bulk density and porosity that affect the structural load acting on the well storage structure and its effect on the performance of palm nut commercial cracking machines. They all maintained that bulk density affects the machine performance. Furthermore, nut hardness is the ability of a material to resist cracking, scratching or identation when external forces is applied, Gbadomonsi (2006). Accordingly, Ezeoha et al (2012) proposed on average hardness value ranges from 10.32 – 38kN/m2 which could affect the performance of commercial palm nut cracking machines.The palm kernel and palm nut size diameters were reviewed by several authors. The major diameter values from dura variety as reported by Ekwulugo (2001) is 1720mm
Koya et al (2004) 34.90mm, Mijintawa et al (2005) 15.90mm, Gbadamosi (2006) 13.90mm, Akubuo et al (2002) and Ezeoha et al (2012) 19.09mm etc. These authors maintained that the values of both the kernel and nut size diameter could affect the cracking machine performance.
II. MATERIALS AND METHODS
A field study of this research was conducted at three cracking mills and 9 machines in each mill yielding 27 observations. The machines were tested with kernel varieties of Dura, Tenera and mixture of Dura and Tenera. The nine machines in mill A were tested with Dura samples of 50,100 and 150kg.
Also, the nine machine in mill ‘B’ where tested with Tenera samples of 50,100 and 150kg while the other nine machines in mill ‘C’ were tested with mixture of Dura and Tenera. These samples were weighed on anderlet and sycorth weighing machines. The samples were feed into the Hopper for test run. To obtain a reliable value, a stop watch was provided for the ‘start and ‘stop’ operations. The quantities of broken, partially cracked, un cracked and fully cracked kernels were storted out and reweighed on the weighing balance. During the cracking operation, the feed rate, shaft rotational speeds, shaft impeller rim diameter, duration of cracking etc were recorded. The cracking efficiency, kernel breakage ratio and all other parameters was calculated using appropriate formulae as shown in this work. From the investigation, about 20 parameters that affect the performance of horizontal shaft rotary palm kernel machines were identified but only (12) twelve parameters were measurable. The measurable parameters include: shaft rotational speed, feed rate, shaft impeller rim diameter, moisture contents, bulk density, nut particle density, nut size, shall thickness, nut hardness through put capacity, cracking efficiency, kernel breakage ratio.
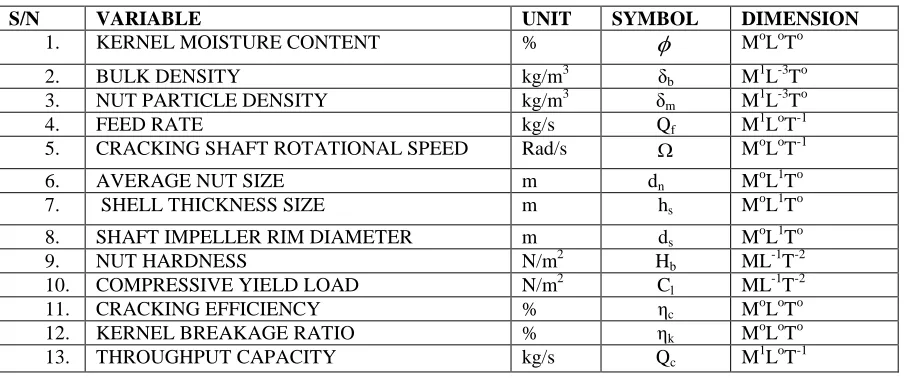
[image:2.612.82.534.507.696.2]In order to reduce the number of independent parameters to be employed for further analysis, the identified variables were subjected to dimensional analysis using Buckigham theorem as described in Murdock (1986). The table shows the parameters, units, symbols and dimension using Backingham theorem is indicated below and is used for further analysis.
TABLE I
VARIABLES, UNITS, SYMBOLS AND DIMENSIONS
S/N VARIABLE UNIT SYMBOL DIMENSION
1. KERNEL MOISTURE CONTENT %
MoLoTo2. BULK DENSITY kg/m3 δb M1L-3To
3. NUT PARTICLE DENSITY kg/m3 δm M1L-3To
4. FEED RATE kg/s Qf M1LoT-1
5. CRACKING SHAFT ROTATIONAL SPEED Rad/s MoLoT-1
6. AVERAGE NUT SIZE m dn M
o L1To
7. SHELL THICKNESS SIZE m hs M
o L1To
8. SHAFT IMPELLER RIM DIAMETER m ds MoL1To
9. NUT HARDNESS N/m2 Hb ML-1T-2
10. COMPRESSIVE YIELD LOAD N/m2 Cl ML-1T-2
11. CRACKING EFFICIENCY % ηc MoLoTo
12. KERNEL BREAKAGE RATIO % ηk MoLoTo
International Journal of Emerging Technology and Advanced Engineering
Website: www.ijetae.com (ISSN 2250-2459, ISO 9001:2008 Certified Journal, Volume 9, Issue 9, September 2019)
21
Buckingham π theorem, states that if there are ‘n’ variable in a problem and these variables contain ‘m’ primary dimensions (such as mass, length, and time in the present case), the number of dimensionless parameters required to describe the system is n-m. From the table, the number of dimensions appearing in the table are mass (M), length (L) and time (T), hence m = 3.Therefore the additional dimensionless groups required are 8 – 3 = 5. Therefore five (5) πs will be formed i.e. π1, π2, π3, π4, π5,
The number of dimensional variable remaining is therefore 11-3 = eight (8).
The variables
, ηc and ηk are dimensionless and excluded from the dimensionless terms determination as stated earlier and are added when other dimensionless terms are determined (Simonyan et al., 2006).Applying the methodology of Murdock (1986), the variables are grouped into three types namely: Geometric (e.g. shape). Kinematic (e.g. flow rate) and dynamic (e.g. feed rate).
Geometric Symbols Dimension i. Average nut size, dn L ii. Shell thickness size, hs L Kinematic
i. Cracking shaft speed, V LT-1
Dynamic
i. Bulk density, δb M1L-3
ii. Nut particle density, δm M1L-3 iii. Feed rate, Qf M
1 T-1 iv. Nut hardness, Hb M L-1T-2
v. Compressive yield load Cl ML-1T-2 Selecting the three basic or reoccurring variables as dn, V and δm. Thus, we now have the dimensionless variables as:
π1 = s
z m y x
n
V
h
d
1 1
1 (1)π2 = b
z m y x
n
V
d
2 2
2
(2)π3 = f
z m y x
n
V
Q
d
3 3
3 (3)π4 = b
z m y x
n
V
H
d
5 5
5 (4)π5 = l
z m y x
n
V
C
d
6 6
6 (5)π6 = ηc π7 =
π8 = ηkSubstituting the dimension of the repeating variables in equation (1) above, we have
Lx1(LT-1)y1 (ML-3)Z1 L = MoLoTo (6) M: Z1 = 0 (7)
T: -y1 = 0
y1 = 0 (8) L: X1 + 0 + 1 = 0 (9)
X1 = -1
dn -1
π1 = dn/hs (10)This may be called the nut size to shell thickness ratio Substituting the dimension of the quantities in equation (2) we have:
Lx2(LT-1)y2 (ML-3)Z2 ML-3 = MoLoTo (11)
π2 = δn/δb (12)This may be called the nut packing fraction
Substituting the value of the dimensions in equal (3) we have:
Lx3(LT-1)y3 (ML-3)z3 MT-1 = MoLoTo (13)
π3 = dn3 Vδm/Qf (14)This may be called the feed rate factor
Substituting the dimensions of the quantities in equation (4) above, we have
Lx4(LT-1)y4 (ML-3)Z4 ML-1T-2 = MoLoTo (15)
Π4 =
m bV
dn
H
22 (16)
This may be called the nut hardness factor
Substituting the dimensions of the quantities of equation (5) above, we have,
Lx5(LT-1)y5 (ML-3)Z5 ML-1T-2 = MoLoTo (17)
International Journal of Emerging Technology and Advanced Engineering
Website: www.ijetae.com (ISSN 2250-2459, ISO 9001:2008 Certified Journal, Volume 9, Issue 9, September 2019)
22
π5 = π5 = Hbπ4 Cl
π5 = π5 (18)
π4
This is equivalent to writing π45 = Hb Cl
This can be called compressive yield factor
III. REGRESSION MODEL FORMULATION A number of linear regression models were developed to relate the cracking efficiency with the five dimensionless parameters, 1; 2; 3; 4; 5. To simplify the presentation of these models, let
X1 = a1 + a21 + a32 + a43 + a54 + a65 + a76 (19)
X2 = b112 + b222 + b332 + b442 + b552 + b66-2 (20)
X3 = c112 + c222 + c342 + c452 + c56-2 (21) X4 = d113 + d223 + d333 + d443 + d553 + d66-3 (22)
X4b = d113 + d223 + d333 + d453 + d56-3 (23)
X5 = e1 + e21 + e32 + e43 + e54 + e65 + e76-1 (24)
X6 = (f11 + f22 + f33 + f44 + f55)= 6 (25)
X7 = 1(g12 + g23 + g34 + g45 + g66-1 ) (26)
X8 = 2(h13 + h24 + h35 + h46-1 ) (27)
X9 = 3(i14 + i25 + i36 -1
) (28)
X10 = j1 + j21 + j32 + j43 + j512 + j622 + j732 +1(j82 + j93) +
j102-3 (29)
Where the coefficients a, b, c, _ _ _ , j are to be determined by linear regression.
Then, the cracking efficiency c can be expressed by regression equations of the form of the following forms Model No Expression
1 n = X1 2 n = X1 + X2 3 n = X1 + X3 4 n = X5
5 n = X2 + X5 (30) 6 n = X1 + X2 + X4
7 n = X1 + X2 + X4b 8 n = X1 + X2 + X6 9 n = X1 + X2 + X7 10 n = X1 + X7 + X8 11 n = X1 + X7 + X8 + X9 12 n = X10
International Journal of Emerging Technology and Advanced Engineering
Website: www.ijetae.com (ISSN 2250-2459, ISO 9001:2008 Certified Journal, Volume 9, Issue 9, September 2019)
[image:5.612.21.594.174.666.2]23
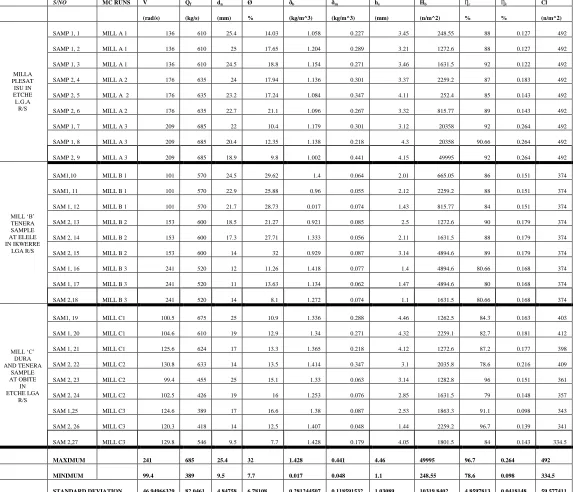
TABLE IIMEASURED CRACKING MACHINE PERFORMANCE RESULTS
Key:ƞn: Cracking efficiency; V = Speed of rotation; ; Ø = Moisture content; ðb= Bulk density; ðm = Nut particle density Qf = Feed rate; dn = Nut size; hs = Shell thickness; Hb = Nut hardness; ƞk = Kernel breakage ratio; Cl = Compressive yield load
S/NO MC RUNS V Qf dn Ø ðb ðm hs Hb Ƞc Ƞk Cl
(rad/s) (kg/s) (mm) % (kg/m^3) (kg/m^3) (mm) (n/m^2) % % (n/m^2)
MILLA PLESAT ISU IN ETCHE L.G.A
R/S
SAMP 1, 1 MILL A 1 136 610 25.4 14.03 1.058 0.227 3.45 248.55 88 0.127 492
SAMP 1, 2 MILL A 1 136 610 25 17.65 1.204 0.289 3.21 1272.6 88 0.127 492
SAMP 1, 3 MILL A 1 136 610 24.5 18.8 1.154 0.271 3.46 1631.5 92 0.122 492
SAMP 2, 4 MILL A 2 176 635 24 17.94 1.136 0.301 3.37 2259.2 87 0.183 492
SAMP 2, 5 MILL A 2 176 635 23.2 17.24 1.084 0.347 4.11 252.4 85 0.143 492
SAMP 2, 6 MILL A 2 176 635 22.7 21.1 1.096 0.267 3.32 815.77 89 0.143 492
SAMP 1, 7 MILL A 3 209 685 22 10.4 1.179 0.301 3.12 20358 92 0.264 492
SAMP 1, 8 MILL A 3 209 685 20.4 12.35 1.138 0.218 4.3 20358 90.66 0.264 492
SAMP 2, 9 MILL A 3 209 685 18.9 9.8 1.002 0.441 4.15 49995 92 0.264 492
MILL ‘B’ TENERA SAMPLE AT ELELE IN IKWERRE
LGA R/S
SAM1,10 MILL B 1 101 570 24.5 29.62 1.4 0.064 2.01 665.05 86 0.151 374
SAM1, 11 MILL B 1 101 570 22.9 25.88 0.96 0.055 2.12 2259.2 88 0.151 374
SAM 1, 12 MILL B 1 101 570 21.7 28.73 0.017 0.074 1.43 815.77 84 0.151 374
SAM 2, 13 MILL B 2 153 600 18.5 21.27 0.921 0.085 2.5 1272.6 90 0.179 374
SAM 2, 14 MILL B 2 153 600 17.3 27.71 1.333 0.056 2.11 1631.5 88 0.179 374
SAM 2, 15 MILL B 2 153 600 14 32 0.929 0.087 3.14 4894.6 89 0.179 374
SAM 1, 16 MILL B 3 241 520 12 11.26 1.418 0.077 1.4 4894.6 80.66 0.168 374
SAM 1, 17 MILL B 3 241 520 11 13.63 1.134 0.062 1.47 4894.6 80 0.168 374
SAM 2,18 MILL B 3 241 520 14 8.1 1.272 0.074 1.1 1631.5 80.66 0.168 374
MILL ‘C’ DURA AND TENERA
SAMPLE AT OBITE
IN ETCHE LGA
R/S
SAM1, 19 MILL C1 100.5 675 25 10.9 1.336 0.288 4.46 1262.5 84.3 0.163 403
SAM 1, 20 MILL C1 104.6 610 19 12.9 1.34 0.271 4.32 2259.1 82.7 0.181 412
SAM 1, 21 MILL C1 125.6 624 17 13.3 1.365 0.218 4.12 1272.6 87.2 0.177 398
SAM 2, 22 MILL C2 130.8 633 14 13.5 1.414 0.347 3.1 2035.8 78.6 0.216 409
SAM 2, 23 MILL C2 99.4 455 25 15.1 1.33 0.063 3.14 1282.8 96 0.151 361
SAM 2, 24 MILL C2 102.5 426 19 16 1.253 0.076 2.85 1631.5 79 0.148 357
SAM 1,25 MILL C3 124.6 389 17 16.6 1.38 0.087 2.53 1863.3 91.1 0.098 343
SAM 2, 26 MILL C3 120.3 418 14 12.5 1.407 0.048 1.44 2259.2 96.7 0.139 341
SAM 2,27 MILL C3 129.8 546 9.5 7.7 1.428 0.179 4.05 1801.5 84 0.143 334.5
MAXIMUM 241 685 25.4 32 1.428 0.441 4.46 49995 96.7 0.264 492
MINIMUM 99.4 389 9.5 7.7 0.017 0.048 1.1 248.55 78.6 0.098 334.5
International Journal of Emerging Technology and Advanced Engineering
Website: www.ijetae.com (ISSN 2250-2459, ISO 9001:2008 Certified Journal, Volume 9, Issue 9, September 2019)
[image:6.612.69.548.154.644.2]24
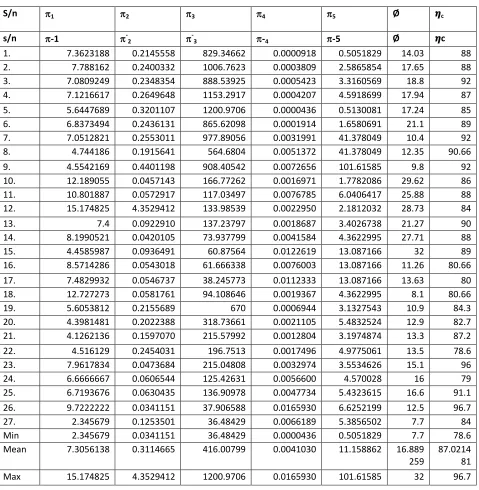
TABLE IIIEXPERIMENTAL RESULTS FOR THE DIMENSIONLESS VARIABLES
S/n 1 2 3 4 5 Ø 𝜼c
s/n -1 -2 -3 -4 -5 Ø 𝜼c
1. 7.3623188 0.2145558 829.34662 0.0000918 0.5051829 14.03 88
2. 7.788162 0.2400332 1006.7623 0.0003809 2.5865854 17.65 88
3. 7.0809249 0.2348354 888.53925 0.0005423 3.3160569 18.8 92
4. 7.1216617 0.2649648 1153.2917 0.0004207 4.5918699 17.94 87
5. 5.6447689 0.3201107 1200.9706 0.0000436 0.5130081 17.24 85
6. 6.8373494 0.2436131 865.62098 0.0001914 1.6580691 21.1 89
7. 7.0512821 0.2553011 977.89056 0.0031991 41.378049 10.4 92
8. 4.744186 0.1915641 564.6804 0.0051372 41.378049 12.35 90.66
9. 4.5542169 0.4401198 908.40542 0.0072656 101.61585 9.8 92
10. 12.189055 0.0457143 166.77262 0.0016971 1.7782086 29.62 86
11. 10.801887 0.0572917 117.03497 0.0076785 6.0406417 25.88 88
12. 15.174825 4.3529412 133.98539 0.0022950 2.1812032 28.73 84
13. 7.4 0.0922910 137.23797 0.0018687 3.4026738 21.27 90
14. 8.1990521 0.0420105 73.937799 0.0041584 4.3622995 27.71 88
15. 4.4585987 0.0936491 60.87564 0.0122619 13.087166 32 89
16. 8.5714286 0.0543018 61.666338 0.0076003 13.087166 11.26 80.66
17. 7.4829932 0.0546737 38.245773 0.0112333 13.087166 13.63 80
18. 12.727273 0.0581761 94.108646 0.0019367 4.3622995 8.1 80.66
19. 5.6053812 0.2155689 670 0.0006944 3.1327543 10.9 84.3
20. 4.3981481 0.2022388 318.73661 0.0021105 5.4832524 12.9 82.7
21. 4.1262136 0.1597070 215.57992 0.0012804 3.1974874 13.3 87.2
22. 4.516129 0.2454031 196.7513 0.0017496 4.9775061 13.5 78.6
23. 7.9617834 0.0473684 215.04808 0.0032974 3.5534626 15.1 96
24. 6.6666667 0.0606544 125.42631 0.0056600 4.570028 16 79
25. 6.7193676 0.0630435 136.90978 0.0047734 5.4323615 16.6 91.1
26. 9.7222222 0.0341151 37.906588 0.0165930 6.6252199 12.5 96.7
27. 2.345679 0.1253501 36.48429 0.0066189 5.3856502 7.7 84
Min 2.345679 0.0341151 36.48429 0.0000436 0.5051829 7.7 78.6
Mean 7.3056138 0.3114665 416.00799 0.0041030 11.158862 16.889
259
87.0214 81
International Journal of Emerging Technology and Advanced Engineering
Website: www.ijetae.com (ISSN 2250-2459, ISO 9001:2008 Certified Journal, Volume 9, Issue 9, September 2019)
[image:7.612.109.486.150.439.2]25
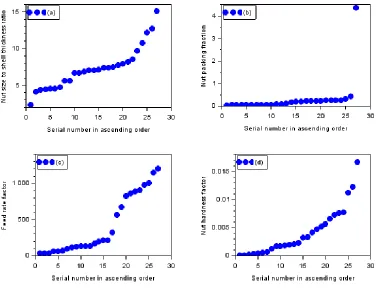
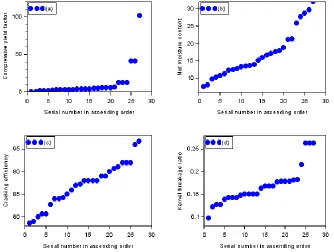
Figure 1: Trends in the experimental values of the dimensionless variables Key: (a) Trends in the values of 1
(b) Trends in the values of 2 (c) Trends in the values of 3
International Journal of Emerging Technology and Advanced Engineering
Website: www.ijetae.com (ISSN 2250-2459, ISO 9001:2008 Certified Journal, Volume 9, Issue 9, September 2019)
[image:8.612.132.466.151.403.2]26
Figure 2: Trends in the experimental values of the dimensionless variables Key: (a) Trends in the values of 5
(b) Trends in the values of Ø (c) Trends in the values of 𝜼c
IV. SELECTED REGRESSION MODEL
All of the regression models presented in equation (31) were considered to select the best performing model in
fitting the experimental data. For each model, the value of the R2 and the adjusted R2 is computed for both the cracking efficiency.
International Journal of Emerging Technology and Advanced Engineering
Website: www.ijetae.com (ISSN 2250-2459, ISO 9001:2008 Certified Journal, Volume 9, Issue 9, September 2019)
27
TABLE IVREGRESSION RESULTS SHOWING THE R2 AND ADJUSTED R2 VALUES FOR EACH MODEL
S/n Cracking efficiency, 𝜼c
R2 adjusted R2
Model R2(1) R2(1)(adj)
1 0.2545288 -0.0201185
2 0.6023532 0.2047064
3 0.5810309 0.2219146
4 0.2717222 0.0034093
5 0.6216409 0.2432818
6 0.8215432 0.3371606
7 0.7837984 0.2973447
8 0.7462912 0.1754464
9 0.7311643 0.1262840
10 0.5834175 -0.0831145
11 0.7394743 0.0323333
12 0.2713577 -0.1840437
From the results, it is seen that model 6 given in equation Table 4 has the highest adjusted R2 value for cracking efficiency,
V. CRACKING EFFICIENCY
From model 6 of equation (3.1), the cracking efficiency is given by
𝜼c = X1 + X2 + X4 (31)
Substituting the relevant expressions for X1, X2 and X4, it follows that
𝜼c = X1 + X2 + X4
= a1 + a21 + a32 + a43 + a54 + a65 + a76 + b121 + b222 + b323 + b424 + b525 + b66-2 + d131 + d232 + d333 + d443 + d553 + d66-3
For convenience, this may be rewritten as
International Journal of Emerging Technology and Advanced Engineering
Website: www.ijetae.com (ISSN 2250-2459, ISO 9001:2008 Certified Journal, Volume 9, Issue 9, September 2019)
[image:10.612.105.504.158.416.2]28
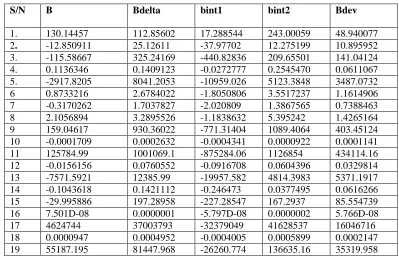
TABLE VCOEFFICIENTS FOR THE BEST REGRESSION MODEL FOR CRACKING EFFICIENCY
S/N B Bdelta bint1 bint2 Bdev
1. 130.14457 112.85602 17.288544 243.00059 48.940077
2. -12.850911 25.12611 -37.97702 12.275199 10.895952
3. -115.58667 325.24169 -440.82836 209.65501 141.04124
4. 0.1136346 0.1409123 -0.0272777 0.2545470 0.0611067
5. -2917.8205 8041.2053 -10959.026 5123.3848 3487.0732
6 0.8733216 2.6784022 -1.8050806 3.5517237 1.1614906
7 -0.3170262 1.7037827 -2.020809 1.3867565 0.7388463
8 2.1056894 3.2895526 -1.1838632 5.395242 1.4265164
9 159.04617 930.36022 -771.31404 1089.4064 403.45124
10 -0.0001709 0.0002632 -0.0004341 0.0000922 0.0001141
11 125784.99 1001069.1 -875284.06 1126854 434114.16
12 -0.0156156 0.0760552 -0.0916708 0.0604396 0.0329814
13 -7571.5921 12385.99 -19957.582 4814.3983 5371.1917
14 -0.1043618 0.1421112 -0.246473 0.0377495 0.0616266
15 -29.995886 197.28958 -227.28547 167.2937 85.554739
16 7.501D-08 0.0000001 -5.797D-08 0.0000002 5.766D-08
17 4624744 37003793 -32379049 41628537 16046716
18 0.0000947 0.0004952 -0.0004005 0.0005899 0.0002147
19 55187.195 81447.968 -26260.774 136635.16 35319.958
REFERENCES
[1] Akubuo, L.O and Eje. B.E; (2002). Palm kernel and shell separator doi:1006/bioe.2001.0029, available online at http:/www.ideallibrary.com on IDEAL PH-post harvest technology. [2] Alkali, I.D and Guyen, O. (1990). Physical properties of peament in
Turkey Agricultural mechanization in Asia, African and Latin America 2 (3) 5559
[3] Asoegwu, S.N, Agbetoye LAS, Ogunlowo, A.S, (2010). Modeling flow rate of Egusi melon (Colocynthis citrullus) through circular horizontal hopper Orifice. Journal of advance in science and technology, 4.35-44
[4] Ewulugo, C-O (2001). Design and fabrication of an improved palm kernel oil expeller. Unpublished b. Eng project report. Department of Agricultural Bio resources Engineering University of Nigeria Nsukka.
[5] Ezeoha , S.L Akubuo, C.O Ani, A.O, (2012). Proposed average values of some Engineering properties of palm kernel. Nigeria Journal of Technology (NIJO TECH) Vol. 31 (2) 167-178.
[6] Fathollahzadeh, F., Hossen, M., Ali, J, Babak, B, Ali M.B Mahdi, H., (2008). Moisture depadment of mechanical properties of Tabarzah of Apricot pit. America- European J. Agric and Environmental Science, 3 (3) 403-408.
[7] Feizollah shahbazi (2012): Effects of moisture, impact direction and impact energy on the cracking characteristics of apricot. World Applied Sciences Journal 20(11): 1520- 1528
[8] Gbadamonsi, L. (2006). Some engineering properties of palm kernel (Elaesis quineasis). Journal of Agricultural Engineering Technology. Vol. 14 Pp. 58-66
[9] Koya, O.A; Idowu, A and Faborode, M.O, (2004). Some properties of palm kernel and shell relevant in nut cracking and product separation. Journal of Agricultural Engineering Technology 12:333-44.
[10] Mijinyawa, Y; and Omoikhoje, S , (2005) Determination of some physical properties of palm kernel. Proceedings of the Nigeria Institution of Agricultural Engineer: 27: 157-160.
[11] Murdock, J.W., (1986). Mechanics of fluids marks standard hand book for mechanical engineers, 9th edition. McGraw Hill Brode
Company, New York.
[12] Ndukwu M.C (2009). Effect of drying temperation and drying air velocity on the drying constant of cocoa bean. Agricultural engineering international then CIGR journal, 11:1-7.
[13] Ndukwu M.C. (1998). Performance of a vertical-shaft centrifuge palm nut cracker, (B. Eng thesis).
[14] Olakunle, O.J, (2010). Grain damage and threshing efficiency of indigenous Journal combine harvester . International agricultural engineering Journal 11 (1): 2002, 51-58
[15] Oluwole, F.A; Aviara, N.A, and M.A; Haque (2007). Effect of moisture content and impact energy on the crackability of sheamot agricultural Engineering international. The CIGR E journal 8: of 20 [16] Simon Yan K.J, Jiliep Y.D, Mudiare O.J, (2010) Development of a