International Journal of Emerging Technology and Advanced Engineering
Website: www.ijetae.com (ISSN 2250-2459, ISO 9001:2008 Certified Journal, Volume 8, Issue 3, March 2018)
81
A Cloud based Optimal VM Techniques for Road Traffic Data
with Performance Evaluation
Md. Rafeeq M.Tech(PhD)
1, Dr.C. Sunil Kumar
2, Dr. N. Subhash Chandra
3 1Associate Professor in CSE, CMRTC, Kandlakoya,Medchal , Hyderabad, TS, India.
2Professor in IT, SNIST, Yamnampet, Ghatkesa, Hyderabad, TS, India. 3Professor in CSE, CVRCE, Manglapalli, Ibrahimpatnam R.R(D), TS, India
Abstract- With the exponential growth of traffic and road links, it is the need of the research to explore new directions of managing and predicting the traffic situations in order to gain road safety, better traffic managements and finally gain higher productivity during pick hours by reducing the traffic burdens. Across the world ranging from city to urban the tremendous growth of road traffic is leading towards a major problem. The highly populated cities around the world are facing the problem of better traffic management. The technologically advanced cities deploy agent based multiple multimedia censor based networks to collect and analyze the traffic data to provide better solutions for management and prediction of the road conditions.
I. INTRODUCTION
[image:1.612.335.553.257.502.2]The data collections methods include automatic and manual collections of high amount of data and then the analysis are often done in legacy system or manually. However the collected data reaches a high volume and became highly difficult to manage. Moreover the predictive analysis also demands a high computational power to run the predictive analysis algorithms. Hence considering the situations we identify the following problems to be addressed in the current traffic management situations: Management of Agent based Censor network to implement a low cost infrastructure and normalization of the data under preprocessing. Comparison and identification of most suitable cloud storage architecture for replication of data considering the low cost Erasure models.
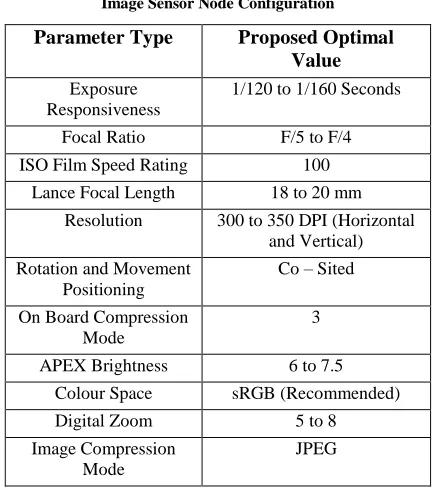
Table 1:
Image Sensor Node Configuration
Parameter Type Proposed Optimal Value
Exposure Responsiveness
1/120 to 1/160 Seconds
Focal Ratio F/5 to F/4
ISO Film Speed Rating 100
Lance Focal Length 18 to 20 mm
Resolution 300 to 350 DPI (Horizontal
and Vertical)
Rotation and Movement Positioning
Co – Sited
On Board Compression Mode
3
APEX Brightness 6 to 7.5
Colour Space sRGB (Recommended)
Digital Zoom 5 to 8
Image Compression Mode
JPEG
International Journal of Emerging Technology and Advanced Engineering
Website: www.ijetae.com (ISSN 2250-2459, ISO 9001:2008 Certified Journal, Volume 8, Issue 3, March 2018)
82
II. PROPESED WORK
The programmable data accumulator agents are configured to capture the image and video data. The optimizer components into these agents are configured to capture the video or image data while the motion in the object is detected. This makes the captured data optimized in size.
The algorithm used for motion detection for multiple objects consider each object as collective vector object as
t
O at any given time instancet.
2.1 Data Accumulator Agent
The collection of the detectable features based on the time instance are noted as
1, 2.... t
F F F. The algorithm is deploying a probabilistic
function to estimate the next state of the specified object
denoted asP O F F( t| 1, 2,.... )Ft . The outcome of this probabilistic function is the next possible coordinates for the object under motion tacking. Further the probabilistic function at any given time is considered to function on a weighted and time depended sample set of video data.
The sample set is defined as
( )
{Stv,v1,.... }V
with the considered weight for corrected predictive
location is ( )v t
. The V parameter denotes the number ofvideo data in the selected data set.
Henceforth we understand the relation between the learning features and the probabilistic prediction as,
Firstly we consider the sample data set with V number of video data as
( ) 0
{S v,v1,.... }V …Eq. 1
The weight component for enhanced learning is considered as
( ) 0
{
v,v1,.... }V …Eq. 2Hence, the final probabilistic function for next location determination is
1 2 ( t| , ,.... )t
P O F F F
…Eq. 3
Henceforth we consider the change in enhanced learning factor as
1 ( t| t )
P O O …Eq. 4
The next step is to apply the Eq. 4 on Eq. 1and obtain a
new dataset for prediction and obtain ( ) {Stv}
Hence the final step is to consider the updated feature tracking for iterative calculation of the motion as
( ) ( ) 1 ( | ) ( | ) v v t t V i t i
P F S P F S
…Eq. 5
Local Storage: The local storage container is designed to store data locally from the capture agents in case of loss of connectivity between the network layer and other layers. The local storage containers are desired to perform the on board compression and store small amount of data.
Table 2:
Image Sensor Node Configuration
Parameter Type Proposed Optimal Value
Technology ZIP or JAZ or USB
Preferred Mode of Operation
No or Less Mechanical Parts
Read Speed 20 to 200 MBPS
Write Speed 30 to 280 MBPS
Form Factor 2.5 to 3.5
Storage Capacity 5 to 12 GB
Supported Storage Format JPEG
However the storage containers are expected to deliver the low latency. Here we propose the factors to be considered for a local storage to balance the performance and cost implications [Table - 2].
3.2 Applied machine learning techniques for improved navigational systems
International Journal of Emerging Technology and Advanced Engineering
Website: www.ijetae.com (ISSN 2250-2459, ISO 9001:2008 Certified Journal, Volume 8, Issue 3, March 2018)
83
The most effective and popular framework under Erasure Coding is Reed-Solomon framework. The
framework can be applied in case of
2
z
n
, where n denotes number of disks and z denotes number of customer data. To understand the framework for 256 storage containers or disks are considered. For a 256 disks, a Reed – Solomon code can be defined and implemented using Galois Field Arithmetic or GF (28). The coefficient “a” can be defined in various ways. The basic implementation of Reed – Solomon is Couchy construction. To understand Couchy construction, we select any n unique numbers in the space of GF(2Z).Hence the selected n number are distributed in two sets called X and Y, where X contains m
Elements and Y contains k elements. Hence:
,
1
( )
i ji j
a
x
y
with the help of GF (2z)..Eq 6
The most important factor that makes Reed-Solomon framework to implement is the simplicity. In this framework selecting k and m is random and does not depend on any factors and can be selected independently. The performance can be questioned as the time complexity for performing an XOR operating is less compared to GF. However the modern processors rely on vector instruction sets for performing array based multiplication operation. Hence the reduction in time for computation can be and the probabilistic prediction as, achieved. Moreover with the improvement of latency time for the I/O devices and cache memory is also been improving to match with the highly complex Erasure Codes.
The implementation of Reed – Solomon is simple as many open source solutions are readily available for storage solutions.
III. MACHINE LEARNING TECHNIQUES FOR ROAD TRAFFIC DATA
The most effective functionalities of a road traffic management system also may include the predictive analysis system as an alternative to the guided navigation system. The prediction system must be enabled to predict the road traffic conditions specially the congestion control. Hence in this work we understand the most popular machine learning predictive approaches for road traffic data analysis:
3.1.1. Gaussian Naïve Bayes
In case of continuous parameter evaluation of number of parameters, the Gaussian Naïve Bayes probabilistic solution plays the major role. The Gaussian Naïve Bayes is formulated and understood here:
2 2 ( ) 2 2
1
(
| )
2
c c v cP x
v c
e
... Eq 7Where,
(
| )
P x
v c
is defined as any class for distributionx denotes the continuous attributes used for the classification
c
is defined as mean value of the attributes
2
c
is defined as variance of the attributes
3.1.2. Multinomial Naïve Bayes
In case of the event generation probabilistic models, the Multinomial Naïve Bayes probabilistic model is widely used. Here the Multinomial Naïve Bayes is formulated and understood:
(
)!
( |
)
!
i i i x i K k i i ix
P x C
P
x
... Eq 8Where,
P denotes the probability of any event to occur or K number of multinomial cases in multiple event classes. X denotes the number of times any event I took place in the space.
3.1.3. Bernoulli Naïve Bayes
In case of the document or generic text classification the use of Bernoulli Naïve Bayes is highly adopted. Here we formulate and understand the Bernoulli Naïve Bayes probabilistic model:
(1 )
1
( |
)
i(1
)
ii i
n
x x
K k k
i
P x C
P
P
International Journal of Emerging Technology and Advanced Engineering
Website: www.ijetae.com (ISSN 2250-2459, ISO 9001:2008 Certified Journal, Volume 8, Issue 3, March 2018)
84
Where,
i
k
P
denotes the probability for any class
C
Kproducing anyterm.
i
x
denotes the probability of producing any term from the possible set.
The above mentioned mining techniques are widely employed by multiple researchers in the past and recent researches. Henceforth this understanding will help us to extend the work of proposed framework by proposing the traffic prediction system.
IV. PERFORMANCE EVALUATION MATRIX
A novel matrix to evaluate the performance of the proposed migration algorithm is been coined in this work. The parameters names, details of the parameter with the optimality expectation are been proposed here [Table – 3]: The analysis of the cost matrix is demonstrated in the results and discussion section of the work
4.1 Results And Discussions
The results of simulation testing for the proposed framework under the NetSIM tool are satisfactory.
The framework is been tested on the parameters proposed in the performance evaluation matrix [Table – 4]. The results demonstrates the most effective and sustainable nature of the framework. However the due to the network congestion during the data transmission, it is been observed that the availability of the parameter values are seems not to be available for longer runs. Hence this issue will be addressed in the further research for this work.
This work has performed extensive testing to demonstrate the improvement over the existing migration techniques [6] [7] [8] [9] [10]. The various considered migration techniques are listed with the used acronyms here [Table – 5]:
International Journal of Emerging Technology and Advanced Engineering
Website: www.ijetae.com (ISSN 2250-2459, ISO 9001:2008 Certified Journal, Volume 8, Issue 3, March 2018)
[image:5.612.50.563.160.695.2]85
Table 3.
Performacne Evaluation Matrix and Parameters
Parameter Details Optimality Expectation
Number of hosts Number of Host Machines during the simulation or testing Same throughout all simulations
Number of VMs
Number of Virtual Machines during the simulation or testing Same throughout all simulations Total simulation time
Duration of the Simulation Same throughout all simulations Energy consumption
The amount of Energy difference during migration Expected to be Minimum Number of VM migrations
Total number of Virtual machine migrations
Expected to be Mean of all the techniques
SLA performance degradation
SLA performance degradation due to migration
Expected to be Mean of all the techniques
SLA time
SLA time per active host
Expected to be Mean of all the techniques
SLA violation
Overall SLA violation Expected to be Minimum Average SLA violation
Average SLA violation
Expected to be Mean of all the techniques
Host shutdowns
Number of host shutdowns Expected to be Maximum Host shutdown – Mean
Mean time before a host shutdown
Expected to be Mean of all the techniques
Host shutdown – Standard Deviation
Standard Deviation time before a host shutdown Expected to be Minimum VM migration time - Mean
Mean time before a VM migration Expected to be Minimum VM migration time – Standard Deviation
Standard deviation time before a VM migration Expected to be Minimum VM selection mean
Execution time for VM selection in mean Expected to be Minimum VM selection time - Standard Deviation
Execution time - VM selection standard deviation Expected to be Minimum Host selection time - mean
Execution time for host selection in mean Expected to be Minimum Host selection time - Standard Deviation Execution time for host selection in standard deviation Expected to be Minimum
VM reallocation time - Mean Execution time for VM reallocation in mean Expected to be Minimum
VM reallocation time - Standard Deviation Execution time for VM reallocation in standard deviation Expected to be Minimum
Total execution time – Mean Total Execution time for VM reallocation in mean Expected to be Minimum
International Journal of Emerging Technology and Advanced Engineering
Website: www.ijetae.com (ISSN 2250-2459, ISO 9001:2008 Certified Journal, Volume 8, Issue 3, March 2018)
[image:6.612.89.528.160.595.2]86
TABLE 4: Property Availability Matrix
Parameter Observation
Availability of the Properties
Test Process – 1 (Duration – 60 Mins)
Test Process – 2 (Duration – 90 Mins)
Test Process – 3 (Duration – 200 Mins)
Name of Node Available Available Available
Type Available Available Available
Overall Health Indicator Available Available Available
Last Accessed Available No Continuous
Availability Available
Total Availability Available Available No Continuous Availability
Memory Utilization Available Available Available
Disk Utilization Available Available Available
Network Utilization Available No Continuous
Availability No Continuous Availability
Active Memory Available No Continuous
Availability No Continuous Availability
Over heading Memory Available Available No Continuous Availability
Swappable Memory Available Available Available
Total Shared Memory Available No Continuous
Availability No Continuous Availability
Memory Temperature Available Available Available
Container Name Available Available Available
Container Size Available Available Available
Container Utilization Available Available Available
Network Device ID Available Available Available
Up Time Available Available No Continuous Availability
Down Time Available Available No Continuous Availability
IP Address Available Available Available
MAC Address Available Available Available
Data Transfer Rate Available Available Available
Device ID Available Available Available
Type Available Available Available
Read Count Available Available No Continuous Availability
Write Count Available Available No Continuous Availability
These works considers the parallel research
outcomes of recent time and find multiple approaches
to build a scalable and sustainable framework for
traffic monitoring system. Based on the parallel
research outcomes we understand the focus area of
this research. We alsounderstand the generic
components of any road traffic management and
monitoring system consisting of Sensor Nodes, Data
Collector, and Monitoring agents, Storage Controller,
Information Server and Application Server[9-12].
International Journal of Emerging Technology and Advanced Engineering
Website: www.ijetae.com (ISSN 2250-2459, ISO 9001:2008 Certified Journal, Volume 8, Issue 3, March 2018)
[image:7.612.67.550.156.674.2]87
Table 5.
List of Techniques used for Performance Comparison
Used Name
in this Work
Selection Policy
Allocation Policy
IQR MC
Maximum Correlation
Inter Quartile Range
IQR MMT
Minimum Migration Time
Inter Quartile Range
LR MC
Random Selection
Local Regression
LR MMT
Minimum Migration Time
Local Regression
LR MU
Minimum Utilization
Local Regression
LR RS
Rom Selection
Local Regression
LRR MC
Maximum Correlation
Robust Local Regression
LRR MMT
Minimum Migration Time
Robust Local Regression
LRR MU
Minimum Utilization
Robust Local Regression
LRR RS
Rom Selection
Robust Local Regression
MAD MC
Maximum Correlation
Median Absolute Deviation
MAD MMT
Minimum Migration Time
Median Absolute Deviation
MAD MU
Minimum Utilization
Median Absolute Deviation
MAD RS
Rom Selection
Median Absolute Deviation
THR MC
Maximum Correlation
Static Threshold
THR MMT
Minimum Migration Time
Static Threshold
THR MU
Minimum Utilization
Static Threshold
THR RS
Rom Selection
Static Threshold
International Journal of Emerging Technology and Advanced Engineering
Website: www.ijetae.com (ISSN 2250-2459, ISO 9001:2008 Certified Journal, Volume 8, Issue 3, March 2018)
88
V. CONCLUSION
This work also proposes the performance evaluation matrix for evaluating the performance of any generic road traffic management and monitoring system. Load Balancing can be achieved through virtual machine migration. However the existing migration techniques constraints to improve the SLA and often compromise to a higher scale on the other performance evaluation factors. This work also proposes the performance evaluation matrix for evaluating the performance of any generic road traffic management and monitoring system. Load Balancing can be achieved through virtual machine migration. However the existing migration techniques constraints to improve the SLA and often compromise to a higher scale on the other performance evaluation factors. This work, demonstrates the optimal three phase virtual machine migration technique with up to 70% improvement to retain SLA compared to the other virtual machine migration technique. However the proposed technique is independent of the virtual machine image format and demonstrates the same improvement. The comparative analysis is been done with the proposed technique with the existing techniques like IQR MC, IQR MMT, LR MC, LR MMT, LR MU, LRR MC, LRR MMT, LRR MU, LRR RS, LR RS, MAD MC, MAD MMT, MAD MU, MAD RS, THR MC, THR MMT, THR MU and THR RS. The work also furnishes the practical evaluation results from the simulation to retain the improvement of the other parameters at least to the mean of other techniques during SLA improvement. Also this proposed technique for virtual machine migration demonstrates no loss in existing CPU utilization during load balancing[8-11].
REFERENCES
[1] R. Yu, M. Abdel-Aty, and M. Ahmed, “Bayesian random effect models incorporating real-time weather and traffic data to investigate mountainous freeway hazardous factors,” Accid. Anal. Prev., vol. 50, pp. 371–376, Jan. 2013.
[2] R. Yu and M. Abdel-Aty, “Utilizing support vector machine in real time crash risk evaluation,” Accid. Anal. Prev., vol. 51, pp. 252–259, Mar. 2013.
[3] C. Xu, A. Tarko, W. Wang, and P. Liu, “Predicting crash likelihood and severity on freeways with real-time loop detector data,” Accid. Anal. Prev., vol. 57, pp. 30–39, Aug. 2013.
[4] J. Lee and F. Mannering, “Impact of roadside features on the frequency and severity of run-off-roadway accidents: An empirical analysis,” Accid. Anal. Prev., vol. 34, no. 2, pp. 149–161, Mar. 2012.
[5] Ammar Alazab, SitalakshmiVenkatraman, JemalAbawajy and anmounAlazab, “An Optimal Transportation Routing Approachusing GIS – based Dynamic Traffic Flows”, International Conferenceon Management Technology and Applications,10-12 Sep,2010. [6] M. Ahmed, M. Abdel-Aty, and R. Yu, “A Bayesian updating
approach for real-time safety evaluation using AVI data,” Transport. Res. Rec.,vol. 2280, pp. 51–59, 2012.
[7] W. Zhao and X. Tang, “Scheduling Data Collection with Dynamic Traffic Patterns in Wireless Sensor Networks,” Proc. IEEE INFOCOM ’11, pp. 286-290, Apr. 2011.
[8] The Mobile Millenium Project, http://traffic.berkeley.edu, 2013. [9] R.K. Balan, K.X. Nguyen, and L. Jiang, “Real-Time Trip
Information Service for a Large Taxi Fleet,” Proc. ACM MobiSys, 2011.
[10] Bejan and R.J. Gibbens, “Evaluation of Velocity Fields via Sparse Bus Probe Data in Urban Areas,” Proc. IEEE 14th Int’l Conf. Intelligent Transportation Systems (ITSC), 2011.
[11] Z. Li, Y. Zhu, H. Zhu, and M. Li, “Compressive Sensing Approach to Urban Traffic Sensing,” Proc. 31st Int’l Conf. DistributedComputing Systems (ICDCS), 2011.