BIROn - Birkbeck Institutional Research Online
Thomas, Michael S.C. and Forrester, N.A. and Ronald, Angelica (2016)
Multi-scale modeling of gene-behavior associations in an artificial neural network
model of cognitive development. Cognitive Science 40 (1), pp. 51-99. ISSN
1551-6709.
Downloaded from:
Usage Guidelines:
Please refer to usage guidelines at or alternatively
1
Multi-scale modeling of gene-behavior associations in an artificial
neural network model of cognitive development
Michael S. C. Thomas, Neil A. Forrester & Angelica Ronald
Developmental Neurocognition Lab Birkbeck, University of London, UK
Abstract: 250 words Main text: 13,417 words References: 1837 words
2
Abstract
In the multi-disciplinary field of developmental cognitive neuroscience, statistical
associations between levels of description play an increasingly important role. One
example of such associations is the observation of correlations between relatively
common gene variants and individual differences in behavior. It is perhaps surprising that
such associations can be detected despite the remoteness of these levels of description,
and the fact that behavior is the outcome of an extended developmental process involving
interaction with a variable environment. Given that they have been detected, how do such
associations inform cognitive-level theories? To investigate this question, we employed a
multi-scale computational model of development, using a sample domain drawn from the
field of language acquisition. The model comprised an artificial neural network model of
past-tense acquisition trained using the backpropagation learning algorithm, extended to
incorporate population modeling and genetic algorithms. It included five levels of
description, four internal: genetic, network, neurocomputation, behavior; and one
external: environment. Since the mechanistic assumptions of the model were known and
its operation was relatively transparent, we could evaluate whether cross-level
associations gave an accurate picture of causal processes. We established that
associations could be detected between artificial genes and behavioral variation, even
under polygenic assumptions of a many-to-one relationship between genes and
neurocomputational parameters, and when an experience-dependent developmental
process interceded between the action of genes and the emergence of behavior. We
3 function versus structure), to their developmental stability, and to their replicability, as
well as considering issues of missing heritability and gene-environment interactions. We
argue that gene-behavior associations can inform cognitive theory with respect to effect
size, specificity, and timing. The model demonstrates a means by which researchers can
undertake modeling multi-scale modeling with respect to cognition, and develop highly
specific and complex hypotheses across multiple levels of description.
Keywords: Multi-scale models, artificial neural networks, population modeling,
gene-behavior associations, gene-environment interactions, missing heritability,
4
1. Introduction
Developmental cognitive neuroscience is an intrinsically multi-disciplinary endeavor,
where theoretical findings from multiple levels of description are integrated into an
overall account of the origins of behavior. One source of empirical data that increasingly
constrains theories is that of statistical associations between levels of description; for
example, gene variants that correlate with individual differences in behavior, or structural
and functional properties of the brain that correlate with behavior across individuals or
within individuals over time. However, it is a significant challenge to construct causal
accounts of development that span levels of description and thereby unify the correlations
by appeal to explanatory mechanism (Johnston & Lickliter, 2009). This is particularly
true for gene-behavior associations, because so many levels of description can be
specified in between, and so many contributory factors interact to produce high-level
behavior. Genetic effects are cellular but must be linked to behavior via neural circuits
and global brain function. Moreover, the contribution of some genetic activity to
individual differences in behavior occurs via an extended developmental process.
One recent response to this challenge is the use of multi-scale computational modeling.
This approach originated in systems biology, where the availability of more powerful
computers has enabled the coupling of complex models across multiple spatial and
temporal scales and for multiple physical processes (Southern et al., 2008). The aim of
multi-scale models is to integrate relevant information at multiple levels of organization
to recreate dynamic interactions, where the complexity of the underlying interacting
5 Southern et al. (2008, p.67) define a multi-scale model as one ‘which includes
components from two or more levels of organization (multiple length scales) or if it
includes some processes that occur much faster in time than others (multiple time
scales)’. The levels they characterized ranged from the quantum to molecular,
macro-molecular, sub-cellular, tissue, organ, organ system, organism, and environment.
Southern et al. exemplified the approach via research on the dynamics of ion channels
and on cardiac modeling. The work of Karr et al. (2012) represents a more recent
example, where the authors constructed a multi-scale model of a whole cell, including all
of its molecular components, in order to predict phenotype from genotype.
Dammann and Follett (2011) have argued that multi-scale computational models may be
equally applicable to developmental cognitive neuroscience. In particular, they
considered the use of computational models with respect to developmental disability.
They identified in silico approaches as complementary to in vivo and in vitro studies in
teasing apart the complicated inter-relationships between etiological exposures and
pathological mechanisms on developmental outcomes. Dammann and Follett reviewed
work at the systems level, where the target outcomes are located at the behavioral level,
and the lower levels of description comprise phenomena such as activity-dependent
plasticity and the response of neural networks to neuronal dysfunction.
In this paper, we employed multi-scale computational modeling to investigate
gene-behavior associations, and in particular, the extent to which reliable associations from the
6 take place at the intervening levels of description. Since the mechanistic assumptions of
the model were known and its operation was relatively transparent, we could evaluate
whether cross-level associations gave an accurate picture of causal processes. More
specifically, where genes are taken to impinge on learning abilities, we could explore
how the developmental process itself, involving interaction with a structured learning
environment, impacted on the relationship between gene variants and eventual behavioral
outcomes. As a sample domain, we used a well-known cognitive model drawn from
research on language acquisition, which captured the development of past tense
formation. The architecture we utilized combined artificial neural network models of
development with genetic algorithms and population modeling techniques. In the
following paragraphs, we characterize the way in which association analyses have been
used as a source of constraining data in developmental cognitive neuroscience, before
identifying the key phenomena that were the target of our multi-scale model.
1.1 Association studies in developmental cognitive neuroscience
Based on quantitative behavioral genetic methods such as twin studies, individual
differences in behavior, including cognitive skills and personality dimensions, have been
found to be highly heritable (Plomin et al., 2012). Frequently, between a half and three
quarters of the phenotypic variability may be explained by genetic factors in the
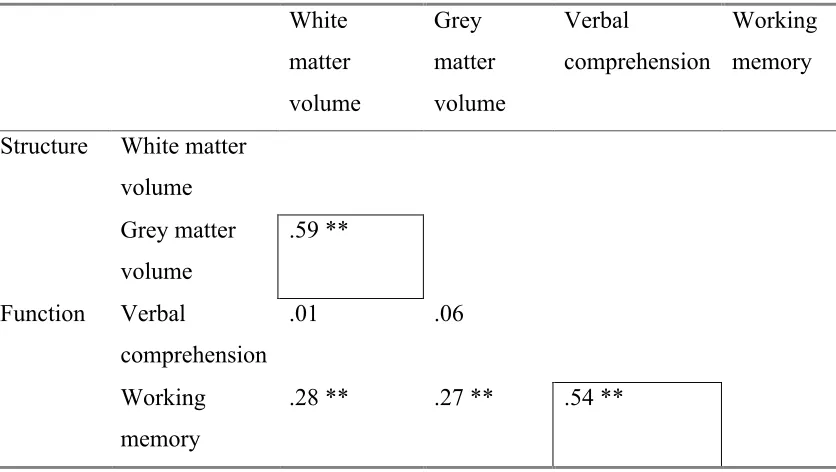
populations that have been studied. Separately, indices of brain structure have also been
found to be highly heritable – though notably, these indices are not always tightly
correlated with behavior. For example, in one study by Posthuma et al. (2003), the
7 verbal comprehension was reported to be 84%, while the correlation between these two
indices was only .06 (see also Wallace et al., 2010). Given evidence of high heritability in
individual differences at brain and behavioral levels, we should in theory be able to find
gene variants across individuals that predict these differences.
Two main approaches have been used to uncover gene variants associated with
phenotypic variability (see Ronald, 2011, for discussion). In candidate gene association
studies, researchers have identified variants in genes that are hypothesized to play a role
in brain development and function. The genes are involved in processes such as
neurotransmitter regulation, synaptic plasticity, or neural migration. Researchers have then investigated whether the variants show reliable associations with differences in
high-level behavior, either in explaining normal variation or occurring more frequently in
atypical populations. As examples of studies using this approach, genetic variations have been proposed to modulate attention skills via a pathway that alters the efficiency of
dopamine receptors in the fronto-striatal systems delivering behavioral control (Posner, Rothbart & Sheese, 2007). Developmental language impairment and autism have both
been linked to a gene variant (CNTNAP2) that alters production of a protein sitting in the membranes of neurons. The protein influences interactions between different cells during
the development and wiring up of the nervous system (Vernes et al., 2008; see
Peñagarikano & Geschwind, 2012). Developmental dyslexia has been linked to four gene
variants (DYX1C1, KIAA0319, DCDC2 and ROBO1) associated with neuronal cell
8
On the whole, associated gene variants appear to relate to fairly general
neurocomputational properties. For example, two genes whose variants have been much studied (COMT: catechol-O-methyl-transferase, and BDNF: brain-derived neurotrophic
factor) have basic neural functions and their effects in the brain are likely to be
widespread in terms of structure and function (Kovas & Plomin, 2006; Plomin & Kovas,
2005). Where gene-behavior associations have been found, effect sizes are usually small, each explaining less than 1% of the behavioral variance. The implication is that multiple
gene variants contribute jointly to variations at the level of behavior (Plomin et al., 2012). Even though effect sizes are small, they can nevertheless be observed for one behavior
and not for another even in the same domain. For example, in individuals with specific
language impairment, an association was observed between variants of two genes on chromosome 16 (CMIP and ATP2C2) and non-word repetition performance, but no
association was observed for recalling sentences or for reading (Newbury et al., 2009). Since the contribution of individual gene variants to predicting behavior is usually so
small in association analyses, even with large populations, there are many false alarms
and failures to replicate across different samples in candidate gene association studies (Posthuma & de Geus, 2006).
The second main approach used to uncover gene variants associated with phenotypic
variability is genome-wide association studies (GWAS). In GWAS, researchers seek associations with markers of genetic variation that span the whole genome. If an
9
that the location of the causal variant is close to the marker (based on the principle of
linkage disequilibrium, whereby locations that are closer on a chromosome have a greater
probability of being inherited together; see Visscher et al., 2012). A large number of markers are used, allowing some localization of causal variants on the genome, though
the actual causal variants must then be identified. To date, GWAS have been more often used to study genetic variation associated with complex diseases, often conceptualized as
a dichotomous outcome. Visscher et al. (2012) reported that well over 2000 locations have now been significantly and robustly associated with one or more disease traits,
generating novel hypotheses about causal pathways generating disease. In most cases, multiple loci are associated with a given trait, implicating the joint contribution of
multiple gene variants to variations in behavior (so called polygenic effects).
Visscher et al. (2012) interpreted genetic findings from the study of disease to support the
common disease-common variant hypothesis. This hypothesis states that disease causing
gene variants are common in the population, with a large number of variants each
conferring a small amount of additional risk of disease. Thus a given variant may
increase the odds of having a disease 1.1 to 1.5-fold (Altshuler et al., 2008). For an odds ratio of 1.1, the variant will be found in 11 individuals who have the disease for each 10
controls who do not. Gene variants also appear to be associated with more than one trait (known as pleiotropy) (Trzaskowski et al., 2013). However, the total phenotypic variation
explained by observed associations tends not to exceed 10-20%, less than the heritability implied by twin studies. This has led to the proposal that there is ‘missing heritability’
10
heritability: Yang et al. (2010) introduced the method of genome-wide complex trait
analysis (GCTA). In GCTA, the genetic similarity between individuals is assessed not by
family relatedness but by number of shared single nucleotide polymorphisms (SNPs; these are differences in a single ‘letter’ of the genetic code). This between-individual
genetic similarity is then used to predict phenotypic variance. Using this approach, Benyamin et al. (2013) found that the similarity between SNPs could explain between 22
and 46% of phenotypic variation in childhood intelligence in three large cohorts totaling 18,000 individuals aged between 6 and 18 (see also Plomin et al., 2013). Despite this
encouraging result, when it comes to cognitive and behavioral phenotypes rather than complex diseases, GWAS have generally struggled to find significant associations with
markers of genetic variation, possibly suggesting a greater problem with missing
heritability for these phenotypes than medical disease (Ronald, 2011). Rietveld et al. (2013) recently used a GWAS to identify SNPs predicting variation in educational
achievement in a large sample of 120,000 individuals. Together, the identified markers of genetic variation predicted around 2% of variation in educational achievement, compared
to around 10% in a similar study of height (Speliotes et al., 2010). This led the authors to
propose that the genetic architecture of complex behavioral traits may be more diffuse than that of complex physical traits.
GWAS are not ideal for detecting the contribution of rare variants to disease, since by
definition these will have low frequency in the population, thereby compromising the statistical power to detect associations. There is increasing evidence that rare copy
11
phenotypic variation. For example, the contribution of rare CNVs and de novo mutations
has been identified in cases of autism (e.g., Levy et al., 2011) and schizophrenia (e.g.,
Kirov et al., 2012; The International Schizophrenia Consortium, 2008).
1.2 The puzzle of gene-behavior associations
From one perspective, it is surprising that it is possible to detect any associations between
individual gene variants and high-level behavior.1 This is for two reasons: the remoteness
of these levels of description, and the fact that behavior is the outcome of an extended
developmental process involving interaction with a variable environment. We expand on
each of these points in turn.
With respect to remoteness, the genetic level of description here pertains to variation
between individuals in the DNA code which codes for the production of proteins in cells,
while behavior pertains to the whole organism as a single system embedded in a physical
and social context. The heritability of individual differences in behavior tells us that there
are genetic effects, but unpacking the causal pathways through which they operate on
behavior is a daunting prospect. Genetic effects on cognition must, presumably, operate
via their effect on neurocomputation and/or network topology. However, two examples
suffice to illustrate the complexity of the problem at hand.
1Under the hypothesis that common variants contribute to normal variability. It is less
12 First, a gene codes for a protein; Plomin et al. (2008) pointed out that each synapse is
affected by more than a thousand protein components. Understanding the factors that
cause variations in the efficiency of the synapse is still a long way from understanding
even a functional neural circuit, let alone brain networks generating behavior. There must
be many points of convergence of genetic variation as one ascends levels of description.
Moreover, recent research has pointed towards the complexity of the process by which
genes contribute to cellular function, identifying their role as part of a dynamical system
that includes multiple points of regulation of gene expression, such as modification of
messenger RNA, DNA methylation and histone modification (Charney, 2012).
Second, Sapolsky (2005) outlined the multiplicity of low-level variations that one might
conservatively expect to contribute to the functioning of neural circuits: at the level of
individual neurons, one might expect variation between individuals in the number of
dendritic spines, the number of axon terminals, the level of resting potentials, the size of
the dendritic wavelet caused by pre-synaptic activity, the excitability of the axon hillock,
and the speed of propagation of the axon potential; at the level of two neurons
communicating, one might expect individual variations in the amounts of
neurotransmitter released, the numbers of receptors, the efficiency of receptors in binding
neurotransmitters, the efficiency of producing neurotransmitters, the efficiency of
producing receptors, and the proportions of different types of receptors; at the level of
long-term potentiation, one might expect variation between individuals in how much
glutamate neurotransmitter is released, the number of glutamate receptors, the ratio of
13 phosphorylation of the receptors. It is possible that a range of gene variants contribute to
each of these neural parameters. It does not follow that all these variations would
necessarily be meaningful, and development must in some sense be robust to variations in
such low-level properties to be successful. Nevertheless, finding significant associations
between individual gene variants and high-level behavior through this conflagration of
causal processes is both impressive and somewhat unexpected; and perhaps even more
so, given that genotyping data and behavioral data are both likely to contain measurement
error.
With respect to development, cognitive abilities are the outcome of an extended and
dynamic developmental process involving interaction with the physical and social
environment, an environment that the individuals themselves play a role in specifying
(Flynn et al., 2013). The environment also varies, contributing to individual differences in
behavior. The nature of the developmental process itself is considered to be an important
component of the explanation of cognitive variability (Karmiloff-Smith, 1998). This is
illustrated by the fact that relationships between genotypes and phenotypes are not stable
across development, even for neurogenetic developmental disorders. For example,
Paterson et al. (1999) found that the relative pattern of cognitive strengths and
weaknesses in Down syndrome and Williams syndrome altered between infancy and
adulthood; that is, the effects of the respective genetic mutations depended on what stage
of development the phenotype was measured. Association studies only give an askew
picture of the developmental process because they rely on differences between
14 studied with association studies by examining whether the associations between gene
variants and individual differences in behavior are stable across development, or whether
associations reduce or increase (Ronald, 2011). Changes in gene expression are expected
since they are a key component of development. However, the actual relationship
between individual differences and development as mechanistic processes (Bechtel,
2011) has yet to be determined, and quite diverse hypotheses are still in play. For
example, within the study of cognition, there are competing theoretical proposals that
range from the idea that individual differences and development represent variations
along orthogonal mechanistic dimensions, to the idea that they are variations over the
same dimensions (see, Thomas & Karmiloff-Smith, 2003a, for discussion). For example,
under one hypothetical scenario (borrowing proposals from the psychology literature), it
might turn out that individual differences are generated by differences in inhibitory
control, while development corresponds to changes in processing capacity; here the
dimensions would be orthogonal. Under an alternative hypothetical scenario, both
individual differences and development might represent variations in processing speed;
here there would be a single common dimension. Now, if the dimensions are orthogonal,
then the study of individual differences will tell us little about the developmental process;
but if they are common, the study of individual differences will provide a direct window
onto the developmental process.
From a computational modeling perspective, development and individual differences
have rarely been considered within the same framework (see Garlick, 2002, for an
15 models that specify mechanisms of experience-dependent learning usually attempt to
capture the development of the ‘average child’, while models of individual differences
usually focus on the intrinsic and extrinsic factors contributing to the variation at a single
age, excluding the developmental origins of behavior. There is a pressing need to begin to
consider development and individual differences within a common computational
framework.
1.3 Using multi-scale models to understand the implications of associations between
levels of description
In principle, multi-scale modeling can complement genetic association analyses by
demonstrating how, in a system where multiple levels of description are implemented,
associations from low to high levels of description reflect the causal mechanisms best
characterized as operating at the intermediate levels. In practice, the contribution of a
given multi-scale model depends on the constraints it embodies at different levels, the
interfaces it specifies between levels, and the set of simplifying assumptions.
The notion of ‘level’ here is somewhat tricky, because it combines several distinctions.
These include intra-personal versus extra-personal (e.g., brain processes versus the
environment); levels of a mechanism that characterize the combination of smaller
components into larger components; and levels of analysis in describing a phenomenon
(e.g., one might describe a real neural network as performing a computational function)
(see, e.g., Bechtel, 2008; Bechtel & Mundale, 1999; Craver, 2007; Eliasmith, 2002, 2013;
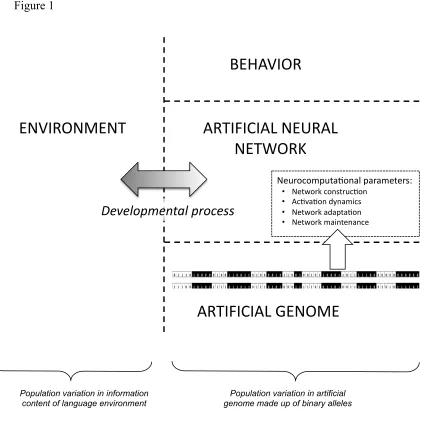
16 each of these ideas, but our main theoretical reference point is the causal modeling
approach proposed by Morton (2004) to understand the causes of developmental
disorders. In this approach, the individual is distinguished from the environment; within
the individual, Morton then distinguishes biological, cognitive, and behavioral levels. In
our multi-scale model, the biological level is represented by a genetic level, the cognitive
level is represented by neurocomputation, and the behavioral level is represented by the
output of the model (see Figure 1).
To construct the current multi-scale model, we began by taking advantage of the fact that
artificial neural networks have been used as models of cognitive development (see, e.g.,
Elman et al., 1996; Mareschal & Thomas, 2007). Behavioral change is captured as the
outcome of an experience-dependent developmental process taking place in a structured
learning environment. These models therefore allow us to separately characterize
behavior and the structure of the learning environment. Artificial neural network models
are based on abstractions of neurocomputation, and include parameters that are analogous
to neurocomputational properties. Moreover, the networks encode knowledge by
changing their structure, in terms of their connectivity. We can therefore discern the
intra-personal properties of neurocomputation and network structure. Lastly, using
methods from genetic algorithms within machine learning, the parameters of the artificial
neural networks can be encoded in an artificial genome. Variations in the genome specify
variations in network parameters, which then influence learning ability. We therefore
posit a lowest level of artificial genome. The artificial genome is part of the biological
17 that is the neural network. This sets the stage to investigate associations that span levels
of description.
In order for us to simulate association studies, two further steps were necessary. First,
such studies take place at a population level. Therefore we needed to simulate a
population of artificial neural networks undergoing development (see Thomas,
Baughman, et al., 2012; Thomas, Knowland & Karmiloff-Smith, 2011). Second,
association studies rely on variability. We created both genetic and environmental
sources of variation to produce variability in acquired behavior. These methods ensured
that we could consider association analyses within a developmental framework: the
associations between individual differences in the artificial genome and individual
differences in behavior could be assessed at any point in development, whilst
simultaneously capturing the developmental origins of behavior via an
experience-dependent process. This was the principal innovation of our model.
The aim of our multi-scale model was to investigate associations between levels of
description, such as genes to behavior, genes to network structure, and
neurocomputational parameters to behavior. In particular, because the mechanistic
assumptions of the model were known and its operation was relatively transparent, the
model could inform the extent to which gene-behavior associations gave an accurate
picture of neurocomputational causal processes operating at the intermediate level. For
18 influences on the operation of two neurocomputational parameters, do we observe
additive statistical effects of these genes in their associations to behavior?
Given the assumptions of the model, the simulations addressed the following specific
questions: (1) Can statistically significant associations be observed between artificial
gene variants and individual differences in behavior, given many-to-one
gene-to-neurocomputational parameter mappings and an intervening experience-dependent
developmental process? (2) Do such associations show specificity to different behaviors
generated by the system or are they general? (3) What is the stability of the associations
over developmental time – are associations modulated by the developmental process? (4)
Do associations replicate across populations? (5) Are associations observed from
artificial genome to network structure and activation levels, and if so, are these the same
as the associations observed from artificial genes to network output (behavior)? (6) Are
associations modulated by the quality of the environment, producing gene x environment
interactions? (7) Can interactions between genes be observed in the way that they
influence behavior? (8) When all sources of variability are known, is all the population
variance explained or is some ‘missing’? We then discuss whether observed cross-level
statistical associations accurately reflected the causal operation of the model.
2. Method
The model we utilized to simulate gene-behavior associations was taken from the domain
of language development, and has been successfully used to simulate socio-economic
19 sub-types of language delay (Thomas & Knowland, 2014). The model was addressed to
the domain of English past tense formation. Here, we employed the model in an
illustrative setting. The model is intended only as an example of a developmental system
applied to the problem of extracting the latent structure of a cognitive domain through
exposure to a variable training environment. Past tense has been used similarly to study
phenomena such as critical periods in development (Marchman, 1993) and
developmental regression in autism (Thomas, Knowland & Karmiloff-Smith, 2011). The
English past tense provides a useful sample domain because it is quasi-regular. It is
characterized by a majority of past tenses that follow a productive rule (add ‘ed’ to the
verb stem) but a minority of exceptions to this rule, forming their past tenses in a variety
of ways. Performance on regular verbs and irregular verbs form two different behaviors
that the system must acquire. A range of empirical research indicates that children’s and
adults’ performance on regular and irregular verbs differs in its characteristics,
sufficiently so that some have argued that different processing mechanisms are needed to
acquire the verb types (e.g., Pinker, 1994). The two types of behavior allow us to test the
specificity of associations between artificial genes and behavior.
In the following sections, we first outline the base model. We then consider the
implementation of constraints at each level: Environment, Behavior, Network structure
and activation, Neurocomputation, and Artificial Genome. Finally, we outline the
simulation design. Further implementation details can be found in Supplementary
20
2.1 Base model
A 3-layer, backpropagation network was used to learn to map between a phonological
representation of verb stems and their past tense forms. The architecture is shown in
Figure 1.
The results we report come from the simulation of 6000 artificial neural networks. Some
simplifications of network scale were employed for computational tractability. First, an
artificial language was used rather than a corpus of real English verbs, per the work of
Plunkett and Marchman (1991, 1993). The training set comprised an artificial language
constructed to reflect many of the important structural features of English past-tense
formation. Artificial verbs were monosyllabic and encoded used articulatory
feature-based codes drawn from English phonology. Second, the model employed a simplified
architecture in restricting mappings to be between phonological codes. More recent,
larger scale models have included additional information in the input, such as lexical
semantic information (e.g., Joanisse & Seidenberg, 1999; Woollams et al., 2009), and
acquire multiple inflectional paradigms rather than just the past tense of verbs (e.g.,
Karaminis & Thomas, 2010). These simplifications are not relevant given the abstract
aims of the model.
<Insert Figure 1 about here>
The training set was the “phone” vocabulary from Plunkett and Marchman’s past tense
model (1991, p. 70). There were 508 monosyllabic verbs, constructed using
21 binary articulatory features (Thomas & Karmiloff-Smith, 2003b), a distributed encoding
based on standard linguistic categorizations (Fromkin & Rodman, 1988). Separate banks
of units were used to represent the initial, middle, and final phonemes of each
monosyllable. The output layer incorporated an additional 5 features to represent the affix
for regular verbs. Networks thus had 57 input units and 62 output units. There were four
types of verbs in the training set: (1) regular verbs that formed their past tense by adding
one of the three allomorphs of the +ed rule, conditioned by the final phoneme of the verb
stem (examples from English: tame-tamed, wrap-wrapped, chat-chatted); (2) irregular
verbs whose past-tense form was identical to the verb stem (e.g., hit-hit); (3) irregular
verbs that formed their past tenses by changing an internal vowel (e.g., write-wrote; (4)
irregular verbs whose past-tense form bore no relation to its verb stem (e.g., go-went).
There were 410 regular verbs, and 20, 68, and 10, respectively, of each irregular verb
type. A generalization set was also created with 410 novel verbs, each of which rhymed
(shared two phonemes) with an existing regular verb. Generalization was assessed by the
accuracy of outputting the regularized past tense form. Networks learned by repeated
presentations of the training set, with verbs presented in random order, and operation of a
gradient-descent supervised learning algorithm (backpropagation). One presentation of
the training set is referred to as an ‘epoch’. All networks were trained for 1000 epochs.
2.2 Environment
The environmental level was defined as an extrapersonal influence on development. Each
network simulated a child raised in a given family, and families were assumed to vary in
22 extent according to socio-economic status (SES) (Hart & Risley, 1995). A training set
was created for the past-tense information available in each family environment. SES was
implemented through generating a family quotient for each simulated child. The family
quotient was a proportion between 0 and 100%. This value was used as a probability to
determine whether each verb in the full training set would be included in the family’s
vocabulary. The family training set was then fixed throughout development. Performance
was always assessed against the full training set (analogous to a standardized test of
past-tense formation applied to all children). The family quotient manipulation corresponded
to a reduction in type frequency for both regular and irregular verbs. Based on the
findings of Thomas, Forrester, and Ronald (2013) on the appropriate range of intrinsic
versus extrinsic variation to capture data on past tense acquisition, family quotients were
sampled from a uniform distribution from 60% to 100% of the perfect training set,
corresponding to learning environments with reasonably high quality. This translates to
the assumption that there is at least a minimum amount of linguistic information typically
available to a child.
Note that, in principle, the extrapersonal environment may also play a role in influencing
the value of neurocomputational parameters across child development, for example via
prenatal maternal nutrition, post natal diet, stress, and other effects on brain development
(see Hackman, Farah & Meaney, 2010; Thomas, Forrester & Ronald, 2013, for
discussion). Whether environment primarily affects neurocomputational properties or the
23 SES. For the purposes of the current model, we restricted extrapersonal environmental
effects to information.
Environments were determined independently of artificial genomes. That is, we assumed
no gene-environment correlations in our initial simulations.
2.3 Behavioral level
The past tense was an advantageous illustrative domain because the same processing
system acquired both regular verbs and irregular verbs (Rumelhart & McClelland, 1986).
The dimension of regularity permitted consideration of the specificity of simulated
gene-behavior associations: were observed artificial gene-gene-behavior associations always the
same for regular verb performance as irregular verb performance or could they differ?
Some degree of specificity might be predicted because it is known that in artificial neural
networks, the two verb types are differentially sensitive to variations in the
neurocomputational parameters (Kello, Sibley & Plaut, 2005; Mareschal et al., 2007;
Thomas & Karmiloff-Smith, 2003b). Results will focus on the contrast between regular
verb performance and performance on the most common irregular verb type,
vowel-change irregulars.
2.4 Network structure and activation
When used as cognitive models, artificial neural networks are fairly rudimentary in terms
of neural realism. Nevertheless, they can still offer some suggestive ideas on the relation
24 properties showed similar developmental trajectories to those observed in, respectively,
global gray matter volume and global white matter volume: total number of connections,
and total magnitude of connection strength (both excitatory and inhibitory). This analogy
is of course, tentative. There is more in both gray and white matter than connections.
However, as well as cell bodies, gray matter does include facilities for local connectivity
(dendrite arbors, synapses); and white matter includes myelin that enhances axonal
conductance, reflecting activity-dependent strengthening of long-range connections. The
analogy between properties of the model and these two types of brain matter is based on
their respective developmental profiles (Gogtay et al., 2004; Shaw et al., 2008). After the
onset of pruning, gray matter and number of connections in the model both show an
exponential decline, while both white matter and total connection strength show a linear
increase. In the model, number of connections offers plasticity, such that the network’s
ability to change reduces as pruning takes place, in line with sensitive periods observed in
the cognitive system (Thomas & Johnson, 2006); while increasing connection magnitude
reflects experience-dependent strengthening, in line with white matter changes that are
observed during skills acquisition (Bengtsson et al., 2005; Scholz, Klein, Behrens &
Johansen-Berg, 2009). These two metrics, total number of network connections and total
connectivity magnitude, served as our indices of network structure, measured
independently of behavior.
In addition, we took a measure of the activation states within the network. Individual
networks varied in the number of hidden units they possessed. The average activity
25 units in that network) was calculated, either over items in the training set or over items in
the generalization set.
2.5 Neurocomputation
Artificial neural networks contain a range of parameters that increase or decrease their
ability to learn a given training set. Parameters such as learning rate, momentum, and
number of hidden (internal) processing units feature in most published simulations. In
models of normal/average development, parameters are optimized to achieve best
learning (usually in the presence of the perfect training set). In the current model, a
number of parameters were simultaneously varied across individual networks, with
learning ability determined by their cumulative affect. Multiple parameters were varied at
the same time to reflect the expectation articulated by Sapolsky (2005) that many
low-level neural properties are likely to vary between individuals. Variations occurred over
fourteen computational parameters, in principle allowing for over 2 trillion unique
individuals. Parameters determined four broad properties of the artificial neural networks:
network construction, network dynamics, network adaptation, and network maintenance.
In line with the arguments of Plomin and Kovas (2005), the parameters had general
computational functions, and no specific relation to the problem domain that the system
was acquiring. The parameters were as follows. Network construction: Architecture,
number of hidden units, range for initial connection weight randomization, and
sparseness of initial connectivity between layers. Network dynamics: unit threshold
26
adaptation: backpropagation error metric used in the learning algorithm, learning rate,
and momentum. Network maintenance: weight decay, connectivity pruning onset,
pruning probability, and pruning threshold. These parameters have derivations in
neurocomputational theory, and differences in their settings have been used in models to
simulate variations in cognition, including those found in general intelligence, specific
language impairment, dyslexia, schizophrenia, autism, and ageing (see Supplementary
Materials for description and citations). A range of variation in the population was
established for each parameter (see Supplementary Materials for details of the calibration
procedure, as well as plots of the sensitivity of network performance to variations in each
parameter). Model performance was fairly robust to variations in each parameter:
calibration was carried out to establish extremes.
2.6 Genetic level
An artificial genome was created, variation in which produced variation in the
neurocomputational parameters. We assumed that a full genome would contain three
portions, of which we only implemented one. The first portion would be genes not
relevant to the functioning of our modeled system (though if measured in a GWAS,
variations in these genes would be candidates to produce false positive associations). The
second portion would be genes that were species universal and did not vary across
individuals, and whose on-going dynamics of expression and regulation delivered the
functionality of the network itself, in terms of the existence of processing units,
connections, activation dynamics, the sensorium, the input-output connectivity, and the
27 that were influential in the initial growth of the network, and which influenced
particularly the effective computational properties of the system once its
experience-dependent properties came on-line. The neurocomputational properties were therefore
conceived of as the outcome of a growth process, in the way that the number of neurons
in different brain areas is the outcome of neural proliferation and migration. This portion
of the genome was assumed to show variation across individuals, and was the only
portion we implemented. For simplicity, we assumed that the relevant genes were the
sole source of variance in the growth of neurocomputational parameters (i.e., contributing
biochemical environmental factors were constant across individuals) and that the
relationship was non-stochastic. We stipulated that multiple genes would contribute to the
setting of each parameter (polygenicity), but did not implement pleiotropy, where a single
gene could contribute to the setting of more than one parameter. The values of the
neurocomputational properties for each individual were encoded in the artificial genome.
The idea of encoding the properties of a computer program in the form of an artificial
genome is familiar from the machine learning technique of genetic algorithms. Genetic
algorithms are a method of optimizing computer programs by breeding generations of
programs and selecting the ‘fittest’ (according to performance on the target problem) to
populate the next generation (see Mitchell, 1997, for introduction). In principle, genetic
algorithms can be applied to any computer program. The minimal requirement is that the
parameter settings for the program (here, artificial neural network) must be encodable in
a genome, and every version of the genome created by mechanisms that induce genetic
28 that obeys the syntax of the computer language. The combination of artificial neural
network models, genetic algorithms, and population modeling has been used extensively
to consider how evolution may serve to optimize properties for learning, for instance in
the domain of language (e.g., Batali, 1994; Reali & Christianson, 2009).
For the current model, we encoded the values of the 14 neurocomputational parameters in
an artificial genome and then produced a population of 1000 individuals with randomly
created genomes. We did not produce further generations via breeding and selection, with
one exception: in related work, we used breeding alone to create monozygotic and
dizygotic twin pairs from the initial population. This allowed us to simulate twin study
designs and thereby assess the heritability of various properties of the population, such as
behavior and network structure (Thomas, Forrester & Ronald, in preparation; see Kohli,
Magoulas & Thomas, 2012, for further discussion of the technique).
The artificial genome contained several simplifications. Our starting point was to create
conditions that allowed a fair opportunity to observe gene-behavior associations. We
therefore created a population where genetic variation rather than environmental variation
was responsible for the majority of individual differences in behavior (i.e., behavior was
highly heritable); and we allowed gene variants to be common, so that there was no
reduction in statistical power associated with rare variants. Artificial genes were binary
digits, holding the value 1 or 0. Thus there were only two variants of each gene. We
consider populations where these variants were equally frequent (so the initial population
29 each); or where one variant was more common than the other (either: 1-valued alleles had
70% probability and 0-valued alleles 30% probability, or the reverse). Several binary
genes encoded the value of each parameter, with more binary genes employed where a
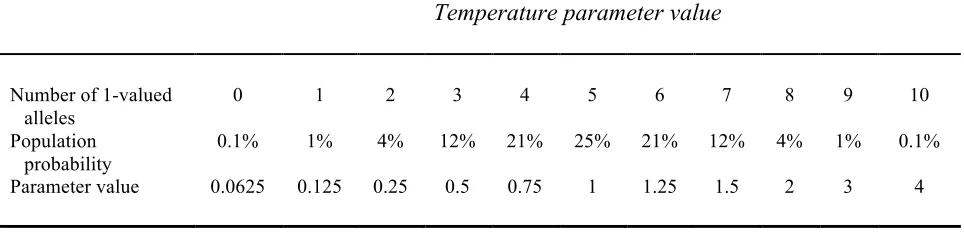
parameter took up a wider range of values. For example, the unit threshold function was
encoded over 10 binary genes. The binary gene set was converted into a parameter value
using the following method. The number of 1-valued alleles was summed. A look-up
table was then used to convert the sum to a parameter value. Tables were constructed
such that increasing sums corresponded to monotonic changes in the parameter.
Intermediate valued sums corresponded to the average value of the parameter, and lower
or higher sums corresponded to more extreme settings of the parameter in either direction
from the average. An example of the lookup table for the unit threshold function is
included in Figure 3. The full set of lookup tables is included in the Supplementary
Materials.
The polygenic, binary coding of parameters ensured that average values were most
common in the population, and more extreme values less common. Lookup tables were
constructed to ensure that parameter changes above or below the average value
corresponded to symmetric improvements or decrements in behavior. This meant that
parameter value changes were not always linear. For example, the ‘average’ number of
hidden units, ensuring a mediocre rate and final level of development, was 50 (with all
other parameters at average values). Reducing this value to 30 caused poor development,
but an equivalent improvement above average required an increase to 200. Such a
30 thus the best chance of observing these effects in single gene-behavior associations
(Thomas, Forrester & Ronald, in preparation).
The artificial genome comprised 126 bits (split into two strings or chromosomes of 63).
The numbers of binary genes per parameter were: hidden units: 10; unit threshold
function: 10; processing noise: 8; learning rate: 12; momentum: 8; weight variance: 8; architecture: 6; learning algorithm error metric: 4; response threshold: 10; pruning onset:
10; pruning probability: 8; pruning threshold: 10; weight decay: 10; sparseness: 12. These
values were determined during a calibration phase in order to accommodate different ranges of variation for the respective parameters in how they influenced behavior (though
in principle, the number of genes per parameter could be held constant).
2.7 Simulation Design
Six populations of 1000 networks were run. In each case, (i) artificial genomes were
generated at random; (ii) each genome was converted into an instantiated network; (iii) a
family training set was created for the individual; and, (iv) development was tracked for
1000 epochs (presentations of the training set). The majority of results are reported from
the first population, where the gene variants at each location on the artificial chromosome
were equally frequent. We then considered five further populations in order to evaluate
the replicability of artificial gene-behavior associations. First, we took the same set of
genomes and exposed the networks to different environments. Second, we re-sampled the
genomes with random binary values, but used the same lookup tables and therefore
31 these networks to different environments. This was carried out twice to create two
resamplings. Fourth, we re-sampled the genomes but now changing allele frequencies,
with the 1-valued allele given 70% probability and the 0-valued allele 30%. The same
look-up tables were used to convert artificial genomes to neurocomputational parameter
values. Last, we re-sampled the genomes, but with the 1-valued allele now given 30%
probability and the 0-valued allele 70%.
3. Results
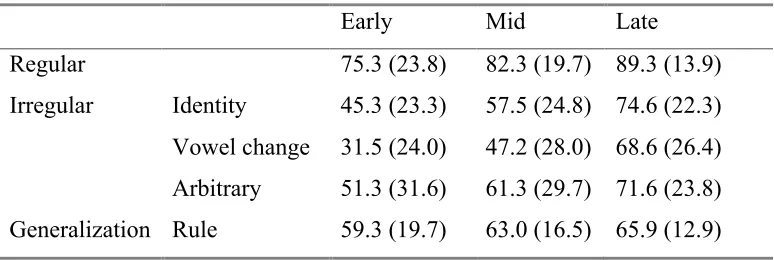
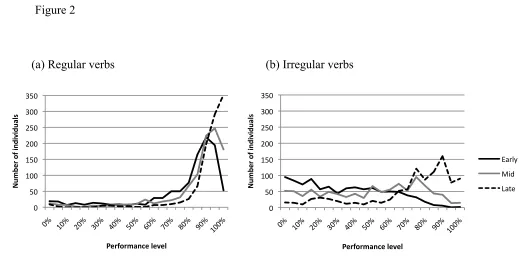
We first consider the variability present in the behavior of the population. Figure 2 shows
the population distribution of performance on regular and irregular verbs at three points
in training, which we will refer to as early (50 epochs), mid (100 epochs), and late (750
epochs) in development. These points were chosen to capture different developmental
phases, but before performance had entrenched at its final performance level. Table 1
shows the mean performance level and standard deviation for each past tense verb type at
each measure point. These are the data at the behavioral level. At the genetic level, the
artificial genome constituted 126 binary values per individual, for 1000 individuals. For a
given point in development and a given behavior, a correlation could be computed
between the value of each artificial gene (1 or 0) and the target behavior. In what follows,
we report the variance explained by the association (that is, the square of the correlation).
Associations had to exceed a certain size to be rated greater than chance. This threshold
was determined via bootstrap methods, by repeatedly generating a random gene (with
two possible values, 0 and 1) and associating variations in this gene to the target measure.
32 by chance. Ninety-five percent and 99% confidence intervals could then be generated for
this distribution to identify the association sizes that would occur by chance less either
than 1 in 20 times or 1 in 100 times. A similar approach was used to compute how large a
difference between two associations had to be before it could be viewed as significant.
For most target measures, the 0.05 criterion corresponded to an effect size of around
0.5% and the 0.01 criterion to an effect size of around 0.75%. At these levels, for each
100 other unrelated genes on the (unimplemented wider) genome that one associated with
the behavioral or structural measure, 5 would be expected give false positive associations
at the .05 level and 1 would be expected to give a false positive association at the .01
level. We could have used more sophisticated methods that corrected for multiple
comparisons but chose not to, first for the sake of simplicity, and second because the
sources of variation in the modeled system were well understood.
<Insert Table 1 and Figure 2 about here>
Figure 3 shows the possible associations between different levels of the model, for one
neurocomputational parameter, the unit threshold function or ‘temperature’. Figure 3(a)
shows the relationship between the parameter value and behavior on irregular verbs
established during calibration. Like many neurocomputational properties, the relationship
is non-linear. Figure 3(b) shows this relationship when plotted from the full population,
with unequal frequencies of parameter values and all other parameters varying, in this
case at the early point of development. Extreme values of the parameter were relatively
33 convert the binary genes to the parameter value. Figure 3(d) shows the associations that
were then observed between genes and behavior, when behavior was plotted according to
genotype.
We now turn to our equivalent of a GWAS, examining effect sizes across the full 126-bit
artificial genome. We report the results relevant to our 8 questions.
<Insert Figure 3 about here>
3.1 Can statistically significant associations be observed between artificial gene variants
and individual differences in behavior, given many-to-one gene-to-neurocomputational
parameter mappings and an intervening experience-dependent developmental process?
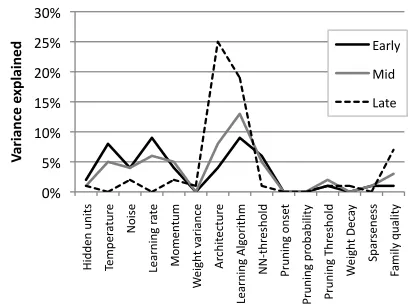
Figure 4 depicts the association size between the neurocomputational parameter values
and behavior, using individual linear regressions. It demonstrates there are large effect
sizes, which are modulated both by behavior type (regular vs. irregular mappings) and
over development. Were these associations observable at the level of artificial genes?
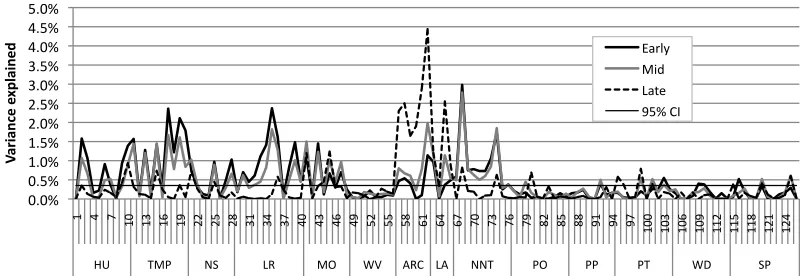
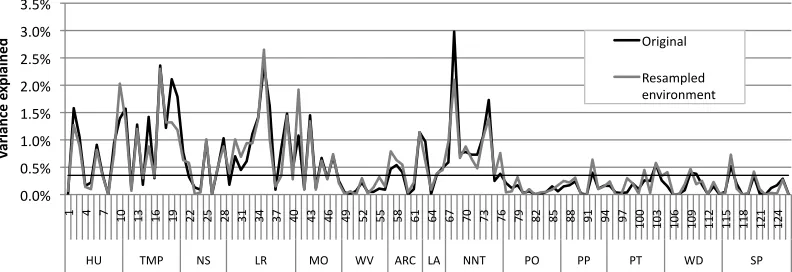
Figure 5 shows associations between genome and behavior, again split by regular and
irregular verb type, and for three points in development. Ninety-five per cent confidence
intervals on effect sizes were produced by generating a random binary allele for each
individual and using this to predict the individual’s behavioral score; this procedure was
repeated 1000 times to generate a distribution of effect sizes; the distribution was used to
derive the effect size value that would be produced by chance less than 1 time in 20. The
34 A number of gene-behavior associations were indeed observable, despite the fact that the
genes acted only on parameters in a many-to-one fashion and that behavior was the
outcome of a variable developmental process. Early in development, for regular verbs
there were 33 reliable associations from artificial genes to behavior at p<.05 and 24 at
p<.01 out of a possible 126. For irregular verbs, there were 40 reliable associations at
p<.05 and 26 at p<.01. By chance, 6 or 7 would be expected at .05 and 1 or 2 at .01.
Across all three stages of development, effect sizes ranged from 0 to 4.4% of the variance
(mean effect size: 0.4% standard deviation: 0.6%); 91 of the effect sizes fell between 0
and 0.5%, 19 between 0.5 and 1.0%, 8 between 1.0 and 1.5%, and 8 were greater than
1.5%. Larger effect sizes were seen on regions of the artificial chromosome influencing
the neurocomputational parameters which themselves showed larger effect sizes on
behavior in Figure 4. On the whole, a substantial number of small effect sizes were seen
in the associations between artificial gene variants and behavior, despite the interceding
developmental process.
Artificial gene variants were also assessed by their ability to predict whether an
individual would fall in the top 10% or bottom 10% of the population by rank (simulating
precocious or delayed development). Individual artificial gene variants altered the
likelihood of falling in the tails of the population distribution by a maximum of 2.89
times (mean: 1.15, standard deviation: 0.16); 56 of the ratios were between 1 and 1.1, 35
between 1.1 and 1.2, 20 between 1.2 and 1.3, and 15 were greater than 1.3 (recall, an
35 every 10 with the variant who will not). Thus artificial gene variants could predict
performance in the tails, with relatively modest odds ratios.
<Insert Figures 4 & 5 about here>
3.2 Do associations show specificity to different behaviors generated by the system or are
they general?
We compared associations to performance on regular verbs and irregular verbs, early in
development. Once more, bootstrapping methods were used to derive 95% confidence
intervals on the differences between effect sizes. Out of the 126 possible associations,
there were 37 that differed significantly in effect size at p<.05 between the two types of
behavior, 10 where effect sizes were larger for regular verbs, and 27 where they were
larger for irregular verbs. Twenty-seven differences were significant at p<.01, 10 where
effect sizes were larger for regulars and 17 where effect sizes were larger for irregulars.
Thus, despite the general nature of the neurocomputational parameters, and the absence
of processing structures specific to the types of behavior, associations from artificial
genes to behavior could demonstrate specificity to behavior type. However, the majority
of associations were not significantly different across the two behaviors, in line with the
fact that these behaviors were generated by the same network structure.
3.3 What is the stability of the associations over developmental time?
Associations changed over development. Focusing on regular verbs, between early and
mid development, there were 12 significant differences in effect size at p<.05 out of a
36 development, 5 were cases where they were larger in mid development. Only 3
developmental changes in associations were reliable at p<.01, all larger early in
development. A comparison between early and late development revealed 33 reliable
differences in effect size at p<.05, 14 where effect sizes were larger early and 19 where
they were larger late. There were 20 differences reliable at p<.01, 7 where effect sizes
were larger early, 13 where they were larger late. Thus associations between artificial
genes and behavior could both decrease and increase across development within the
model.
Figure 4 indicates that developmental sensitivity was also apparent in the associations
between neurocomputational parameters and behavior, with some associations
strengthening across development and some weakening. Within a given
neurocomputational parameter, the rank order of performance between individuals with
different settings of the parameter value was generally stable across development.
However, it was possible to find cases where individuals with one parameter value scored
higher than individuals with another parameter value earlier in development, while later
the order was reversed. For example, after 30 epochs of training, the 212 individuals with
the temperature value of 1.25 scored higher on irregular verbs than the 254 individuals
with a temperature value of 1.00 (23.9% versus 21.6% accuracy), while by epoch 200 the
pattern of performance had reversed (60.6% versus 63.8%; interaction of epoch x
parameter value: F(1,464)=8.31, p=.004, effect size ηp2 =.018). The behavioral advantage
to an individual of possessing a given neurocomputational parameter value could,
37
3.4 Do associations replicate across populations?
Figure 6 displays between-level associations when the same set of artificial genomes was
instantiated as a new set of networks, and trained in new randomly sampled
environments. The figure incorporates the effect sizes between neurocomputational
parameters and behavior, and between artificial genes and behavior. We picked one of
the behavior types, irregular verb performance, and one developmental stage, early, for
our comparisons. There was a fairly close replication of associations at both levels. For
artificial gene-behavior associations, there were only 8 significant differences at p<.05
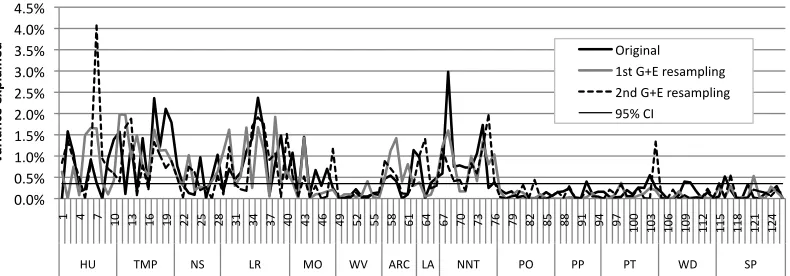
and 3 at p<.01, close to chance levels. Figure 7 depicts the same plots when a new set of
artificial genomes was sampled, with the same allele frequencies and parameter
frequencies across the population; these new genomes were instantiated as networks and
trained in new environments. Figure 7 includes two such resamplings. Here, the
replication was fairly good at the neurocomputational-to-behavior level, but poorer at the
artificial gene-to-behavior level. For the first resampling, 39 associations were
significantly different at p<.05, and 17 were significant at p<.01, out of 126. For the
second resampling, 36 associations were significantly different from the original at p<.05
and 20 different at p<.01. Figure 8 depicts the situation where allele frequencies were
changed, either making the 1-valued allele more frequent than the 0-valued (70:30), or
less frequent (30:70). Once more, a population of genomes was generated, instantiated as
networks, and trained in new environments. Replication was now poor for both
neurocomputation-to-behavior and gene-to-behavior associations. For the latter, there
38 and 33 at p<.01. There were 41 significant differences between the original and the 30:70
population at p<.05 and 30 at p<.01. In sum, replication was variable, depending on the
details of the resampling, and the levels between which associations were observed.
<Insert Figures 6, 7 and 8 about here>
3.5 Are associations observed from artificial genome to network structure and activation,
and if so, are these the same as the associations observed from genes to behavior
(network function)?
Figure 9 shows associations between the artificial genome and two indices of network
structure, the total magnitude of network connectivity, and the total number of connection
weights, for early in development. Associations for irregular verb behavior (network
function) are also included for comparison. Large effect sizes were apparent for both
magnitude and number, with 28 and 15 associations significant at p<.01, respectively.
When these two structural indices were compared with the effect sizes for irregular verb
behavior at the same point of development (which had 26 reliable associations at p<.01),
there were 41 and 35 significant differences at p<.01, for magnitude and number,
respectively. In other words, for connection magnitude, 13 associations were shared with
behavior and 41 differed, while for connection number, 6 were shared and 35 differed.
Thus, the majority of the associations between artificial genes and network structure, and
between artificial genes and behavior (network function), were separate – even though it
39 This is perhaps not surprising given the correlations between these structural indices and
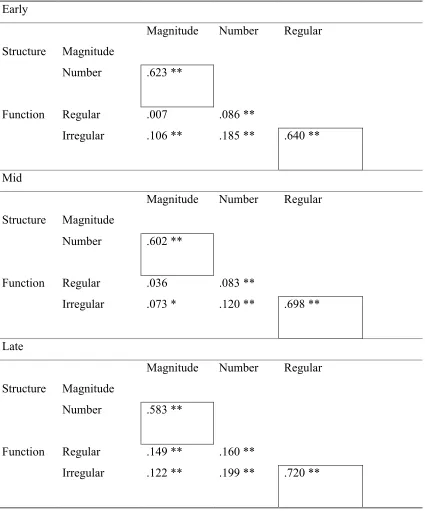
behavior. Table 2 shows the correlation matrix for structural (number and magnitude of
connections) and functional (regular, irregular performance) indices for early, mid, and
late in development. It reveals a pattern of strong correlations within structural indices
and within functional indices, but weak correlations between structural and function
indices. This pattern has also been observed in empirical studies (example data from
Posthuma et al., 2003, are included in Table 3 for comparison). In the model, while, to
some extent, more total connections necessarily entails greater total connection strength,
the correlation is not guaranteed. Several factors can modulate the relationship. These
include differential loss of connections through pruning, differential decay of connection
strengths, differential strengthening of connections due to variations in learning
environments, and the differential effect of other parameters that modulate how learning
experiences strengthen the connections. Together, these factors can all serve to weaken
the initial correlation between the two structural measures. This is confirmed in Table 2,
which demonstrates how their correlation weakens over development.
We next assessed the correlation across individuals between measures of network
structure and network activation, where the latter was calculated by the average hidden
unit activation levels produced while generating behavior.2 Hidden unit activation states
were very similar when processing items in the training set and items in the
generalization set (a correlation of 1.00), though greater activity was induced in networks
by novel items than by items in the training set (training set: mean = .295, standard
2
40 deviation = .159; novel: mean = .328, standard deviation = .179; t(897) = 50.19, p<.001,
Cohen’s d = .198). Novel items have also been observed to induce more neural activity
than familiar items in some functional brain-imaging experiments, an effect which has
been ascribed to greater neural efficiency in processing the latter (see, e.g., Poldrack,
2014). In the model, more activation represented less certainty about the identity of the
input. However, the neural realism of the distributed codes acquired in backpropagation
networks is too remote infer any much from the similarity to brain imaging results.
Correlations between structural measures and activation levels were high, .89 for
connection number and activity, and .63 for connection strength and activity (both
p<.01). Figure 10 shows associations from the artificial genome to, respectively, number
of connections, activation induced by processing novel verbs, and the generalization
performance on novel verbs. Associations for activation states more closely tracked
differences in the connectivity of the network rather than behavior. That is, variations in
the representational codes across networks were tied to structural properties of those
networks rather than how well the networks were performing in inflecting novel verbs.
<Insert Figures 9 and 10 about here>
<Insert Tables 2 and 3 about here>
3.6 Are associations modulated by the quality of the environment, producing gene x
environment interactions?
Our illustrative model was drawn from the study of language development, where in
41 modulation of the information content of the environment (Thomas, Forrester & Ronald,
2013). Did variations in this information content affect the associations observed between
levels? SES was modeled by the family quotient factor, which served as a filter on the
full training set, and which varied in value from 0.6 to 1.0. Note, by design, genomes
were randomly assigned to environments. We split the population into high and low SES
groups at a quotient of 0.8, yielding sub-groups of N=502 and N=498, respectively.
Figure 11 shows the neurocomputational parameter-to-behavior and artificial
gene-to-behavior associations for irregular verbs early in development. There were modulations
of effect size by SES in both cases. For artificial gene-behavior associations, there were
39 associations out of 126 that significantly differed between high and low SES groups at
p<.05 and 24 at p<.01 (with confidence intervals recalculated to reflect the smaller
sample size). An equivalent analysis of SES effects on regular verb associations yielded
38 at p<.05 and 15 at p<.01, respectively. This result demonstrates evidence of
gene-environment interactions in our model system, at least in the way that SES modified
gene-behavior associations. But did these effects translate into a modification of the
relationship between SES and behavior according to genotype? We took the artificial
gene with largest effect from Figure 11 (gene no. 68, predicting 6% of the variance in the
high SES group but only 1% in the low SES group). In the group of individuals with the
1-valued allele, the effect of SES was to modulate behavioral performance by 8.9% (high
SES, accuracy=40.4, N=230 versus low SES=31.5, N=248); for the 0-valued allele, the
effect of SES was a negligible 0.4% (27.7, N=272 versus 27.3, N=250). This
gene-environment interaction had a small effect size of 0.8% of the variance, but was