REVIEW
Mapping chromatin modifications at the single cell level
Connor H. Ludwig and Lacramioara Bintu*ABSTRACT
Understanding chromatin regulation holds enormous promise for controlling gene regulation, predicting cellular identity, and developing diagnostics and cellular therapies. However, the dynamic nature of chromatin, together with cell-to-cell heterogeneity in its structure, limits our ability to extract its governing principles. Single cell mapping of chromatin modifications, in conjunction with expression measurements, could help overcome these limitations. Here, we review recent advances in single cell-based measurements of chromatin modifications, including optimization to reduce DNA loss, improved DNA sequencing, barcoding, and antibody engineering. We also highlight several applications of these techniques that have provided insights into cell-type classification, mapping modification co-occurrence and heterogeneity, and monitoring chromatin dynamics.
KEY WORDS: DNA methylation, Chromatin regulation, Gene regulation, Histone modifications, Single cell detection
Introduction
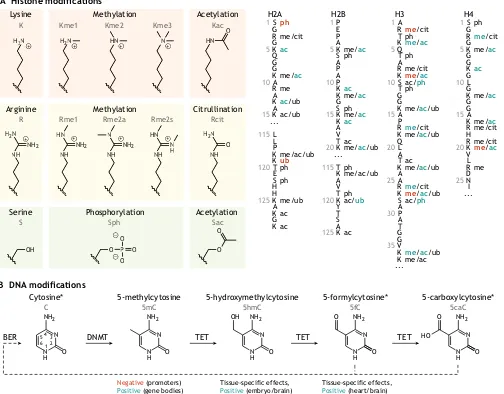
Most cells in an organism share the same genetic code, yet they express different sets of genes and display distinct cellular phenotypes that give rise to complex tissues with specialized functions. At the heart of this incredible phenotypic diversity is an intricate network of transcription factors, non-coding RNAs and chromatin regulators (Allis and Jenuwein, 2016). Chromatin serves as a substrate for these regulatory factors: chemical modifications on histone proteins and DNA can introduce recognition motifs for these factors and alter chromatin accessibility and 3D organization. These chromatin modifications can affect gene expression, genome replication, and DNA repair, and, in turn, these processes can change the state of chromatin. As a result, chromatin modifications are essential for establishing and maintaining cellular identity as well as for regulating dynamic responses during development and disease. The repertoire of distinct histone modifications is large, with approximately 15 known chemical moieties and hundreds of modifiable residues across five constituent histone proteins and their variants (Huang et al., 2014). The best-characterized histone modifications include acetylation and methylation of lysine residues, primarily on the N-terminal tails of histones H3 and H4 (Fig. 1A). Lysine acetylation (Kac) is positively correlated with transcription, whereas lysine methylation (Kme) is either positively or negatively correlated with transcription depending on the residue, degree of methylation (Lawrence et al., 2016) and modification status of neighboring residues (Kouzarides, 2007).
DNA can also be modified, although fewer DNA modifications are known compared with histone modifications. The most common
DNA modification in mammalian genomes is cytosine methylation (5mC), which occurs most often at CpG dinucleotides (Ehrlich et al., 1982; Stevens et al., 2013). This type of methylation generally correlates negatively with transcription at promoters (Jones et al., 1998). Interestingly, for actively transcribed genes, DNA methylation within the gene body is believed to prevent aberrant transcription initiation (Neri et al., 2017). Successive oxidation of 5mC yields other possible modifications of cytosine: hydroxymethylcytosine (5hmC), formylcytosine (5fC) and 5-carboxylcytosine (5caC) (Fig. 1B). Whereas 5mC and, to a lesser extent, 5hmC are stable, 5fC and 5caC are more transient. Currently, there is debate as to whether these less stable modifications play a functional role beyond serving as intermediates in the active demethylation pathway (Wu and Zhang, 2017; Zhu et al., 2018).
Given the diversity of chromatin modifications, there has been a massive effort to measure them at a genome-wide level and in different cell types (Allis and Jenuwein, 2016; Martens and Stunnenberg, 2013; Roadmap Epigenomics Consortium et al., 2015). The development of bulk methods for detecting chromatin modifications has expanded our understanding of their roles during development and across cell types. However, these bulk methods often require substantial starting material (tens of millions of cells) and produce population-averaged signals. These limitations diminish their utility in cases where sample size is small and heterogeneous, for example in clinical settings and when studying primary cells during development orin situ.
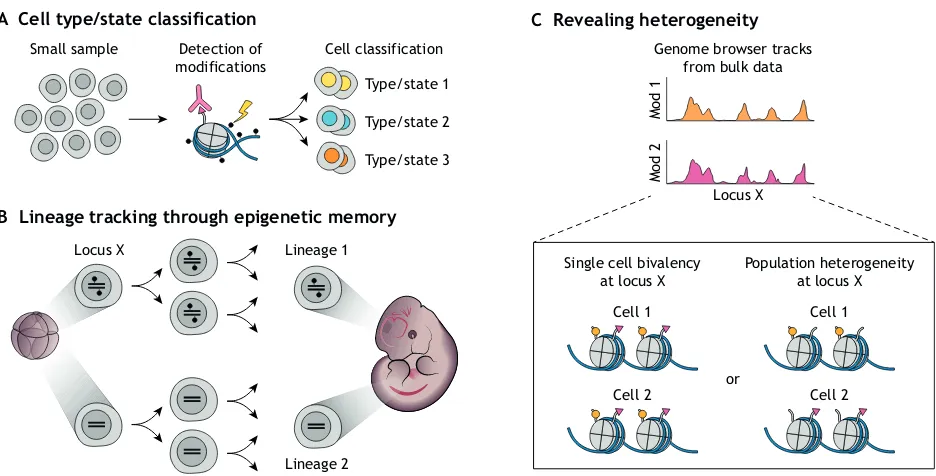
By contrast, single cell methods overcome such limitations and can actually measure heterogeneity in small samples (Fig. 2A). Additionally, single cell-based detection of chromatin modifications allows us to track cell lineages in development or disease (Fig. 2B). Moreover, now that we know the identity of most molecular players in the chromatin regulatory network (Kouzarides, 2007), it is time to dissect the finer mechanistic details of their dynamic interactions. Because chromatin and gene regulation are stochastic and can lead to cell-to-cell heterogeneity, many questions concerning these processes would benefit from single cell approaches. For example, what combinations of chromatin modifications appear together in individual cells, and which signals result from cell-to-cell heterogeneity (Fig. 2C)? What type and number of modifications are necessary and sufficient to effect changes in gene expression? Finally, how and when does partitioning of chromatin during replication lead to epigenetic memory? Answering these latter questions requires a combination of single cell methods that detect chromatin state and RNA levels (Tanay and Regev, 2017).
In this Review, we describe and assess (see Box 1, Table 1) methods for detecting and mapping chromatin modifications, focusing on technical advancements that have enabled adaptation to the single cell level and on ways of combining them with measurements of other cellular characteristics. Even though chromatin accessibility, three-dimensional chromatin structure and subnuclear localization contribute to cell identity and gene control (for recent reviews, see Shema et al., 2018; Tanay and Regev, 2017; Tycko et al., 2017), we will not cover these topics. Finally, we Department of Bioengineering, Stanford University, Shriram Center, 443 Via Ortega,
Rm 042, Stanford, CA 94305, USA.
*Author for correspondence (lbintu@stanford.edu)
L.B., 0000-0001-5443-6633
DEVEL
O
describe biological applications and insights gained using these technologies and discuss how they could be improved and incorporated into global scientific initiatives.
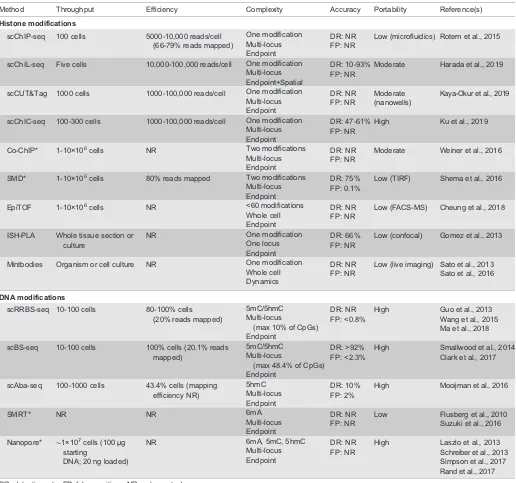
Classical methods for measuring histone modifications The detection of histone modifications relies primarily on chromatin fragmentation by sonication or DNA digestion, followed by immunoprecipitation of the resulting mononucleosomes with antibodies against a specific modification (in a process termed chromatin immunoprecipitation, ChIP). Readout of the genomic location of the modified nucleosomes is then performed using quantitative PCR of a specific genomic locus (ChIP-qPCR) or next-generation sequencing (NGS) for genome-wide detection (ChIP-seq; Fig. 3A).
Classical ChIP has some major limitations that preclude its adaptation to the single cell level robustly. First, crosslinking before fragmentation can lead to artifacts, decrease reproducibility and
impair immunoprecipitation. Thus, recent protocols have excluded this step, instead performing native ChIP (Kasinathan et al., 2014). Second, chromatin sonication requires large numbers of cells (hundreds of thousands to millions). The alternative to sonication, micrococcal nuclease (MNase) digestion, can be performed with smaller cell numbers or in situ (Skene et al., 2018). However, MNase treatment can digest away a portion of nucleosomal DNA (Henikoff et al., 2011), thus reducing the number of mapped reads from a single cell. Third, antibodies used for immunoprecipitation may exhibit low affinities for their respective targets, requiring increased input (i.e. large cell numbers); additionally, they may vary from lot to lot and have a low specificity (Kungulovski et al., 2014). Genetically encoded histone modification-specific recognition proteins present an ideal alternative to antibodies, as they can be engineered for greater affinity and specificity and could improve reproducibility. One such approach employs‘reader’domains that have evolved to bind specific histone modifications (Yun et al., B DNA modifications
N H O NH2 N N H O NH2 N N H O NH2 N OH N H O NH2 N HO O O N H O NH2 N O O Cytosine* 1 2 3 4 6 5
5-methylcytosine 5-hydroxymethylcytosine 5-formylcytosine* 5-carboxylcytosine*
DNMT TET TET TET
BER
C 5mC 5hmC 5fC 5caC
A Histone modifications
Negative (promoters)
Positive (gene bodies)
Tissue-specific effects,
Positive (embryo/brain)
Tissue-specific effects,
Positive (heart/brain) NH H2N NH2 A R T K Q T A R K S T G G K A P R K Q L A T K A A R K S A P A T G G V K K ... 1 5 10 15 20 25 30 35 me/cit ph me/ac ph
me/cit
me/ac
ac/ph ph
me/ac/ub me/cit me/ac/ub
ac me/ac/ub me/cit
me/ac/ub
ac/ph
me/ac/ub me/ac H3 S G R G K G G K G L G K G G A K R H R K V L R D N I ... 1 5 10 15 20 25 ph me/cit me/ac ac me/ac me/ac me/cit me/cit
me/ac
me H4 P E P A K S A P A P K K G S K K A V T K ... T K A V T K Y T S A K 1 5 10 15 20 115 120 125 me/ac ph ac me/ac ph me/ac ac ac me/ac/ub ph me/ac/ub ph ac/ub ac H2B S G R G K Q G G K A R A K A K ... L L P K K T E S H H K A K G K 1 5 10 15 115 120 125 ph me/cit ac me/ac me ac/ub ac/ub me/ac/ub ub ph ph me/ub ac ac H2A H3N O HN
H2N HN N
NH HN NH2 NH N NH2 NH HN N H NH H2N O OH O O
O P O
O
O
H222N HHN N
O O H HN H NH H22N
O H33N OH OH H NH H HN H NH2 H NH N H NH2 H NH H HN N H O O O O P O
O O O O O H NH H22N
H NH2 + + + + + + + + − −
Arginine Methylation Citrullination
R Rme1 Rme2a Rme2s Rcit
Serine Phosphorylation Acetylation
S Sph Sac
Lysine Methylation Acetylation
[image:2.612.58.562.62.456.2]K Kme1 Kme2 Kme3 Kac
Fig. 1. Key types of chromatin modifications.(A) Some of the most common histone modifications (shown on the left) occur at lysine (K), arginine (R), serine (S) and threonine (not shown) residues. These occur on the protruding tails of various histones (right) and can be positively (blue) or negatively (red) associated with transcription. Residue number, single-letter amino acid codes, and modifications are shown. ac, acetylation; cit, citrullination; me, methylation; ph, phosphorylation; ub, ubiquitylation. Adapted from Huang et al. (2014) and Lawrence et al. (2016). (B) Cytosine, when in the form of deoxycytidine monophosphate in DNA, can be methylated by DNA methyltransferases (DNMTs) and further oxidized by TET enzymes to produce four distinct species with context-specific effects on transcription, as indicated. The final two species in this pathway may be converted back to unmodified cytosine through base excision repair (BER). Asterisks indicate nucleobases that are chemically converted to uracil upon bisulfite treatment.
DEVEL
O
2011). Although binding affinities for their targets are often lower than those of antibodies (Kungulovski et al., 2014), reader domains have known sequences and thus can be evolved to improve affinity and specificity (Tekel et al., 2018). Similarly, fluorescent modification-specific intracellular antibodies (mintbodies) are small, GFP-tagged, single-chain variable fragments that can be expressed in vivo to allow live imaging of histone modification dynamics spatiotemporally (Sato et al., 2013) (Fig. 3J). Although only anti-H3K9ac and anti-H4K20me1 mintbodies have been developed so far (Sato et al., 2016), a future library of these tools could enable multiplexed quantification of chromatin dynamics in live cells.
Single cell measurements of histone modifications
In order to decipher the role of histone modifications in different cellular functions, we would ideally need to measure multiple histone modifications in single cells, link this information to defined genetic loci, and measure the dynamics over time in live cells. Although this type of multiplexed, genome-wide, live dynamics of histone modifications has not yet been achieved at the single cell level, recent advances–some of which are adaptations of classical ChIP–have allowed histone modifications to be probed in various ways at the single cell level.
Detecting and mapping single histone modifications over multiple loci
At present, single cell ChIP-seq (scChIP-seq) was the first technique that offers multi-locus reporting of a histone modification at the single cell level (Rotem et al., 2015) (Fig. 3B). To overcome the limitations associated with sonication, scChIP-seq uses microfluidics to isolate cells into individual droplets, in which chromatin is digested and barcoded before classical immunoprecipitation. Approximately 100 cells can be processed per assay, generating 500-10,000 unique reads per cell. In order to extract meaningful insights from the data despite limited coverage and low cell numbers, the authors of the above study clustered single cell data belonging to genomic regions likely to be similarly modified, such as a particular enhancer and the promoters it drives. This classification of genomic regions was performed using publicly available bulk ChIP-seq data. In this manner, the authors identified three distinct H3K4me2-associated epigenetic signatures within heterogeneous mouse embryonic stem cells (mESCs) grown in serum, which primes these cells for differentiation, and showed that these states correlate with the expression of pluripotency and chromatin factors (Rotem et al., 2015). The low cell yield and coverage, together with the need for a specialized microfluidics device, might explain why scChIP-seq has not yet been applied widely. However, as the authors suggest, the cell yield can be increased by expanding the number of barcodes using beads B Lineage tracking through epigenetic memory
A Cell type/state classification C Revealing heterogeneity
Small sample Cell classification
Lineage 1
Lineage 2
Genome browser tracks from bulk data
Mod 1
Mod 2
Locus X Detection of
modifications
Type/state 1
Type/state 2
Type/state 3
Locus X
Single cell bivalency at locus X
Cell 1
or
Population heterogeneity at locus X
Cell 2
Cell 1
[image:3.612.73.541.54.292.2]Cell 2
Fig. 2. Measuring chromatin modifications at the single cell level can provide mechanistic insights into biological questions.(A) Distinct single cell chromatin modification profiles enable computationally aided cell-type or cell-state classification. (B) Single cell methods allow cell lineages to be tracked by following epigenetic signatures maintained throughout differentiation and development. (C) Measuring chromatin modifications (e.g. Mod 1 and Mod2) at the single cell level can resolve averaging-associated ambiguities from bulk data to reveal potential population heterogeneity.
Box 1. Metrics of single cell technologies
In order to compare different single cell technologies, we use here a set of metrics that were previously defined (Tanay and Regev, 2017) – complexity, accuracy, throughput and efficiency–to which we will add a fifth: portability. Complexity describes the number of molecules that can be identified per cell. The complexity metric has multiple axes: the number of chromatin modifications, the number of genomic loci (Fig. 6), and the ability to follow modifications and loci dynamically over time and space. Accuracy refers to the signal-to-noise ratio of the assay, with high accuracy requiring high detection efficiency of the correct chromatin modifications and a low error rate. Throughput is defined as the number of cells that can be processed in an assay, and efficiency refers to the fraction of those cells that yields usable data. Finally, additional metrics, such as reproducibility between users and biological replicates, as well as accessibility, cost, and ease-of-use of equipment and reagents, can be subsumed under the broader category of portability. In a sense, how easily can a technology be ported to a new physical research environment or biological question with minimal troubleshooting and financial cost? As most current single cell technologies for mapping chromatin modifications are still in their infancy, each of them usually scores highly in one or two of these categories (Table 1).
DEVEL
O
(Klein et al., 2015; Macosko et al., 2015), and higher coverage could be achieved by optimizing ligation efficiency and amplification.
Very recently, three new single cell methods for detecting histone modifications were published: single cell chromatin integration labeling followed by sequencing (scChIL-seq) (Harada et al., 2019) (Fig. 3C), single cell cleavage under targets and tagmentation (scCUT&Tag) (Kaya-Okur et al., 2019) (Fig. 3D), and single cell chromatin immunocleavage followed by sequencing (scChIC-seq) (Ku et al., 2019) (Fig. 3E). All three methods replace traditional immunoprecipitation and sonication with in situ (inside nuclei) reactions: either via antibody-directed, transposase-mediated integration of a DNA tag and fragmentation (for scChIL-seq and scCUT&Tag), or via DNA cleavage specifically around nucleosomes containing the target modification (for scChIC-seq). Thesein situreactions remove the need to solubilize chromatin and
[image:4.612.49.565.67.550.2]thus reduce material loss. scChIL-seq and scCUT&Tag convolute chromatin accessibility with immune recognition of the histone modification, as the transposase is biased toward accessible chromatin (Buenrostro et al., 2015). Overall, this accessibility bias results in low Pearson’s correlation coefficients between bulk ChIP-seq and ChIL-ChIP-seq, especially for repressive histone modifications, such as H3K27me3, that lie within less accessible chromatin (r=0.26-0.31). This bias is also observed for the MNase action in scChIC-seq for H3K27me3, albeit to a lesser extent (r=0.67). Although the application of these methods is in its infancy, they have unique advantages over scChIP-seq: scChIL-seq provides spatial information by imaging the inserted probe; scCUT&Tag and scChIC-seq have simplified workflows, are higher throughput owing to expanded barcodes, and are more cost-effective. Therefore, we foresee further development and applications of these techniques. Table 1. Assessment of single cell methods for detecting DNA and histone modifications
Method Throughput Efficiency Complexity Accuracy Portability Reference(s)
Histone modifications
scChIP-seq 100 cells 5000-10,000 reads/cell
(66-79% reads mapped)
One modification Multi-locus Endpoint
DR: NR FP: NR
Low (microfluidics) Rotem et al., 2015
scChIL-seq Five cells 10,000-100,000 reads/cell One modification Multi-locus Endpoint+Spatial
DR: 10-93% FP: NR
Moderate Harada et al., 2019
scCUT&Tag 1000 cells 1000-100,000 reads/cell One modification Multi-locus Endpoint
DR: NR FP: NR
Moderate (nanowells)
Kaya-Okur et al., 2019
scChIC-seq 100-300 cells 1000-100,000 reads/cell One modification Multi-locus Endpoint
DR: 47-61% FP: NR
High Ku et al., 2019
Co-ChIP* 1-10×106cells NR Two modifications
Multi-locus Endpoint
DR: NR FP: NR
Moderate Weiner et al., 2016
SMD* 1-10×106cells 80% reads mapped Two modifications
Multi-locus Endpoint
DR: 75% FP: 0.1%
Low (TIRF) Shema et al., 2016
EpiTOF 1-10×106cells NR <60 modifications
Whole cell Endpoint
DR: NR FP: NR
Low (FACS-MS) Cheung et al., 2018
ISH-PLA Whole tissue section or culture
NR One modification
One locus Endpoint
DR: 66% FP: NR
Low (confocal) Gomez et al., 2013
Mintbodies Organism or cell culture NR One modification
Whole cell Dynamics
DR: NR FP: NR
Low (live imaging) Sato et al., 2013 Sato et al., 2016
DNA modifications
scRRBS-seq 10-100 cells 80-100% cells
(20% reads mapped)
5mC/5hmC Multi-locus
(max 10% of CpGs) Endpoint
DR: NR FP: <0.8%
High Guo et al., 2013
Wang et al., 2015 Ma et al., 2018
scBS-seq 10-100 cells 100% cells (20.1% reads
mapped)
5mC/5hmC Multi-locus
(max 48.4% of CpGs) Endpoint
DR: >92% FP: <2.3%
High Smallwood et al., 2014
Clark et al., 2017
scAba-seq 100-1000 cells 43.4% cells (mapping efficiency NR)
5hmC Multi-locus Endpoint
DR: 10% FP: 2%
High Mooijman et al., 2016
SMRT* NR NR 6mA
Multi-locus Endpoint
DR: NR FP: NR
Low Flusberg et al., 2010
Suzuki et al., 2016 Nanopore* ∼1×10⁷cells (100μg
starting
DNA; 20 ng loaded)
NR 6mA, 5mC, 5hmC
Multi-locus Endpoint
DR: NR FP: NR
High Laszlo et al., 2013
Schreiber et al., 2013 Simpson et al., 2017 Rand et al., 2017 DR, detection rate; FP, false positives; NR, not reported.
*Single molecule, not single cell.
DEVEL
O
Detecting and mapping co-occurring histone modifications
Although mapping one modification in single cells is informative, many loci have multiple modifications that contribute to their function (Strahl and Allis, 2000). For example, co-occurrence of histone modifications with opposing effects, specifically H3K4me3 (active) and H3K27me3 (repressive), is thought to poise a locus for fast transcriptional activation or silencing (Bernstein et al., 2006). Such bivalency is thought to be especially important during lineage specification and development. A recently developed imaging-based technology employed genetically encoded chromatin-sensing multivalent probes (cAMPs) to examine this bivalency (Delachat et al., 2018) at the whole-cell level. The probe–a fluorescent fusion protein containing micromolar-affinity readers of the H3K4me3 and H3K27me3 modifications – produces a stable signal at locally
clustered bivalent chromatin, revealing localization changes upon treatment with methyltransferase inhibitors.
Two other methodologies have been used to not only identify co-occurring modifications on single nucleosomes but also map their genomic locations (Shema et al., 2016; Weiner et al., 2016). Although these techniques are single molecule-based, with each nucleosome originating from a single cell, they are not single cell at the genome-wide level, as there is no mechanism for grouping different nucleosomes together based on cell of origin in current workflows. The first technology providing modification co-occurrence information at the single nucleosome level is an imaging-based method combining visual detection of histone modifications with on-slide sequencing (Shema et al., 2016) (Fig. 3F). In this method, single nucleosomes are immobilized on
Readout Fixation/
cross-linking
DNA fragmentation Cell
preparation Barcoding Detection Barcoding
A ChIP-seq
Suspension PFA Sonication Sequencing
Cell ID
B scChIP-seq
Microfluidics
Nucleosome ID
(x,y)
Imaging
(x,y)
Hist. Mark ID
ICP-MS
m/z
Image segmentation Plated or
tissue Live Imaging
RCA/imaging
Expressed scFv-GFP
Imaging PFA Sonication
Antibodies F SMD
G Co-ChIP
H EpiTOF
I ISH-PLA
J Mintbodies
Antibody IP
HMIT antibodies
x2
ISH
ChIL probe
C scChIL-seq
pT7 ME
Antibody-Tn5 D scCUT&Tag
E scChIC-seq
Plated PFA Tagm./cell ID
Tn5
Imaging
PFA
Tagm./cell ID
Cell ID Antibody-MN
MNase
MNase Suspension
Antibodies Antibody IP Antibody IP
[image:5.612.55.562.57.546.2]Sequencing
Fig. 3.See next page for legend.
DEVEL
O
glass slides and imaged using fluorescent antibodies against two histone modifications at a time. Successive rounds of antibody removal and incubation can provide co-occurrence information for more than two histone modifications. This approach allowed the authors to measure the fractions of nucleosomes containing particular combinations of modifications in different cell types or after treatment with epigenetic inhibitors. Furthermore, dissociation of the histones and single molecule sequencing on the remaining slide-bound DNA enables mapping of each nucleosome to its genomic location. The addition of a cell-barcoding step could advance this technique to the genome-wide, single cell level.
However, the current workflow and required infrastructure/ equipment limit the accessibility of this technology.
The second technology, termed Co-ChIP, has been used to characterize the co-occurrence of 70 histone modification pairs (14 primary modifications against five secondary modifications) at the single nucleosome level (Weiner et al., 2016) (Fig. 3G). Co-ChIP largely proceeds similarly to classical ChIP, whereby chromatin is cross-linked, sonicated and subjected to two sets of immunoprecipitations. However, after each immunoprecipitation step, each particular histone modification is effectively recorded to its nucleosomal DNA by adaptor ligation or PCR barcoding, thus allowing mapping of co-occurring modifications on single nucleosomes. Using this method, the authors discovered a new combination of modifications (H3K9me1 and H3K27ac) that is characteristic of super-enhancers and characterized bivalent domains (marked by H3K4me3 and H3K27me3) in different cell types. One can envision adding cell barcoding to this workflow in order to profile combinations of modifications across different regulatory regions in the same cell.
A recently published mass cytometry platform, termed epigenetic landscape profiling using cytometry by time-of-flight (EpiTOF; Cheung et al., 2018), greatly extends the number of histone modifications that can be measured simultaneously in a given cell (Fig. 3H). This multiparametric detection method is based on cytometry by time-of-flight (CyTOF), which can label up to 60 targets with heavy metal isotype-tagged antibodies and measure single cell global levels by mass spectrometry (Bandura et al., 2009). EpiTOF was used to measure cell type-specific histone modification patterns that could be used to predict immune cell identity (Cheung et al., 2018). Additionally, it was demonstrated that intercellular variability of histone modifications and histone variants increases in human immune cells with age. The throughput and target complexity of EpiTOF supersedes that of other epigenetic technologies; however, readouts of global levels preclude a precise understanding of chromatin state at individual loci, as mass spectrometry cannot be easily coupled with sequencing.
Monitoring spatial and temporal distributions of chromatin modifications
DNA in situ hybridization and proximity ligation (ISH-PLA) can provide imaging-based, locus-specific histone modification information, as well as cell phenotype and cell-cell interaction information (Gomez et al., 2013) (Fig. 3I). This method uses two oligo-tagged antibodies, one to recognize a genomic locus and the other a histone modification. When both are in proximity, rolling circle amplification from the two oligos locally produces DNA that can be imaged. ISH-PLA has been used in histological samples to demonstrate that epigenetic signatures can be used for lineage tracing and identifying cell types in the context of atherosclerosis, even in the absence of expression of classical marker genes (Gomez et al., 2013). However, ISH-PLA has not been widely adopted, perhaps because of its requirement for special equipment, its non-quantitative readout, and the low volume of information (i.e. single locus, single modification) that can be extracted from each experiment.
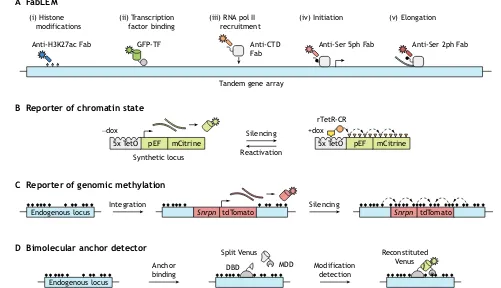
Measurements of histone modifications at a single locus have also been performed in live cells, although the locus needs to contain repetitive sequences in order to produce a detectable signal. The repetitive regions assayed were either engineered to contain a∼200 copy tandem gene (Stasevich et al., 2014) (Fig. 4A) or were part of natural satellite repeats (Lungu et al., 2017). In the tandem gene system, antibody-derived, fluorescently labeled antigen-binding fragments (Fabs) were introduced to measure, at the single cell Fig. 3. Detecting and mapping histone modifications at the single cell
level.(A) ChIP-seq is the classical approach to mapping histone modifications in bulk samples. It involves cell preparation, cross-linking of protein/DNA components by paraformaldehyde (PFA), chromatin fragmentation by sonication, immunoprecipitation (IP), and sequencing. Variations of this approach enable single cell level measurements to be made. (B) scChIP-seq employs microfluidics to encapsulate individual cells in droplet reaction chambers for DNA fragmentation by micrococcal nuclease (MNase) and ligation of cell-specific identifiers. Barcoded cells are pooled for IP, library preparation, and sequencing, as in bulk ChIP-seq. (C) scChIL-seq is performed on fixed single cells deposited in individual microwells. A primary antibody against a histone modification of interest is detected by a chromatin integration labeling (ChIL) probe comprising a secondary antibody conjugated to TAMRA fluorophore-labeled double-stranded DNA. This probe is imaged (via TAMRA) to determine the subnuclear localization of the modified nucleosomes and integrated into the sequence adjacent to the modified nucleosome via Tn5 transposase-binding of the mosaic end (ME) in a process called tagmentation (Tagm.). This resulting sequence is amplified byin situ transcription from a pT7 sequence included in the DNA oligo; this RNA library is reverse transcribed (not shown), and well-specific (cell-specific) barcodes are introduced during PCR amplification (not shown). (D) scCUT&Tag uses an antibody-Tn5 or a protein A-Tn5 fusion that associates with a pre-incubated antibody against a specific histone modification to insert pre-complexed adapters near modified nucleosomes upon magnesium addition. Insertion is performed on a pool/suspension of cells, which are then individually sorted into a chip array of nanowells with unique indexing primer pairs. In each nanowell, DNA is fragmented upon Tn5 dissociation and, upon PCR amplification, cell-specific barcodes are introduced. (E) scChIC-seq can be used on fixed or unfixed cells and involves incubation with an antibody-MNase or protein A-MNase fusion that associates with a pre-incubated antibody against a specific histone modification. Single cells are sorted into tubes and calcium is added to trigger MNase-mediated fragmentation. PCR amplification strongly selects for small, mononucleosomal fragments and enables cell-specific barcode incorporation. (F) Single molecule decoding of combinatorially modified nucleosomes (SMD) identifies the positions of bound nucleosomes and detects antibody-labeled histone modifications via total internal reflection fluorescence (TIRF) microscopy, followed by dissociation of histone proteins and on-slide sequencing of the remaining, bound DNA. (G) Co-ChIP employs two rounds (×2) of IP on bulk samples. After the first IP reaction, each nucleosome is uniquely barcoded via adapter ligation to effectively‘record’ detection of the first histone modification at the DNA level (dashed arrow). Subsequently, chromatin is released, pooled, and divided for a second set of IPs. The resulting DNA is PCR-amplified with primers unique to the second modification to record its presence (dashed arrow). NGS enables mapping of nucleosomes that contain particular combinations of modifications to the genome. (H) EpiTOF employs heavy metal isotope-tagged (HMIT) antibodies and inductively coupled plasma mass spectrometry (ICP-MS) to report global levels of up to 60 targets in a single cell. (I) ISH-PLA involves DNAin situ hybridization (ISH) of a biotin-labeled oligo to a target sequence. Samples are then incubated with primary antibodies against biotin and a histone modification of interest. DNA oligo-labeled secondary antibodies serve as primers for rolling circle amplification (RCA). These primers hybridize to circular DNA to enable successive rounds of amplification by DNA polymerase, and the amplified DNA is detected with fluorescent single-stranded DNA probes. (J) The use of genetically encoded mintbodies against histone modifications of interest enables the global measurement of temporal and spatial chromatin dynamics in live cells. scFv-GFP, single-chain variable fragment fused to GFP.
DEVEL
O
level, the effect of H3K27ac on RNA polymerase II recruitment, initiation, and elongation dynamics at the gene array with temporal resolution on the order of tens of seconds. This live endogenous modification labeling revealed that H3K27ac acts to increase accessibility for incoming transcription factors and outgoing RNA polymerase II, as evidenced by increased elongation rates.
Gene reporter systems that indirectly monitor single cell chromatin dynamics, avoiding the need for antibodies or reader domains, have also been utilized. For instance, gene silencing and reactivation dynamics can be quantified via flow cytometry and live imaging with single cell tracking upon recruitment or release of chromatin regulators at a fluorescent reporter (Bintu et al., 2016) (Fig. 4B). Using this approach, it was demonstrated that various chromatin regulators associated with repressive histone methylation, DNA methylation or histone deacetylation impart distinct kinetics and permanence of epigenetic memory. Notably, the authors proposed a three-state model of gene expression–with active, reversibly silent, and irreversibly silent states–to which they could fit single cell data to classify each chromatin regulator based on calculated kinetic parameters.
Classical methods for measuring DNA modifications
Classically, mapping DNA modifications relies on one of the following techniques: (1) chemical conversion of unmodified
nucleobases to another nucleobase (Frommer et al., 1992); (2) recognition of the modified nucleobases by restriction enzymes (Jelinek and Madzo, 2016); or (3) recognition of the modified nucleobases by antibodies (Weber et al., 2005). The last two methods are less popular: the second is restricted to detecting modifications at the subset of DNA loci that contain the particular enzyme recognition sequence, and the third method is not ideal because existing antibodies do not discriminate well between DNA modifications, and it has low resolution (a few hundred base pairs, limited by fragment length).
The most commonly used method employs sodium bisulfite to convert unmethylated cytosines to uracil, followed by sequencing (BS-seq) (Frommer et al., 1992) (Fig. 5A). Although BS-seq can detect modifications at the single base level, it suffers from three major drawbacks. First, bisulfite treatment reduces all possible cytosine modifications to one of two states: converted or unconverted. Specifically, both 5mC and 5hmC, which can have opposing effects on gene expression (Zhu et al., 2018), are protected from conversion (Huang et al., 2010), whereas C, 5fC and 5caC are substrates for conversion. Second, bisulfite treatment is harsh: because conversion is much more efficient on single-stranded versus double-stranded DNA (Shapiro et al., 1974), the required acidic conditions and high temperatures ultimately degrade approximately 90% of the input DNA (Grunau et al., 2001). Moreover, as sequencing adapters are traditionally added to DNA prior to bisulfite treatment, a substantial
tdTomato
Snrpn Snrpn tdTomato
Endogenous locus Integration Silencing
C Reporter of genomic methylation A FabLEM
Tandem gene array (i) Histone
modifications
(ii) Transcription factor binding
(iii) RNA pol II recruitment
(iv) (v)
B Reporter of chromatin state
mCitrine pEF
5x TetO
rTetR-CR
mCitrine pEF
5x TetO +dox
−dox
Synthetic locus
Silencing
Reactivation
Initiation Elongation
Anti-H3K27ac Fab GFP-TF Anti-CTD
Fab
Anti-Ser 5ph Fab Anti-Ser 2ph Fab
Endogenous locus
Anchor binding
D Bimolecular anchor detector
Modification detection
DBD MDD
[image:7.612.52.553.61.349.2]Reconstituted Venus Split Venus
Fig. 4. Monitoring chromatin modifications and transcription dynamics.(A) Introducing fluorescent antigen-binding fragments (Fabs) into cells for live endogenous modification labeling (LEM) can elucidate chromatin and transcription dynamics to examine their interplay. For example, one can track histone modifications (i), GFP-labeled transcription factors (ii), and phosphorylated serine residues (Ser) in the carboxy-terminal domain (CTD) of RNA pol II that are related to recruitment, initiation and elongation (iii-v). Figure adapted from Stasevich et al. (2014). (B) Gene reporter systems can also be used to follow chromatin dynamics. In the example shown, doxycycline (dox) mediates the recruitment of a chromatin regulator (CR; orange circle) fused to a reverse tetracycline repressor (rTetR; yellow box) to TetO sites upstream of a constitutively expressed fluorescent reporter gene. Recruitment induces gene silencing and deposition of chromatin modifications, and CR release allows gene reactivation. (C) Methylation at an endogenous locus can be monitored by integration of a reporter gene that consists of a minimal imprinted gene promoter (Snrpn) and the coding sequence for a fluorescent protein (tdTomato). DNA methylation spreads from the endogenous locus into the reporter, leading to its silencing. (D) The direct readout of DNA or histone methylation at a locus of interest is possible upon reconstitution of a split fluorescent protein (Venus), the constituents of which are fused to a programmable DNA-binding domain (DBD) and a modification detection domain (MDD).
DEVEL
O
Restriction digestion
Chemical modification
Barcode/adapter incorporation
Signal amplification
Sequencing readout Cell preparation
5mC 5hmC 5ghmC 5fC 5caC
G C A G C
C C
Reference
G T A G T
C C
Measured Bisulfite
CC UCU Bisulfite
CC UCU
NGS
A BS-seq
Barcode lig.
CC CCC
Adapter add. MspI
digestion
M.SssI methylation
5mC ( ) C
Bisulfite Adaptor lig.
Suspension PCR NGS
B scRRBS-seq
G C A G C
C C
Reference
G T A G T
C C
Measured
Fluorescence SM imaging
Time
Current Pore loading
I
Time Adaptor lig.
Adaptor lig. Suspension
MRE1 digestion Single cell
isolation
MSD RE2
digestion
CCCCC
Adapter lig. NGS
RRBS or PBAT workflows
Bisulfite
CC UCU
RRBS or PBAT workflows
PCR
CC UCU
CC TCT
CC TCT
Barcode/PCR
CC CCC
CC CCC CC CCC
G T
C 5mC
C scBS-seq (PBAT)
D scMAB-seq
E scCGI-seq
F scAba-seq
G SMRT (PacBio)
H Nanopore (Oxford Nanopore Technologies)
CC CCC CC UCU
CC UCU
CC TCT
CC TCT
AbaSI digestion
CC C C
Glucosylation Barcode lig. IVT
Barcode/PCR
CC UCU
CC TCT
CC TCT 5⬘ 3⬘
5⬘
3⬘
Fragment/ adapter add.
PCR
CC C
CC C
pT7
/ C CC
[image:8.612.52.561.55.542.2]Key
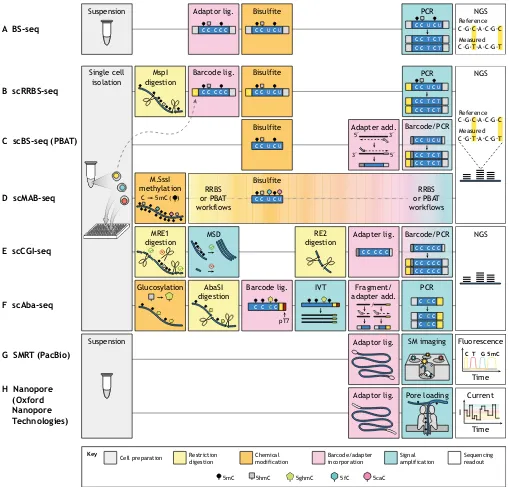
Fig. 5. Detecting and mapping DNA modifications at the single cell level.(A) BS-seq is the most commonly used bulk method for mapping 5mC/5hmC with single nucleotide resolution. This approach involves cell preparation, DNA adapter ligation, bisulfite conversion, PCR amplification, and sequencing. Bisulfite converts only C, 5fC and 5caC to uracil, which are read as thymines in next-generation sequencing (NGS), whereas 5mC and 5hmC resist conversion and are read as cytosines. This technique has been modified in various ways to enable single cell-based measurements. (B) scRRBS-seq maps 5mC/5hmC and uses a one-tube protocol to minimize sample loss. The restriction endonuclease MspI releases CpG-rich DNA fragments for bisulfite treatment, increasing the amount of CpG information that can be obtained with fewer sequencing reads. (C) scBS-seq provides whole-genome 5mC/5hmC information with less material loss than traditional methods by using post-bisulfite adapter tagging (PBAT) to avoid DNA damage that otherwise prevents PCR amplification. (D) scMAB-seq uses the methyltransferase M.SssI to convert all unmodified cytosines to 5mC such that the only nucleobases converted to uracil by bisulfite are 5fC and 5caC. Both RRBS and PBAT workflows can be employed to map 5fC/5caC. (E) scCGI-seq uses a cocktail of methylation-sensitive restriction enzymes (MRE1) to fragment unmethylated regions while preserving the length of methylated ones. Multiple strand displacement (MSD) preferentially amplifies longer fragments, and a second cocktail of restriction enzymes (RE2) digests these long pieces into smaller fragments appropriate for NGS. (F) scAba-seq involves glucosylation of 5hmC by T4 phageβ-glucosyltransferase, followed by glucosylation-dependent digestion by the AbaSI restriction endonuclease, cell-specific barcoded adapter ligation, andin vitrotranscription amplification (IVT) from the T7 promoter ( pT7). The transcripts are fragmented and subjected to RNA-seq library preparation. (G) Single molecule real-time sequencing (SMRT) is a third-generation, sequencing-by-synthesis technique that uses extremely small imaging volumes to boost the fluorescent signal from nucleotide incorporation into a single molecule (SM) template. Special adapters circularize the template to enable many reads of the same molecule, and modified nucleobases can be distinguished from unmodified ones based on differential kinetics. (H) Nanopore sequencing is a third-generation approach that reads the current as nucleobases pass through a transmembrane pore. Special adapters are required for pore loading, and nucleobase (modified or unmodified) identity can be predicted from the associated current reading. Both SMRT and Nanopore sequencing can read much longer molecules than NGS.
DEVEL
O
portion of sequences fail to amplify as a result of DNA damage. Third, the conversion of unmodified cytosines, which normally account for
∼20% of the genome, to uracil greatly reduces sequence complexity. This constrains PCR primer design for library preparation and potentially hinders downstream sequencing and genome mapping (Callinan and Feinberg, 2006).
Single cell measurements of DNA modifications
Current methods for detecting DNA modifications at the single cell level are either direct – using bisulfite conversion, methylation sensitive restriction enzymes, or third-generation sequencing–or indirect–using fluorescent reporters sensitive to DNA methylation (for a recent review, see Karemaker and Vermeulen, 2018). These methods primarily focus on 5mC and 5hmC, the two most common DNA modifications, but a subset could be adapted to detect other modifications.
Bisulfite-based measurements of DNA modifications
Bisulfite conversion followed by sequencing was the first method to map DNA modifications to many loci at the single cell level and is currently the most developed in terms of throughput and base-pair resolution. As previously discussed, bisulfite conversion of unmodified cytosines cannot discriminate between 5mC and 5hmC (Huang et al., 2010). This limitation must be considered, especially when interpreting mechanistic results in cell types with higher levels of 5hmC, such as embryonic stem cells and neurons (Wu and Zhang, 2017).
The first single cell, multi-locus method for DNA methylation mapping used a modified version of reduced representation bisulfite sequencing (RRBS-seq) (Gu et al., 2011; Meissner et al., 2005), performing all reaction steps for a single cell in one tube in order to reduce DNA loss (Guo et al., 2013) (Fig. 5B). RRBS-seq involves enrichment of CpG-rich regions by digesting DNA with the restriction endonuclease MspI at C^CG_G sites (approximately once per 256 bp), followed by ligation of sequencing adapters. This guarantees that each adapter-tagged fragment contains at least two CpG sites and allows for comparison of methylation profiles at select CpGs with fewer overall sequencing reads. However, single cell RRBS-seq (scRRBS-seq) can only detect a theoretical maximum of 10% of CpGs and still suffers from reduced material recovery, as bisulfite conversion is performed after adapter ligation. Nonetheless, the authors used this method to show that DNA demethylation in mouse zygotes occurs more rapidly at gene regions compared with intergenic regions after fertilization.
Single cell bisulfite sequencing (scBS-seq) has also been extended to the whole genome (Smallwood et al., 2014) by using post-bisulfite adaptor tagging (PBAT) (Miura et al., 2012). By performing adapter addition after the DNA-damaging bisulfite conversion step, this method avoids accidental fragmentation of adapter-tagged DNA molecules, thereby increasing the amount of DNA that can be successfully amplified during library preparation (Fig. 5C). The whole-genome nature of scBS-seq provides fivefold more CpG information than scRRBS-seq at the same sequencing depth (Smallwood et al., 2014). The reproducibility of the scBS-seq protocol was benchmarked using oocytes, which are highly homogeneous and have well-defined DNA methylation profiles. Using this approach, it was also demonstrated that mESCs grown in serum have increased variability of DNA methylation at active enhancers, suggesting that enhancers are the first triggers in cell fate changes.
Several recent alterations to the basic scBS-seq and scRRBS-seq protocols have increased throughput, decreased amplification
bias and improved data analysis. For example, workflow optimization, such as a reduction in the number of protocol steps and tube transfers (Farlik et al., 2015), has improved material recovery and enabled automation via liquid-handling robots (Clark et al., 2017) or microfluidic devices (Ma et al., 2018). An emerging, cost-effective strategy aims to sequence a larger number of cells at low coverage in order to construct composite reference methylome maps for specific tissues (Farlik et al., 2015) or to classify cell types and lineages (Luo et al., 2017; Mulqueen et al., 2018). Traditional single cell bisulfite workflows require an elevated number of PCR cycles to ensure adequate input material for sequencing, resulting in amplification bias and read duplication. One study examining the methylation status of highly abundant, repetitive elements (Kobayashi et al., 2016) removed PCR amplification, instead increasing starting material via sample multiplexing. However, this method is not generalizable to non-repetitive sequences. Alternatively, an RRBS-based method was used to preserve PCR amplification while incorporating unique molecular identifiers, which act as fragment-specific barcodes, to identify PCR-related duplications and SNP-independent allele-specific methylation (Wang et al., 2015). Finally, one group improved priming efficiency in PBAT, implemented additional quality control steps during data analysis, and found high CpG concordance at neighboring sites within a 1 kb window (Hui et al., 2018).
Although BS-seq is generally used to detect 5mC and 5hmC, this chemical treatment has been incorporated in a workflow to indiscriminately detect 5fC and 5caC at a genome-wide level (Wu et al., 2017). This approach–termed single cell methylase-assisted bisulfite sequencing (scMAB-seq, Fig. 5D) – uses the methyltransferase M.SssI to convert CpG cytosines to 5mC, resulting in only 5fC/5caC conversion to uracil upon bisulfite treatment. In order to improve material recovery, the authors successfully developed two workflows based on either PBAT or RRBS. Whereas the former captures more of the genome and enables more quantitative analysis, the RRBS-based scMAB-seq approach improves measurement consistency owing to the rareness of 5fC and 5caC and their tendency to cluster in the genome. The application of this approach to study the zygotic paternal genome following replication and cell division directly demonstrated for the first time in single cells that 5fC and 5caC are diluted during these processes.
Endonuclease-based measurements of DNA modifications
Endonuclease-based sequencing methods avoid random DNA loss and thus improve coverage and efficiency. Genome-wide CpG island (CGI) methylation sequencing for single cells (scCGI-seq) is one such method that enriches for sequences with high CpG content, providing 72.7% CGI coverage per cell (Han et al., 2017) (Fig. 5E). Following manual isolation of single cells, a cocktail of methylation-sensitive restriction endonucleases fragments DNA in unmethylated regions and preserves longer fragments in methylated regions (e.g. CGIs), allowing them to be amplified via multiple strand displacement. The use of a small pool of restriction enzymes with specific recognition sequences precludes this technique from directly providing single nucleotide information at most CpGs. Rather, this method relies on the observation that neighboring CpG sites within a 1 kb window have a high probability of sharing the same methylation state (Hui et al., 2018). Hierarchical clustering of CGI methylation revealed by scCGI-seq yielded distinct clusters according to cell type, with greater CGI/promoter hypermethylation and repeat region hypomethylation measured in the cancer cell line K562 compared with the non-cancer cell line GM12878 (Han et al.,
DEVEL
O
2017). This strategy could be extended to mapping 5hmC, although more 5hmC-sensitive restriction enzymes need to be identified to provide greater coverage.
A method for specifically detecting 5hmC (Mooijman et al., 2016), called single cell Aba-seq, first glucosylates 5hmC to 5ghmC for recognition by the restriction enzyme AbaSI, which cleaves the DNA downstream of the modification to generate fragments for ligation of cell-specific barcodes for NGS (Fig. 5F). This methodology suffers from a low detection efficiency of ∼10% largely owing to incomplete glucosylation. Nevertheless, scAba-seq was used in mESCs and in developing mouse embryos to show that each chromosome in a particular cell has high 5hmC density on one DNA strand and low density on the other, suggesting the lack of a specific replication-dependent maintenance mechanism for 5hmC. Moreover, this 5hmC strand bias can be used to identify sister cells, as the sum of their strand biases must add to unity.
Although the increasing biological importance of 5hmC, 5fC and 5caC has spurred the development of single nucleotide-resolution detection methods at the bulk and single cell levels, there exists the need for a method to detect 5mC alone (without 5hmC) at similar resolution (Clark et al., 2017).
Third-generation sequencing of DNA methylation
Third-generation sequencing methods, such as single molecule real-time sequencing (SMRT, commercialized by PacBio) and Nanopore sequencing (commercialized by Oxford Nanopore Technologies), promise detection of DNA modifications directly, without amplification, on single DNA molecules (Fig. 5G,H). However, the distinction between single molecule detection versus single cell detection must be noted. The use of physical cell separation or sample barcoding enables methods such as scBS-seq to provide epigenetic information for many loci (thousands or more) within the same cell. By contrast, although single molecule information is inherently derived from single cells, without unique sample identifiers it only provides information from one genomic locus. Nonetheless, the advantage of both SMRT and Nanopore sequencing is that reads from single DNA molecules are long (up to 2.2 Mb for Nanopore sequencing; Payne et al., 2018), with read length limited by the method of DNA purification (Laver et al., 2015); thus, these methods can provide unprecedented information about a large genomic locus from a particular cell.
As with NGS, SMRT sequencing uses imaging of fluorescent nucleotides upon incorporation during DNA synthesis (Fig. 5G). Unlike NGS, which relies on local amplification of the template to increase the fluorescent signal, SMRT uses zero-mode waveguides (subwavelength holes in a metal film) to decrease the imaging volume, reducing background fluorescence from unincorporated nucleotides to enable single molecule detection of incorporation events (Levene et al., 2003). When the DNA template contains epigenetic modifications, the kinetics of nucleotide incorporation slows, allowing the detection of individual 6mA (adenosine methylated at carbon six), 5hmC or 5mC events on a synthetic template with known sequence (Flusberg et al., 2010). However, the change in signal–the time between two incorporation events – is low (requiring 500× coverage for differentiating 5hmC from 5mC; Suzuki et al., 2016), depends on the surrounding sequence, and is spread over the several bases that contact the DNA polymerase. With these limitations, SMRT-seq can only reliably detect 6mA (Flusberg et al., 2010) and not 5mC/5hmc (the most common mammalian DNA modifications) on genomic sequences.
Nanopore sequencing relies on changes in electrical current through a pore to read the sequence of long DNA molecules as well as their epigenetic modifications (Fig. 5H). Initial experiments using test DNA oligos of known sequence have shown that detection efficiency of 5mC and 5hmC can be as high as 80-97% with a single-pass read (Laszlo et al., 2013; Schreiber et al., 2013). However, the current depends on multiple nucleotides that are in the pore concurrently, rendering the magnitude of the signal dependent on the surrounding sequence. Thus, accurate detection on random genomic DNA requires training the detection algorithm on a library of synthetic oligos consisting of all possible sequence combinations for the number of bases that span the pore height and with different modifications on each cytosine. Although this feat has not yet been achieved, significant steps have been taken to this end by training hidden Markov models on smaller libraries and applying them to genomic DNA samples from bacteria (Rand et al., 2017) and human cells (Simpson et al., 2017). Indeed, this approach was used to analyze data from individual DNA molecules in cancer cells to show that the methylation status of CpGs is highly correlated within 1 kb regions from a single cell (Simpson et al., 2017), in agreement with previous results.
Real-time reporters of DNA methylation
DNA modification detection methods are arguably most informative when paired with DNA sequencing, which optimally yields single nucleotide-resolution data. However, these approaches often capture a snapshot of the methylome, which is itself dynamic. A reporter of genomic methylation (RGM) sacrifices single nucleotide resolution in order to indirectly monitor real-time methylation state information at a specific locus (Stelzer et al., 2015) (Fig. 4C). The reporter consists of a minimal imprinted gene promoter, which is highly sensitive to proximal methylated DNA in a non-tissue-specific manner and drives the expression of a fluorescent protein. Stable CRISPR-mediated integration of this reporter near an endogenous region of interest enables the methylation state of that region to control expression of the fluorophore. Using this reporter, the dynamics of super enhancers were studied during mouse development and cell reprogramming. In the future, this method could be adapted to use different fluorescent proteins to simultaneously report the methylation status at multiple genes.
Recently developed real-time chromatin modification sensors (Lungu et al., 2017) directly detect a chromatin modification at a repetitive locus of interest using bimolecular fluorescence complementation (Fig. 4D), while simultaneously providing subnuclear localization. These sensors, termed bimolecular anchor detectors (BiADs), consist of a programmed DNA-binding domain (‘anchor’, e.g. zinc finger, TALE, dCas9) and a chromatin modification detector, each of which are fused to a portion of the monomeric Venus fluorescent protein, which only produces a signal upon proximity-mediated reconstitution. The authors of the above study validated their BiAD sensors through detection of 5mC and H3K9me3 at centromeric satellites, demonstrated BiAD accessibility to constitutive heterochromatin and condensed chromatin throughout mitosis, and suggested extending their method to simultaneous detection of multiple modifications.
Linking chromatin modifications to other measurements There has been a recent development of single cell methodologies that combine detection of chromatin modifications with measurements of gene expression and/or chromatin organization in order to elucidate the relationship between them (Fig. 6A).
DEVEL
O
Time
Space
Transcription
DNA modifications Perturbations
Histone modifications
Accessibility 3D organization
Spatial and temporal dynamics
Chromatin regulator
RNA polymerase
scNOMe-seq, scCOOL-seq scMT-seq,
scM&T-seq, scTrio-seq
scNMT-seq
A Linking chromatin mapping to other measurements
1 2 Many
0 1 Many
EpiTOF Mintbodies
scChIP-seq scChIL-seq scCUT&Tag scChIC-seq
Number of modifications detected
Number of loci
mapped in the same cell
NEED
B Complexity of mapping histone modifications
ISH-PLA
Number of modifications
detected
Number of loci mappedin the same cell
R
e
solution (bp)
of modification(s)
10
>100 1
1
Many
2
Many 1
2 RGM
scCGI-seq CC CCC
SMRT Nanopore CCU U
U scRRBS-seq
scBS-seq scMAB-seq scAba-seq
C Complexity of mapping DNA modifications
Co-ChIP SMD
[image:11.612.59.551.173.632.2]NEED
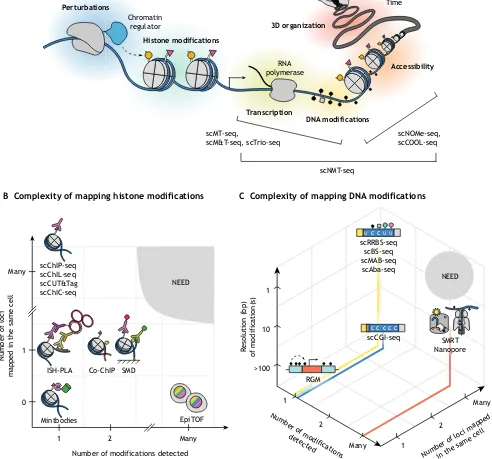
Fig. 6. Future developments in single cell detection of chromatin modifications.(A) An ideal method would monitor chromatin modifications in conjunction with other processes (e.g. accessibility, transcription, 3D organization) over time and space and in response to perturbations. A number of existing methods measure two or more cell characteristics, as indicated. (B) Single cell methods for detecting and mapping histone modifications are plotted according to two components of the complexity metric: the number of modifications detected (x-axis) and the number of loci mapped in a single cell (y-axis). (C) Single cell methods for detecting and mapping DNA modifications are plotted according to three components of the complexity metric: the number of modifications detected, the number of loci mapped in a single cell, and the mapping resolution (bp). The plots (B,C) highlight that there currently exists a need for methods that map many chromatin modifications at many loci.
DEVEL
O
DNA methylation and chromatin accessibility
Single cell nucleosome occupancy and methylome sequencing (scNOMe-seq) provides chromatin accessibility and DNA methylation information, which, taken together, are particularly useful for characterizing regulatory regions (Pott, 2017). In this approach, a viral GpC methyltransferase, M.CviPI, is used to convert chromatin accessibility into a pattern of Gp5mC (Kelly et al., 2012), a type of methylation that is rare in eukaryotes. This enzyme preferentially methylates GpC cytosines in non-nucleosomal DNA when added to extracted nuclei. These methyltransferase-treated nuclei are deposited by fluorescence-activated cell sorting (FACS) into individual wells and subsequently subjected to the scBS-seq protocol, revealing both endogenous CpG methylation and nucleosome occupancy as a lack of GpC methylation. Using this approach, it was shown that promoter accessibility and gene-body CpG methylation are positively correlated with gene expression annotations, whereas promoter CpG methylation is negatively correlated with known expression, consistent with previous findings (Schübeler, 2015). Furthermore, both DNA methylation and accessibility could be used to independently classify cell types.
A nearly identical method, termed single cell chromatin overall omic-scale landscape sequencing (scCOOL-seq), has been used to provide information about nucleosome positioning, DNA methylation, copy number variation (CNV), and ploidy in mouse preimplantation embryos (Guo et al., 2017). The authors observed higher DNA methylation heterogeneity between embryos than within an embryo at the two-cell stage, demonstrating a high degree of synchronization during development. They also found that, from the late zygote to the four-cell stage, intergenic regions on paternal alleles are more methylated relative to maternal ones, whereas intragenic regions are less methylated. In addition, their analysis of mESCs revealed that promoters with increased heterogeneity in accessibility are generally hypomethylated, although the factors responsible for this phenomenon remain to be discovered.
DNA methylation and gene expression
At present, there are three methodologies that provide DNA methylation and gene expression information at the single cell level. Two approaches are both named single cell methylome and transcriptome-sequencing [scM&T-seq (Angermueller et al., 2016) and scMT-seq (Hu et al., 2016)], and the third, which also looks at DNA copy number variation, is called single cell triple omics sequencing (scTrio-seq) (Hou et al., 2016). The first approach, scM&T-seq, separates polyadenylated RNA from DNA with biotinylated oligo-dT primers for RNA-seq (Macaulay et al., 2015) and performs whole-genome methylome sequencing with scBS-seq. The second approach, scMT-seq, uses microcapillary pipetting to isolate the nucleus from the cytosol and enriches for CpG-dense regions with scRRBS-seq. Both techniques implement a widely used scRNA-seq protocol known as Smart-seq2 (Picelli et al., 2014) for transcriptome library preparation. The third approach, scTrio-seq, uses gentle lysis and centrifugation to physically separate cytosolic contents from the nucleus, thereby minimizing DNA contamination during RNA-seq library preparation, and also uses the scRRBS-seq method for methylome profiling.
scM&T-seq has been used to recapitulate the increased epigenetic and gene expression heterogeneity observed when ESCs are grown in serum versus 2i media (Angermueller et al., 2016). Importantly, this study showed that distinct clusters of the most variable genes arise by either methylome- or
transcriptome-based hierarchical clustering, supporting the utility of the dual methodology. Moreover, the data quality and results of using the combined technique are comparable to the data quality and results of performing scRNA-seq or scBS-seq individually. Because scM&T-seq utilizes the whole-genome bisulfite approach, 48.4% of CpG sites can theoretically be identified, in contrast to the 1% of sites that the reduced representation approach employs in both scMT-seq and scTrio-seq (Hu et al., 2016).
scMT-seq has been used in dorsal root ganglion sensory neurons, the large size of which facilitates micropipetting, to link methylation patterns with allelic expression (Hu et al., 2016). Specifically, this study revealed that transcription of non-CGI promoter genes negatively correlates with promoter methylation, whereas transcription of CGI promoter genes positively correlates with gene body methylation. The scMT-seq method additionally revealed a rare subset of highly expressed genes with hypermethylated, CpG-rich promoters.
scTrio-seq recapitulates correlations between gene expression and promoter hypomethylation and gene-body hypermethylation, and provides nearly complete single cell copy-number variation determination with 10-Mb resolution; this method allows classification of cancer cell subpopulations with high metastatic potential that bulk assays would fail to capture (Hou et al., 2016). However, scTrio-seq provides only approximately two-thirds the transcriptome coverage of scMT-seq (Hu et al., 2016), likely owing to the incomplete transfer of cytosolic material during the physical separation procedure. Nonetheless, this procedure may more flexibly accommodate multiple, downstream transcriptomic and methylomic pipelines, including whole genome scBS-seq (Hou et al., 2016).
DNA methylation, chromatin accessibility, and gene expression Single cell nucleosome, methylation, and transcription sequencing (scNMT-seq) is the natural successor to the above methods, combining elements of the scM&T-seq method with the scNOMe-seq workflow (Clark et al., 2018). Using this technique, the number and nature of associations between pairs of these three layers of molecular regulation in embryoid bodies was examined and revealed the following: (1) CpG methylation and transcription are generally negatively correlated at the genome-wide level; (2) accessibility and transcription are positively correlated in promoters, p300 targets, and super enhancers; and (3) CpG methylation and accessibility are generally negatively correlated in introns. Clustering of single cell accessibility profiles provided an estimate of accessibility heterogeneity for each gene, with those that were homogeneously open being highly expressed housekeeping genes and those with a mixed state being lowly expressed and more likely to contain a bivalent promoter. Finally, the authors used gene expression data to infer the position of each cell along a differentiation trajectory to examine accessibility and methylation dynamics as functions of pseudotime. As expected, methylation and accessibility become increasingly negatively correlated throughout differentiation.
Applications of single cell chromatin mapping technologies: insights into development and disease
Single cell chromatin modification mapping technologies have deepened our understanding of cell types and states as well as how these change throughout development and disease. Cell-type or cell-state classifications have both been used to benchmark these technologies and as a tool to study cell-fate decisions in development, aging and disease. Benchmarking has been performed in a few ways: (1) by mixing known cell types together
DEVEL
O
and showing that they can be computationally separated; (2) by using haploid cells with homogeneous chromatin modification profiles, such as oocytes, and showing that single cell data reproduce bulk results; or (3) by looking for increased heterogeneity in mESCs grown in serum versus 2i medium. Single cell detection of chromatin modifications has been used to classify cell types in the early embryo (Guo et al., 2013; Guo et al., 2017), smooth muscle (Gomez et al., 2013), cortex (Luo et al., 2017), the hematopoietic system (Cheung et al., 2018; Farlik et al., 2016; Hui et al., 2018) and the immune system (Cheung et al., 2018). Additionally, single cell measurements have shown that immune cells exhibit increased overall levels and heterogeneity of histone modifications with aging (Cheung et al., 2018). Similarly, hepatic cancer samples show heterogeneity in DNA methylation and contain a subpopulation of cells that expresses markers associated with immune evasion and malignancy (Hou et al., 2016). These results underscore the value of mapping chromatin modifications for diagnosis.
Classification of cell types can also be achieved with other single cell methods that rely on detection of transcripts or chromatin accessibility (Trapnell, 2015). scRNA-seq is currently the most widely used method for cell-type classification (Tanay and Regev, 2017), as gene expression is a good indicator of cell type, and one can recover a fair number of RNA molecules from each cell. However, because transcription occurs in bursts and is dynamic over short timescales, scRNA-seq data has intrinsic noise. Therefore, many cells are needed to extract trends, and care should be taken when interpreting these data as cell types rather than signaling states within a cell type. Given these dynamics in RNA levels, chromatin state might be a more stable signature of cell type. One method to globally assess chromatin state is the assay for transposase-accessible chromatin (ATAC-seq) (Buenrostro et al., 2013), which has been adapted to the single cell level (Buenrostro et al., 2015; Cusanovich et al., 2015) and applied to classify cell types (for a review, see Klemm et al., 2019). A recent study that built an immune cell atlas has shown that analysis of chromatin accessibility by single cell ATAC-seq at distal enhancers results in sharper cell classification than analysis based on RNA expression or accessibility of transcription start sites (Yoshida et al., 2019). Similarly, analysis of chromatin modifications at select genomic elements could yield improved cell-type classification once the number of reads recovered from each cell increases sufficiently.
Single cell detection of chromatin modifications can also be used for lineage-tracking during development and disease. Tracking relies either on strong maintenance of histone or DNA methylation at particular loci throughout cell generations or on the complete lack of maintenance of modifications, such as 5hmC, that leads to their strand-specific partitioning in daughter cells. 5mC is a stable modification, owing to its replication-dependent maintenance by DNMT1, and thus can be used to track lineages across generations (Farlik et al., 2016). Histone methylation can also persist for many generations in certain cell types. For instance, H3K4me2 is detected at tissue-specific promoters of smooth muscle cells even when these cells have differentiated into atherosclerotic tissue and no longer express those specific genes (Gomez et al., 2013). Alternatively, modifications that lack strong maintenance, such as 5hmC in early embryo development, can be used to identify sister cells, as the 5hmC signal from the original DNA is partitioned perfectly between sister cells upon DNA replication (Mooijman et al., 2016). Lineage tracking, either by monitoring naturally occurring chromatin modifications or by introducing orthogonal modifications from other organisms, can be used to interrogate mechanisms in development and to improve diagnosis.
Single cell measurements have also confirmed key results about histone modification combinations and DNA modification dynamics that were implied from bulk data and have started to unravel details that would otherwise be obscured by the stochastic nature of epigenetic events. In particular, modifications that are associated with opposing gene expression patterns (H3K4me3 and H3K9me3) were definitively shown to exist on the same nucleosomes (bivalency) in mESCs, as well as other cell types (Rotem et al., 2015; Weiner et al., 2016), as opposed to resulting from mixed cell populations. Histone modifications associated with synergistic effects on gene expression (H3K9ac and H3K4me3) have also been identified on the same nucleosomes, and their co-existence is enriched compared with levels that would be expected from measurements of each modification independently, suggesting positive feedback between these two modifications (Weiner et al., 2016). Moreover, multiple studies have uncovered an increased degree of heterogeneity in histone modifications and DNA methylation at enhancers in hepatocytes (Gravina et al., 2015; Gravina et al., 2016) and in mESCs primed for differentiation (Angermueller et al., 2016; Smallwood et al., 2014; Weiner et al., 2016), suggesting that changes in chromatin modifications could be drivers of cell differentiation.
Conclusions and perspectives
The rapidly increasing pace of method development in mapping single cell chromatin modifications reflects the appreciation of intrinsic stochasticity and heterogeneity in biology. This fast pace has been supported by advancements in microfluidics, automation, single molecule imaging, DNA synthesis, and sequencing. The major DNA and histone modifications have now been measured at the single cell level in multiple ways. So far, research on single cell detection of chromatin modifications has primarily focused on the development and validation of these techniques. This focus on technological development is justified, as single cell technologies at present have quite low complexity [low number of modifications and loci mapped per cell (Fig. 6B,C) and limited spatial and temporal resolution]. Owing to these limitations, genome-wide single cell technologies are currently much better at classifying cell types and states than at answering mechanistic questions. At the other extreme, measurements that follow a single locus over time, such as real-time reporters (Bintu et al., 2016; Stasevich et al., 2014; Stelzer et al., 2015), can shed some mechanistic insight on the role of chromatin in gene expression. However, it remains to be seen how these findings extend to different loci and cell types. In particular, different cell types grown in culture appear to be more similar in their epigenetic profiles to one another than to cells from within the tissue from which they were derived (Zhu et al., 2013). This finding suggests that using bulk data fromin vitrocell culture to guide the analysis of sparse reads from single cell measurements performed on primary or clinical samples should be performed with care, as it may lead to misclassification.
We foresee that, as they mature and increase in complexity, single cell technologies could be used to detect multiple modifications, including combined DNA and histone modifications (e.g. bulk ChIP-BS-seq; Gao et al., 2016) at many loci, and they could additionally measure gene expression and chromatin structure over time and space (Fig. 6A). One way to achieve this ideal is by using recently developed multiplexed imaging technologies – such as Oligopaints for chromatin (Beliveau et al., 2015; Bintu et al., 2018; Boettiger et al., 2016) and MERFISH or intron seqFISH for RNA (Chen et al., 2015; Shah et al., 2018)–as endpoint measurements in time-lapse microscopy experiments. Finally, with the development of programmable DNA-binding domains, we can now perturb the epigenome at will (Cano-Rodriguez and Rots, 2016; Park et al.,