BIROn - Birkbeck Institutional Research Online
Jenkins, Michael and Grubert, Anna and Eimer, Martin (2016) Rapid
parallel attentional selection can be controlled by shape and alphanumerical
category. Journal of Cognitive Neuroscience 28 (11), pp. 1672-1687. ISSN
0898-929X.
Downloaded from:
Usage Guidelines:
Please refer to usage guidelines at or alternatively
1
Rapid parallel attentional selection can be controlled by shape and alphanumerical category
Michael Jenkins*, Anna Grubert, & Martin Eimer
*Corresponding author
Department of Psychological Sciences, Birkbeck, University of London,
Malet Street, London, WC1E 7HX, UK
Phone: 0044 20 76316522
Email: [email protected]
2 Abstract
Previous research has shown that when two colour-defined target objects appear in rapid
succession at different locations, attention is deployed independently and in parallel to both
targets. The present study investigated whether this rapid simultaneous attentional target
selection mechanism can also be employed in tasks where targets are defined by a different
visual feature (shape) or when alphanumerical category is the target selection attribute.
Two displays that both contained a target and a nontarget object on opposite sides were
presented successively, and the stimulus onset asynchrony (SOA) between the two displays
was 100 ms, 50 ms, 20 ms, or 10 ms in different blocks. N2pc components were recorded to
both targets as a temporal marker of their attentional selection. When observers searched
for shape-defined targets (Experiment 1), N2pc components to the two targets were equal
in size and overlapped in time when the SOA between the two displays was short, reflecting
two parallel shape-guided target selection processes with their own independent time
course. Essentially the same temporal pattern of N2pc components was observed when
alphanumerical category was the target-defining attribute (Experiment 2), demonstrating
that the rapid parallel attentional selection of multiple target objects is not restricted to
situations where the deployment of attention can be guided by elementary visual features,
but that these processes can even be employed in category-based attentional selection
tasks. These findings have important implications for our understanding of the cognitive and
neural basis of top-down attentional control.
3
In real-world visual scenes, there is a vast amount of accessible information
competing for perceptual processing and access to conscious control. Selective attention
acts as a filter that allows us to resolve this competition, favouring those objects that are
most relevant to our current task goals. In visual search tasks where observers must find a
specific target object among several distractors, internal representations of target-defining
features (attentional templates) in working memory can be employed to guide the
allocation of attention (e.g., Duncan & Humphreys, 1989; Wolfe & Horowitz, 2004; Olivers et
al., 2011). These attentional templates are set up before the onset of the visual search
display, and facilitate visual processing of template-matching objects in a spatially selective
fashion (e.g., Desimone & Duncan, 1995; Eimer, 2014, 2015). In most visual search
experiments, search targets are presented simultaneously with multiple task-irrelevant
distractors in the same display. When the target is defined by a known simple visual feature
(such as the colour red), the search template will bias attention towards any object in the
search display that possesses this feature. However, there are real-world contexts where
multiple feature-defined target objects or events can appear simultaneously or in rapid
succession. In such situations, observers might encounter a new object that requires
immediate attention (e.g., traffic lights changing to red) while their attention is already
focused elsewhere (e.g., on the car in front). To facilitate the adaptive control of behaviour
in such situations, attentional control processes should be able to allocate attention rapidly
and flexibly to such new target objects.
There is continuing debate as to whether attention can be allocated simultaneously
to multiple objects at different locations. Serial visual search models (e.g., Treisman &
Gelade, 1980; Wolfe, 1994, 2007) claim that focal attention can be directed only to one
object at any given moment, and that the selection of several objects requires sequential
movements of a unitary focus of attention. In other words, the deployment of attention to a
new target object requires that attention is withdrawn from its previous location. On the
other hand, parallel models of attention (e.g., Desimone & Duncan, 1995) assume that
attention can be allocated simultaneously to several objects in a scene, and that multiple
parallel foci of attention can operate concurrently at different locations in the visual field.
The availability of such a parallel selection mechanism would be particularly useful in
situations where a new attention-demanding event arrives while attention is focused at a
4
traffic in front of them while simultaneously deploying their attention to a changing traffic
light.
In a recent study, we investigated the processes responsible for the rapid allocation
of attention to new target objects with event-related brain potential (ERP) markers of
attentional object selection (Eimer & Grubert, 2014; see also Grubert & Eimer, 2015 for
extended findings). This study demonstrated that attention can be allocated in parallel and
independently to multiple objects at different spatial locations. Two search displays, each
containing one colour-defined target object (e.g., a red item) and one distractor object in a
different task-irrelevant colour (e.g., a green, blue, or yellow item) were presented in rapid
succession on opposite sides of central fixation. Participants were asked to report whether
the two target-colour items in the two successive displays belonged to the same
alphanumerical category (both letters or both digits) or not (one letter and one digit). The
stimulus onset asynchrony (SOA) between the two displays was either 100 ms or 10 ms. To
track the speed of the attentional selection of the two target-colour objects in the first and
second display in real time, the N2pc component of the event-related potential was
measured in response to both successively presented search displays. The N2pc is an
enhanced negativity that is elicited at posterior electrodes contralateral to the visual field of
a target object in multi-stimulus visual displays. This component typically emerges 180-200
ms after stimulus onset, is generated in extrastriate areas of the ventral visual processing
stream (Hopf et al., 2000), and reflects the attentional selection of a candidate target object
among distractors in the visual field (e.g., Eimer, 1996; Luck & Hillyard, 1994; Woodman &
Luck, 1999). Because the N2pc is computed by comparing contralateral and ipsilateral ERP
waveforms to targets in the left versus right visual field, no N2pc is elicited for target objects
appearing on the vertical meridian (Eimer & Grubert, 2014; Eimer, Kiss, & Nicholas, 2011;
Hickey, Di Lollo, & McDonald, 2009; Hickey, McDonald, & Theeuwes, 2006; Woodman, &
Luck, 1999). This fact makes it possible to use the N2pc to measure the attentional selection
of a particular target object independently from the selection of another target that appears
simultaneously or in close temporal proximity. When one of these two target objects is
presented on the horizontal midline (to the left or right of fixation) and the other on the
vertical midline (above or below fixation), the N2pc will exclusively reflect the selection of
the horizontal target, irrespective of any parallel attentional processing of the other
5
This logic was applied in our previous study (Eimer & Grubert, 2014), where one
target/nontarget pair was always presented on the vertical meridian, and the stimulus pair
in the other display was presented on the horizontal midline. On half of all trials, the
horizontal target/nontarget pair preceded the vertical stimulus pair (horizontal target first:
H1 targets), while this order was reversed in the other half of all trials (horizontal target
second: H2 targets). Because the positions of the two targets were not predictable,
participants could not allocate attention in advance to specific spatial locations, and
attentional selection of each target could only commence once the respective stimulus
displays had been presented. By comparing the onset latency of N2pc components on H1
and H2 trials, we determined how rapidly attention was deployed to the target object in the
second display after the initial attentional selection of the target in the first display. When
the two displays were separated by an SOA of 100 ms, N2pc components elicited by H2
targets were delayed by almost exactly 100 ms relative to the N2pc components triggered
by H1 targets. When both displays were separated by only 10 ms, the onset latency
difference between N2pc components to H1 and H2 targets was 10 ms, again matching the
objective SOA time separating the two target objects precisely. In other words, both H1 and
H2 targets always elicited an N2pc approximately 200 ms after they were presented,
regardless of whether they appeared nearly simultaneously (SOA10 condition) or were
separated by a longer temporal interval (SOA100 condition). With an SOA of 10 ms, N2pc
components to H1 and H2 targets were equal in size and overlapped in time, suggesting that
focal attention was allocated to the newly arriving second target while the previously
established focus of attention on the first target location remained active. In the SOA 100
condition, N2pc components to H1 and H2 targets were again equal in size, but did not
overlap in time, indicating that two temporally separate attentional selection processes can
be triggered within 100 ms of each other. Overall, these findings suggest that focal attention
can be allocated rapidly and in parallel to multiple target objects, and that each of the two
selection processes follows its own independent time course (see also Grubert & Eimer,
2015, for similar results in experiments where two successively presented target objects
were defined by two different colours).
These observations provide strong evidence for parallel attentional selection
mechanisms, and challenge the hypothesis that attention must always be allocated
6
selection can only be observed in the specific type of tasks that were employed in our
previous studies (Eimer & Grubert, 2014; Grubert & Eimer, 2015). In these experiments,
target objects were always defined in terms of their colour. Because colour is known to
facilitate highly efficient search performance (e.g., Wolfe & Horowitz, 2004), multiple target
objects may be selected in a rapid parallel fashion when these processes can be based on
colour, but not when they have to be controlled by other target-defining visual features.
This hypothesis was tested in Experiment 1, where observers again had to select two target
objects in two search displays that were presented in rapid succession. However, these
targets were now no longer defined by their colour, but by a particular shape. If colour was
unique in facilitating rapid parallel attentional selection, the temporal pattern of N2pc
components to H1 and H2 targets in Experiment 1 should be qualitatively different from the
pattern observed in our previous N2pc studies of colour-based selection. Alternatively,
attentional object selection may generally operate in a rapid parallel fashion whenever it
can be guided by specific visual features, but not in tasks where search targets do not share
a common visual attribute. This was tested in Experiment 2, where target objects were
physically different members of the same alphanumerical category.
Experiment 1
Colour is a powerful guiding feature for visual search, and this may be linked to a
special status of colour signals during the perceptual processing of visual input. Colour
discriminations take place as early as the lateral geniculate nucleus of the thalamus (see
Sincich & Horton, 2005, for a review), and colour is perceived faster than other visual
attributes such as orientation or motion (Moutoussis & Zeki, 1997a, 1997b; Arnold, Clifford,
& Wenderoth, 2001; see also Zeki, 2016, for a review). If colour signals are generally
processed more rapidly and become available earlier than information about other visual
features, the rapid parallel attentional selection processes observed in previous N2pc
studies (Eimer & Grubert, 2014; Grubert & Eimer, 2015) may be specific to situations where
participants search for colour-defined targets. To test this hypothesis, the target objects in
Experiment 1 were defined by their shape. In contrast to colour, the status of shape for the
control of attentional object selection is less clear (e.g., Wolfe & Horowitz, 2004). Although
7
exact featural properties that guide attention towards shape targets have not been fully
specified (see Cheal & Lyon, 1992). While colour signals are extracted rapidly, shape
information is processed more gradually, starting in V1 with orientation detectors (Hubel &
Wiesel, 1962, 1968) and texture segregation processes (Lamme et al., 1992), and continuing
in V2 with illusory contour processing (e.g., Kanizsa, 1979; von der Heydt & Peterhans,
1989), and in V4 with the segregation of shapes from their backgrounds (Desimone &
Schein, 1987). The perceptual presence of illusory contours, in the absence of a physical
basis for a resulting percept, reflects the complexity of shape processing, and the absence of
dedicated shape-detecting units in the brain. Such differences in the functional architecture
of neural systems processing colour and shape might be mirrored by systematic differences
in the effectiveness of attentional guidance by these two feature dimensions in a task where
two task-relevant objects are presented in rapid succession.
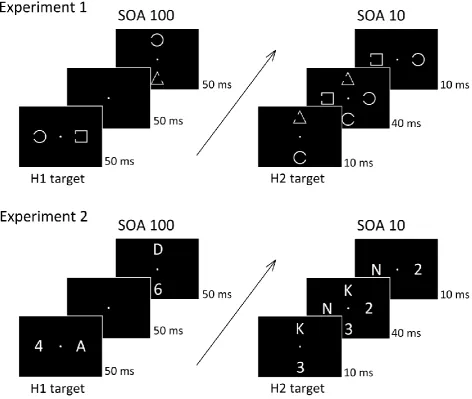
To test this hypothesis, participants in Experiment 1 had to attend to two
successively presented target objects that were defined by a specific shape, and to report
whether a gap in the contour of these two target objects was located on the same side or on
opposite sides (see Figure 1). Four blocked SOA conditions were tested (10, 20, 50, and 100
ms, respectively), and procedures were otherwise identical to those used in our earlier
experiments with colour-defined targets (Eimer & Grubert, 2014; Grubert & Eimer, 2015).
Behavioural performance and N2pc components observed in Experiment 1 can therefore be
directly compared to the results obtained in these earlier studies. When attention is guided
by shape rather than colour, the attentional selection of two targets presented in rapid
succession may operate more slowly. If this were the case, the time interval between the
two N2pc components to H1 and H2 targets should not match the objective SOA between
the two targets (as was observed for colour-guided selection), but should be substantially
increased. It is also possible that there are fundamental qualitative differences between
colour-guided and shape-guided attentional selection processes, in that the former can
operate in parallel while the latter have to take place in a strictly sequential fashion. If this
were the case, attention would have to be withdrawn from the first target object before
being allocated to the second target object in Experiment 1, which would result in two N2pc
components to H1 and H2 targets that do not overlap in time. In particular for short SOAs, a
serial selection mode could imply that attention will only be allocated to the first target
8
attention can be deployed to its location. In this case, behavioural performance should be
severely impaired in blocks with short SOAs between the two displays, and N2pc
components to H2 targets should be strongly attenuated or entirely absent. Even if serial
selection processes operated extremely rapidly, the fact that attention would have to be
withdrawn from the first target in order to be allocated to the second target object would
imply that for short SOAs, the N2pc components to H1 targets should be strongly
attenuated or absent. Thus, regardless of its speed, a serial attentional selection mechanism
should be reflected by a marked attenuation of one of the two N2pc components in the
short SOA conditions.
Alternatively, a rapid mechanism of allocating attention in parallel and
independently to multiple target objects may not only be available in selection tasks where
colour is the target-defining feature, but may also operate in a similar fashion for other
target attributes, such as shape. If attention can be allocated rapidly and in parallel to
shape-defined target objects, the pattern of N2pc results in Experiment 1 should be
qualitatively the same as the pattern reported by Eimer and Grubert (2014) with
colour-defined targets.
Methods
Participants
Thirteen participants were paid to take part in Experiment 1. One of them was
excluded from analysis due to excessive eye movement activity. The remaining twelve
participants were aged between 21 and 41 years (mean age 31 years). Eight were female
and three were left-handed. All participants had normal or corrected-to-normal vision.
Stimuli and procedure
Stimuli were presented on a 22-inch Samsung wide SyncMaster 2233 LCD monitor
(resolution of 1280x1024 pixels, 100 Hz refresh rate; 16ms black-to-white-to-black response
time, as verified with a photodiode). Participants were seated in a dimly illuminated cabin
and viewed the screen at a distance of approximately 100 cm. Stimulus presentation,
9
Windows XP, using the Cogent 2000 toolbox (www.vislab.ucl.ac.uk/Cogent/) for MATLAB
(Mathworks, Inc.).
Stimuli were grey outline shapes (circles, squares, or triangles; 0.2° line width),
subtending 1.1° x 1.1° of visual angle. The contour of each shape had a gap on the left or
right side. The size of this gap was of 0.6°, and it was always centred in the middle between
the top and bottom of each shape (as illustrated in Figure 1, top panel). All stimuli were
presented at an eccentricity of 3.0° from central fixation against a black background. A
central grey fixation point (0.2° x 0.2°) remained continuously present throughout each
experimental block. Each stimulus display contained one object in the target shape and
another distractor object in a randomly selected nontarget shape (Figure 1). The nontarget
shapes were never repeated within a trial. Each participant was assigned a specific target
shape that remained constant throughout the experiment. Their task was to report whether
the position of the gap on the two successively presented target shapes was the same side
(both gaps left, or right) or opposite sides (one gap left, one gap right) by pressing one of
two purpose-built vertically aligned response keys. The response-to-key mapping, as well as
the hand-to-key mapping, was counterbalanced across participants. Trials requiring a same
or different response were equiprobable and randomly intermixed in each block. Each of
the three shapes (circle, square, and triangle) served as target shape for four participants.
On each trial, the two successive stimulus displays were each presented for 50 ms.
One target-nontarget pair was presented on the horizontal meridian (left and right of
fixation), and the other pair appeared on the vertical meridian (above and below fixation). In
half of all trials, the horizontal stimulus pair was presented first (horizontal target first: H1
targets). In the other half, the vertical target/nontarget display preceded the horizontal
display (horizontal target second: H2 target). These two display sequences were presented
in randomly intermixed trials in each block. The position of the two target objects in these
two displays (left/right; top/bottom) was randomly and independently determined on each
trial. There were four blocked SOA conditions. In SOA 10 blocks, the onset of the first display
preceded the onset of the second display by only 10 ms (i.e., there was a 40 ms overlap
between these two displays). In SOA 20 blocks, this overlap was 30 ms. In SOA 50 blocks, the
onset of the second display coincided in time with the offset of the first display. In SOA 100
10
the interval between the offset of the second display and the onset of the first display on
the next trial was 1900 ms.
The experiment contained 24 blocks, with 64 trials per block (8 trials for each
combination of display sequence [H1 target, or H2 target], side of horizontal target [left, or
right], and side of vertical target [top, or bottom]). Each SOA condition was run in 6
successive blocks, and the order of SOA conditions was counterbalanced across participants.
Each SOA condition was preceded by one practice block.
EEG recording and data analyses
The continuous EEG was DC-recorded from 27 scalp electrodes at standard positions
of the extended 10/20 system, sampled at a rate of 500 Hz, and digitally low-pass filtered at
40 Hz. No other offline filters were applied. All channels were online referenced to the left
earlobe and re-referenced offline to the average of both earlobes. Trials contaminated with
artifacts (eye movements exceeding ±30 µV in the HEOG channels; eye blinks exceeding ±60
µV at Fpz; muscular movements exceeding ±80 µV in all other channels), and trials with
incorrect, anticipatory (faster than 200 ms), very slow (slower than 1500 ms), or missing
responses were excluded from EEG analyses. This led to an exclusion of an average of 8.9%,
10.4%, 11.7% and 16.4% of all trials in the SOA 10, SOA 20, SOA 50, and SOA 100 conditions,
respectively. For the remaining trials, EEG was segmented into epochs ranging from 100 ms
prior to 500 ms after the onset of the first stimulus display, and was baseline corrected
relative to the 100 ms interval prior to the onset of the first display. EEG was averaged
separately for each of the sixteen combinations of SOA (100 ms, 50 ms, 20 ms, or 10 ms),
horizontal display sequence (H1 targets or H2 targets) and location of the horizontal target
(left or right).
N2pc components were quantified on the basis of ERP waveforms measured at
lateral posterior electrodes PO7 and PO8. N2pc onset latencies were measured on the basis
of difference waveforms, computed by subtracting ipsilateral from contralateral ERPs at PO7
and PO8. Onset latencies were determined with a jackknife-based procedure (Miller,
Patterson, & Ulrich, 1998; Ulrich & Miller, 2001). Twelve grand-average difference waves
were computed for each experimental condition, each excluding one different participant
from the original sample. N2pc onset latency was defined as the point in time when each
11
when 50% of the peak amplitude was reached in these difference waves), as described by
Miller et al. (1998). Differences in N2pc onset latencies between H1 and H2 targets were
assessed with repeated-measures ANOVAs and t-tests, with F- and t-values corrected
according to the formulas described by Ulrich and Miller (2001) and Miller et al. (1998),
respectively. The corrected statistical values are indicated with Fc and tc, respectively. All t
-tests were two-tailed and Bonferroni corrected where necessary. To measure effect sizes,
Cohen’s d (Cohen, 1988) was computed for all t-tests which returned a t value larger than 1,
and partial eta-squared (labelled ηp2) was computed for all ANOVAs which returned an F
value larger than 1. As no standardised formula exists for correcting individual group means
and standard deviations of jackknifed samples to calculate effect size measures such as
Cohen’s d, jackknifed group means of N2pc latency and peak amplitude values were fed into
repeated-measures ANOVAs where the error variance can be corrected according to the
formula described by Ulrich and Miller (2001) to calculate corrected partial eta-squared
values for all t-tests on N2pc latency and peak amplitude measures (reported as ηp2c). When
N2pc latency comparisons are based on fractional peak amplitude measures, it has to be
shown that there are no systematic N2pc peak amplitude differences between conditions,
because such differences can affect onset latency estimates. To assess whether this
condition was met, we computed N2pc peak amplitudes for H1 and H2 targets, separately
for the four SOA conditions, using a jackknife-based approach analogous to that employed
for determining N2pc onset latencies. Peak amplitudes for H1 targets were determined
within a 150 -350 ms post-stimulus latency window for all SOA conditions. For H2 targets,
these windows were 150 – 350 ms (SOA 10 and SOA 20 conditions), 200 – 400 ms (SOA 50
condition) and 250 – 450 ms (SOA 100 condition). These peak amplitude values were then
analysed in a repeated-measures ANOVA with the factors display sequence (H1 versus H2
targets) and SOA (10, 20, 50, and 100 ms). There were no significant main effects and no
two-way interaction between these factors, confirming that N2pc peak amplitudes did not
differ systematically between task conditions. The absence of such differences justifies our
choice of a 50% peak amplitude criterion to define N2pc onset latencies.1
1
12
N2pc mean amplitudes were computed within 100 ms post-stimulus time intervals.
For H1 targets, a constant time window (210-310 ms) was employed for all four SOA
conditions. Because N2pc components to H2 targets emerged at different latencies relative
to the onset of the first display in the different SOA conditions (reflecting the difference in
the onset of H2 displays), the time intervals used for measuring N2pc mean amplitudes for
H2 targets were determined separately for each SOA condition on the basis of the
grand-averaged N2pc peak latency for this condition. Measurement windows were defined
relative to a 100 ms interval centred on the N2pc peak latency (from 50ms before to 50ms
after the N2pc peak for a particular SOA condition), rounded to the nearest 5 ms. The
resulting H2 N2pc mean amplitude windows were 210-310 ms (SOA 10), 220-320 ms (SOA
20), 270-370 ms (SOA 50), and 320-420 ms (SOA 100).
Results
Behavioural performance
Anticipatory or exceedingly slow reaction times (RTs; faster than 200 ms or slower
than 1500 ms) were removed from analysis, resulting in the exclusion of less than 0.3% of all
trials. A repeated-measures ANOVA with the factors SOA (10, 20, 50, and 100 ms) and
display sequence (H1 versus H2 targets) revealed a main effect of SOA on RTs, F(3,33) =
5.93, p < .01, ηp2 = .35. Paired t-tests showed that RTs in the SOA 100 (714 ms) were slower
relative to the three other SOA conditions (SOA 50: 663 ms, SOA 20: 660 ms, SOA 10: 654
ms; all t(11) > 2.64, all p < .05, all d > .41). RTs did not differ between the three shorter SOA
conditions, all t(11) < 1. There was no main effect of display sequence on RTs, F < 1.
Although the interaction between SOA and display sequence reached significance, F(3,33) =
2.99, p < .05, ηp2 = .21, follow-up analyses conducted separately for each SOA showed no
reliable RT differences between H1 and H2 targets for any SOA condition. A
repeated-measures ANOVA on error rates with the factors SOA and display sequence also showed a
main effect of SOA, F(3,33) = 12.20, p < .001, ηp2 = .53. Error rates were higher in the SOA
100 condition (9.1%) relative to the three shorter SOA conditions (SOA 50: 3.4%, SOA 20:
2.3%, SOA 10: 2.7%, all t(11) > 3.64, all p < .01, all d > 1.17), and did not differ between these
three short SOA conditions, all t(11) < 1. There was no main effect of display sequence on
13
significant, F(3,33) = 3.35, p < .05, ηp2 = .23, follow-up analyses conducted separately for
each SOA condition found no reliable differences in error rates between trials with H1 and
H2 targets for any SOA.
N2pc components
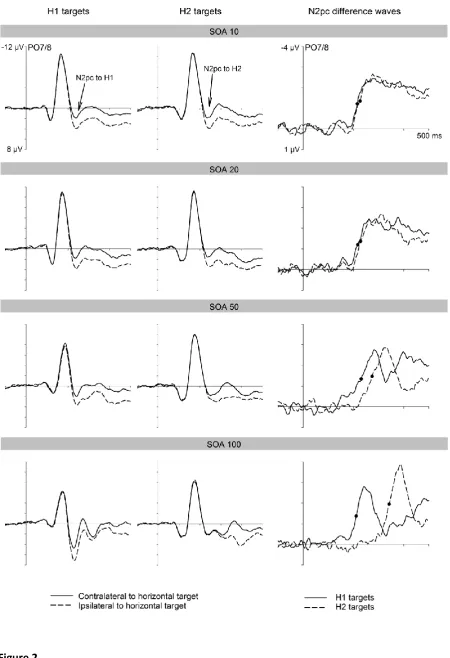
Figure 2 (left and middle panels) shows ERPs at posterior electrodes PO7/8
contralateral and ipsilateral to the side of the horizontal shape target for trials where this
target appeared in the first display (H1 targets) or in the second display (H2 targets). ERPs
are shown separately for each SOA condition. The right panel of Figure 2 shows N2pc
difference waveforms obtained by subtracting ipsilateral from contralateral ERPs for H1 and
H2 targets, for all four SOA conditions. In all SOA conditions, solid N2pc components were
elicited to both H1 and H2 targets. N2pc components to both types of targets were similar
in size. In the three shorter SOA conditions, there was considerable overlap in time between
the N2pc components to H1 and H2 targets, and the onset latencies of these N2pcs
appeared to match the objective SOA between the two displays.
These observations were confirmed by analyses of N2pc amplitudes and onset
latencies. In a repeated-measures ANOVA of N2pc mean amplitudes with the factors display
sequence (H1 versus H2 targets), SOA (10, 20, 50, or 100 ms), and laterality (electrode
contralateral versus ipsilateral to the side of the horizontal target) a main effect of laterality,
F(1,11) = 59.21, p < .001, ηp2 = .84, confirmed that N2pc components were reliably elicited
by horizontal shape-defined target items. There were no main effects of SOA or display
sequence, F < 1, and no significant interactions between SOA and laterality, F(3,33) = 1.31, p
= .287, ηp2 = .11, or between display sequence and laterality, F(1,11) = 3.64, p = .083, ηp2 =
.25, indicating that the size of the N2pc did not differ systematically between SOA
conditions, or between H1 and H2 targets. As can be seen in Figure 2 (bottom panel), the
N2pc to H2 targets tended to be larger than the N2pc to H1 targets in the SOA 100
condition, but an analysis conducted separately for this condition showed that this
difference was not statistically reliable, F(1,11) = 3.72, p = .08, ηp2 = .25. Follow up t-tests
comparing contra- with ipsilateral activity separately for H1 and H2 targets and all four SOA
conditions confirmed that all eight N2pc components were reliably present, all t(11) > 6.29,
14
A repeated-measures ANOVA of N2pc onset latency values with the factors SOA and
display sequence (H1 versus H2 targets) revealed a significant interaction between these
two factors, Fc(3,33) = 28.98, p < .001, ηp2c = .72, showing that N2pc onset latency
differences between H1 and H2 targets differed across SOA conditions. N2pc latencies in
response to H1 and H2 targets were compared using paired t-tests, separately for each SOA
condition. In blocks where both displays were separated by a 100 ms SOA, N2pc
components to H1 and H2 targets emerged at post-stimulus latencies of 211 ms and 341 ms,
tc(11) = 19.60, p < .001, ηp2c = .97. In the SOA 50 condition, the respective N2pc onset
latencies were 231 ms and 274 ms, tc(11) = 2.78, p < .01, ηp2c = .41. For the two shortest SOA
conditions, N2pc components to H1 and H2 targets emerged at post-stimulus latencies of
217 ms and 228 ms (SOA 20 condition) and 215 and 225 ms (SOA 10 condition). However,
these two onset latency differences failed to reach significance, both tc(11) < 1.4, both p >
.20, both ηp2c < .15.
Discussion of Experiment 1
Experiment 1 investigated the speed with which attention is allocated to two
shape-defined targets when these targets are presented in rapid succession. In all four SOA
conditions, H1 and H2 targets elicited solid N2pc components. The onset delay between
these two N2pc components (130 ms in the SOA 100 condition, 43 ms in the SOA 50
condition, and 10 ms in the SOA 20 and SOA 10 conditions) approximately matched the
objective SOA between the two search displays. This temporal pattern of N2pc components
was very similar to the results previously observed for colour-defined targets (Eimer &
Grubert, 2014), and provides no evidence that the shape-guided selection of multiple
targets operates more slowly than target selection processes that are guided by colour. If
this had been the case, attentional target selection as reflected by the N2pc should have
been substantially delayed, in particular for targets in the second display. In fact, across all
four SOA conditions, N2pc components to H1 and H2 targets were both elicited
approximately 220 ms after the onset of the search display that included the respective
target. This was confirmed by an additional analysis where N2pc onsets in response to H1
15
the first and second display, respectively. N2pc onset latencies were nearly identical for H1
and H2 targets (219 ms versus 222 ms; tc(11) < 1).
In the SOA 100 condition, non-overlapping N2pc components were observed
(analogous to previous findings for colour-defined targets; see Eimer & Grubert, 2014),
which would be consistent with two temporally separate serial selection processes. To
dissociate serial and parallel selection, the results from the three shorter SOA conditions are
critical. N2pc components to H1 and H2 targets in these conditions were identical in size and
overlapped in time (see Figure 2, right panels), which strongly suggests that two attentional
selection processes were elicited in parallel. The hypothesis that, in contrast to
colour-guided selection processes, the attentional selection of shape-defined targets operates in a
serial fashion would have predicted no overlap between N2pc components to H1 and H2
targets in any SOA condition of Experiment 1, as focal attention would need to be
withdrawn from the first target location in order to be re-allocated to the second target.
This was clearly not the case. If the shape-guided selection of multiple targets was a serial
process, two possible outcomes would have been expected. Firstly, if serial selection was
relatively slow, allocating attention to H2 targets should have been particularly difficult for
the shortest SOA conditions, where these targets may have already disappeared before
attention could be deployed to their location. This should have resulted in impaired
performance and strongly attenuated N2pc components to H2 targets, in particular in the
SOA 10 and SOA 20 conditions. Secondly, if serial selection processes were very fast, it may
have been possible to shift attention extremely rapidly from the first to the second target in
these short SOA conditions. Although performance may be spared in this case, N2pc
components to H1 targets should have been severely attenuated in the SOA 10 and 20
conditions. No support for either of these predictions was obtained in Experiment 1. There
were no reliable N2pc amplitude differences between H1 and H2 targets in any of the four
SOA conditions (see Figure 2), demonstrating that the deployment of attention to either of
these two targets was not impaired when they followed each other in rapid succession.
Furthermore, task performance was not impaired with short SOAs. In fact, performance was
better in the three shorter SOA conditions relative to blocks where the two displays were
separated by a 100 ms SOA. The reasons for these performance costs in the SOA 100
16
It should be noted that the N2pc onset latencies to H1 versus H2 targets in
Experiment 1 did not match the objective onset difference between the two successive
displays as precisely as was previously found for colour-guided target selection (Eimer &
Grubert, 2014; see also Experiment 1 of Grubert & Eimer, 2015). In these previous studies,
the N2pc to H2 targets was significantly delayed relative to the N2pc to H1 targets even
when the SOA between these two targets was only 10 ms. Although N2pc components to
H1 targets also emerged numerically earlier than the N2pc to H2 targets in the SOA 10 and
SOA 20 conditions of Experiment 1, these onset latency differences were not statistically
reliable. This may suggest that attentional selection processes based on shape signals may
be temporally less precise (i.e., less exactly coupled to the objective onset of a particular
target stimulus) than colour-guided selection processes, perhaps because colour signals
become available more rapidly than information about other sensory attributes such as
form or motion direction (e.g., Zeki, 2016). The existence of even a small temporal jitter
across trials may result in some temporal smearing of N2pc components to H1 and H2
targets when SOAs are very short. In the two longer SOA conditions, reliable N2pc onset
latency differences between H1 and H2 targets were observed.
Overall, the results from Experiment 1 demonstrate that the time course of the
attentional selection of two target objects defined by their shape is very similar to the time
course of colour-guided target selection (Eimer & Grubert, 2014). They strongly suggest that
attention can be allocated rapidly and in parallel to successively presented target objects,
regardless of whether these targets are defined by a particular colour or a specific shape.
Such rapid parallel attentional selection processes are clearly not restricted to situations
where targets are defined by their colour. However, they may only be available during
search for target objects that share a particular known visual attribute, but not under
conditions where targets differ in their visual-perceptual features, and are instead defined
by their category. This was tested in Experiment 2.
Experiment 2
When the physical features of target objects are known in advance, their attentional
17
may be substantial differences in the ability of different visual features to guide attention
(e.g., Wolfe & Horowitz, 2004), it is generally assumed that target selection processes
operate more rapidly and more efficiently when search targets are defined by one or more
visual-perceptual attributes than under conditions where these targets are defined at a
more abstract level in terms of their category membership. In fact, Wolfe & Horowitz (2004)
have argued that information about the category membership of target objects (e.g., their
alphanumerical or semantic category) is unlikely to guide the deployment of spatial
attention in visual search tasks. Many studies have demonstrated that search for specific
visual target features is much more efficient than search for category-defined targets (e.g.,
Malcolm & Henderson, 2009; Yang & Zelinsky, 2009). When targets are defined by visual
features, their selection can be based on a direct match between a stored feature template
and the physical attributes of particular objects. During category-based search, objects
within the current target category will often differ substantially with respect to their
physical features, ruling out the possibility of a feature-based match with a particular target
template as the mechanism of target selection. The important role of visual representations
of target-defining properties for fast attentional selection has been demonstrated by
behavioural and ERP visual search studies which have shown that search targets are
detected more rapidly when they are specified by visual as compared to verbal descriptions
(Wolfe, Horowitz, Kenner, Hyle, & Vasan, 2004; Nako, Smith, & Eimer, 2015).
If there are such qualitative differences in the control of attentional selection
between feature-based and category-based search tasks, this may affect the availability of
rapid parallel target selection mechanisms in situations where multiple targets are
encountered in rapid succession. Such mechanisms may operate only under conditions
where targets are defined by particular visual attributes such as their colour (Eimer &
Grubert, 2014) or shape (Experiment 1 of the present study), but not in tasks where
different possible target objects are physically dissimilar and their status as targets depends
on their category membership. This prediction was tested in Experiment 2, which used the
same procedures as Experiment 1, except that targets were now defined by their
alphanumerical category. One each trial, two successively presented displays contained one
letter and one digit on opposite sides (Figure 1, bottom panel). Half of all participants were
instructed to select the two digits and to decide whether or not these target objects
18
to select the two successively presented letters to make an analogous judgment (vowels
versus consonants). As in Experiment 1, the two displays were separated in different blocks
by SOAs of 100, 50, 20, or 10 ms, and N2pc components were measured in response to
horizontally presented category-defined target objects in the first or second display (H1 and
H2 targets). If the mechanism of guiding attention rapidly and in parallel to multiple target
objects when targets are defined by colour or shape is not available when target selection
has to be based on alphanumerical category, the pattern of N2pc components to H1 and H2
targets should be very different from the pattern observed in our previous study (Eimer &
Grubert, 2014) and in the current Experiment 1. A delay of N2pc components to H1 targets
relative to Experiment 1 would show that the deployment of attention to category-defined
targets operates more slowly than the allocation of attention to target objects defined by a
particular shape. Critically, if category-guided attention cannot be allocated rapidly and in
parallel to multiple targets, N2pc components to H2 targets should be considerably delayed
or attenuated, especially for the shorter SOA conditions, and task performance should be
impaired when the SOA between the two targets is short. Alternatively, if rapid and parallel
attentional allocation to multiple objects is a general mechanism of target selection that is
even available when selection processes are category-based, Experiment 2 should reveal a
qualitatively similar temporal pattern of N2pc components as was observed in Experiment
1.
Methods
Participants
Thirteen participants were paid to take part in this study. One of them was excluded
from analysis due to excessive eye movement activity. The remaining twelve participants
were aged between 20 and 40 years (mean age 30 years). Eight were female and four were
left-handed. All participants had normal or corrected-to-normal vision.
Stimuli and procedure
The procedure was identical to that of Experiment 1, except that stimuli were grey
letters (A, D, E, K, N or U) and digits (2, 4, 5, 6, 7, or 9), and the target was defined by its
19
width (0.8° x 0.8°). Target objects were all objects in one category and distractor objects
were all objects in the other category (Figure 1, bottom panel). Each participant was
assigned a target category that remained constant throughout the entire experiment. For
half of the participants, the target items were letters, for the other half they were digits.
Participants’ task was to report whether the two successively presented category-defined
targets belonged to the same sub-category (for letter targets, both vowels or both
consonants; for digit targets, both odd or both even) or a different sub-category (one vowel
and one consonant, or one odd and one even digit) by pressing one of two purpose-built
vertically aligned response keys. Every other aspect of stimulus presentation and procedure
was identical to Experiment 1.
EEG recording and data analyses
All EEG recording and data analyses were identical to those used in Experiment 1. As
in Experiment 1, the fixed N2pc mean amplitude window for H1 targets was 210-310 ms,
and H2 mean amplitude windows were again defined as four 100 ms intervals centred on
N2pc peak latencies for each SOA condition, rounded to the nearest 5 ms. These windows
were 215-315 ms (SOA 10), 235-335 ms (SOA 20), 280-380 ms (SOA 50), and 335-435 ms
(SOA 100) in Experiment 2. To justify the use of a 50% peak amplitude criterion to define
N2pc onset latencies, it was again tested whether N2pc peak amplitudes differed reliably
between task conditions. N2pc peak amplitudes for these two types of targets were
computed and compared with jackknife-based analyses within the same post-stimulus time
windows as in Experiment 1. An ANOVA with the factors display sequence (H1 versus H2
targets) and SOA (10, 20, 50, and 100 ms) found no significant main effects and no
interaction between these two factors, confirming that N2pc peak amplitudes did not differ
systematically between H1 and H2 targets or between the four SOA conditions.
Results
Behavioural performance
Anticipatory or exceedingly slow responses (RTs faster than 200 ms or slower than
1500 ms) were removed from analysis, resulting in the exclusion of less than 0.3% of all
20
sequence (H1 versus H2 targets) revealed no significant main effect of SOA on RTs (SOA 100:
667 ms, SOA 50: 688 ms, SOA 20: 710 ms, SOA 10: 710 ms; F(3,33) = 2.35, p = .091, ηp2 =
.18). Subsequent paired t-tests found a non-significant trend for faster RTs in the SOA 100
than SOA 10 and 20 conditions (SOA 10 vs. SOA 100: t(11) = 1.95, p = .077, d = .48; SOA 20
vs. SOA 100: t(11) = 2.14, p = .056, d = .45). There was no main effect of display sequence on
RTs, and no interaction between SOA and display sequence, both F < 1.6. Error rates were
statistically identical across SOA conditions (SOA 100: 3.1%, SOA 50: 3.0%, SOA 20: 3.3%,
SOA 10: 3.0%), F(3,33) < 1. There was no main effect of display sequence and no interaction
between SOA and display sequence on error rates, both F < 1.
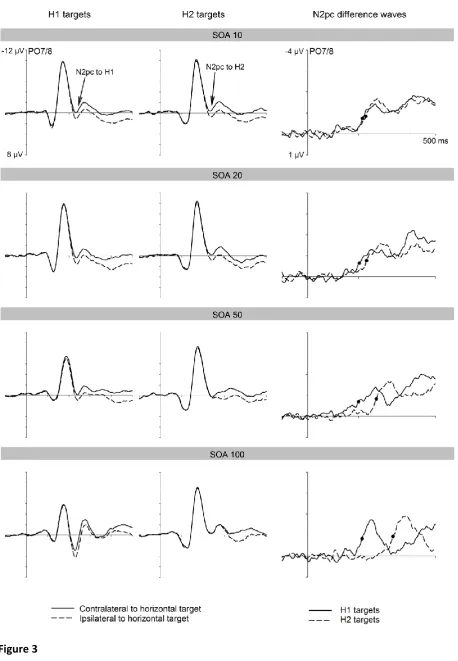
N2pc components
Figure 3 (left and middle panels) shows ERPs at posterior electrodes PO7/8
contralateral and ipsilateral to the side of the horizontal alphanumerically defined target in
the first display (H1 targets) or in the second display (H2 targets). ERPs are shown separately
for each SOA condition, together with N2pc difference waveforms obtained by subtracting
ipsilateral from contralateral ERPs for H1 and H2 targets. Analogous to Experiment 1, N2pc
components of similar size were elicited to both H1 and H2 targets in all four SOA
conditions, with onset latencies that mirrored the objective SOA between the two displays.
N2pc components to H1 and H2 targets again overlapped in time for the three shorter SOA
conditions.
These observations were confirmed by analyses of N2pc amplitudes and onset
latencies. In a repeated-measures ANOVA of N2pc mean amplitudes with the factors display
sequence (H1 versus H2 targets), SOA (10, 20, 50, or 100 ms), and laterality (electrode
contralateral versus ipsilateral to the side of the horizontal target) a main effect of laterality,
F(1,11) = 37.45, p < .001, ηp2 = .77, confirmed that N2pc components were reliably elicited
by horizontal category-defined target items. There were no main effects of SOA or display
sequence, and no significant interaction between SOA and laterality, all F < 1. The
interaction between display sequence and laterality reached significance, F(1,11) = 5.24, p <
.05, ηp2 = .32, suggesting that there was a small but reliable tendency for N2pc amplitudes
to be larger for H2 relative to H1 targets (see Figure 3). However, additional analyses
21
between laterality and display sequence, all F(1,11) < 2.78, all p > .123, ηp2 < .21. Eight
follow up t-tests revealed that N2pc components to both H1 and H2 targets were reliably
present in all four SOA conditions, all t(11) > 3.33, all p < .01, all d > .21.
A repeated-measures ANOVA of N2pc onset latencies with the factors SOA and
horizontal display sequence revealed a significant interaction between both factors, Fc(3,33)
= 21.46, p < .001, ηp2c = .66, demonstrating that the onset of N2pc components to H1 and
H2 targets was sensitive to the objective time interval between the two displays. Four
follow-up t-tests compared N2pc onset latencies to H1 and H2 targets for each SOA
condition. In the SOA 100 condition, where the two N2pc components showed no temporal
overlap, their onset latency difference was 121 ms (214 vs. 336 ms; tc(11) = 13.22, p < .001,
ηp2c = .94). In the SOA 50 condition, this difference was 71 ms (199 vs. 270 ms), tc(11) = 6.48,
p < .001, ηp2c = .79). In contrast to Experiment 1, there was now also a significant N2pc onset
latency difference between H1 and H2 targets of 29 ms in the SOA 20 condition (203 vs. 231
ms; tc(11) = 2.48, p < .05, ηp2c = .36). In the SOA 10 condition, the N2pc to H1 targets
preceded the N2pc to H2 targets by 13 ms (215 vs. 228 ms), and this difference approached
significance, tc(11) = 2.09, p = .061, ηp2c = .28.
Discussion of Experiment 2
The temporal pattern of N2pc components to H1 and H2 targets in Experiment 2 was
very similar to the pattern found in Experiment 1, in spite of the fact that target selection
could no longer be guided by a visual feature (shape), but was instead determined by the
alphanumerical category of target objects. The onset latency of the N2pc to horizontal
targets in the first display (208 ms, averaged across all four SOA conditions) was similar to
the corresponding N2pc latency for H1 targets in Experiment 1 (219 ms), demonstrating that
the attentional selection of category-defined targets was not systematically delayed relative
to the selection of shape targets. N2pc components triggered by H1 and H2 targets were
equal in size and overlapped in time in the SOA 10, 20, and 50 conditions (see Figure 3). As
in Experiment 1, the onset delay between these two N2pc components (129 ms, 71 ms, 29
ms, and 13 ms, for the SOA 100, 50, 20, and 10 conditions) approximately matched the
objective SOA between the two search displays, indicating that the attentional selection of
22
to Experiment 1, there was a small but reliable delay in the onset of the N2pc to H2 targets
(measured relative to the onset of the second display) relative to the onset of the N2pc to
H1 targets (208 ms versus 221 ms; averaged across all four SOA conditions; tc(11) = 2.61, p <
.01, ηp2c = .54).2 This suggests that when two category-defined targets are presented in rapid
succession, the deployment of attention to the second target object may be slightly but
systematically delayed relative to the initial attentional selection of the first target.
Overall, the results of Experiment 2 provide strong evidence that the rapid parallel
selection of multiple target objects is not restricted to situations where targets are defined
by specific visual features such as colour or shape, but also operates when it has to be based
on the alphanumerical category of visual objects. If the category-based attentional
deployment to target objects presented in rapid succession was based on slow serial
attentional selection mechanisms, N2pc components to H2 targets should have been
strongly delayed and attenuated in Experiment 2, particularly for the short SOA conditions,
and behavioural performance should have been strongly impaired in these conditions. No
evidence for this was found in the N2pc waveforms, or in the pattern of behavioural results.
There were no systematic differences in RTs or error rates between the four SOA conditions,
demonstrating that decreasing the interval between the two category-defined targets did
not impair participants’ ability to select and identify both of them.
The rapid selection of category-defined targets observed in Experiment 2 is in line
with previous behavioural studies demonstrating that information about category
membership can affect attentional control processes. Nontarget objects which are
physically dissimilar but semantically linked to current targets can attract attention during
visual search (e.g., Moores, Laiti, & Chelazzi, 2003; Belke, Humphreys, Watson, Meyer, &
Telling, 2008; see also Telling, Kumar, Meyer, & Humphreys, 2010, for ERP evidence). Along
similar lines, images of real-world visual objects that match the current search target
category can capture attention even when they are presented at task-irrelevant locations
(Wyble, Folk, & Potter, 2013), indicating that information about object categories can be
2
To determine whether this N2pc onset delay to H2 versus H1 targets in Experiment 2 differed across SOA conditions, we ran an additional ANOVA of these latency values with the factors SOA (10, 20, 50, or 100 ms) and display sequence (H1 versus H2). There was a main effect of display sequence, Fc(1,11) = 11.43, p < .01, ηp2c = .51, reflecting the delayed N2pc to
H2 targets, but no interaction between display sequence and SOA, Fc< 1, demonstrating
23
encoded rapidly and can affect the deployment of attention in a task-set contingent fashion
(see also Castelhano, Pollatsek, & Cave, 2008, and Maxfield, Stadler, & Zelinsky, 2014, for
evidence that the typicality of target objects in terms of their category can affect visual
search performance). The speed of such category-based attentional selection processes has
been investigated in recent N2pc studies from our lab which used category-based visual
search tasks where a single target object appeared together with multiple distractor objects.
N2pc components to target objects appeared approximately 200 ms after display onset
when observers searched for any letter among digits, or vice versa (Nako, Wu, & Eimer,
2014), and around 240 ms post-stimulus in a task where targets were line drawings of
real-world objects from a specific category (kitchen objects among items of clothing, or vice
versa; Nako et al., 2015). While these findings demonstrate that the category-based
selection of single target objects can be triggered remarkably rapidly, the results of
Experiment 2 show that multiple category-guided selection processes can be elicited in
parallel and independently. The mechanisms that may be responsible for this rapid parallel
selection of category-defined targets will be considered in the General Discussion.
General Discussion
The aim of the present study was to determine whether the rapid parallel
mechanisms for the attentional selection of multiple targets that can be activated in tasks
where targets are defined by colour is also available when target selection is controlled by
other attributes. In Experiment 1, targets were defined by shape and in Experiment 2 by
alphanumerical category. Relative to colour, shape and in particular category are believed to
be less efficient in guiding attentional target selection in visual search (see Wolfe &
Horowitz, 2004). When pairs of shape-defined or category-defined targets appear in rapid
succession, their selection may therefore be less rapid than colour-based selection, or may
operate serially rather than in a parallel fashion. This should be reflected in a systematically
different temporal pattern of N2pc components in response to the successively presented
two target objects than in experiments where colour was the target-defining attribute
24
The N2pc results observed in the current study did not provide any evidence for the
assumption that there are systematic temporal and functional differences between the
attentional selection of multiple successive target objects when these targets are defined by
colour, shape, or alphanumerical category. In Experiment 1, where target objects are
defined by shape, temporally overlapping N2pc components were elicited in the short SOA
conditions in response to horizontal targets in the first and second display. The onset of
these N2pc components to H1 and H2 targets matched the objective time interval between
these two targets. When N2pc latencies to H1 and H2 targets were computed relative to the
onset of the first or second display, respectively, there was no delay in N2pc onset latencies
to H2 as compared to H1 targets, and no amplitude differences between these two N2pc
components, demonstrating that the attentional selection of a second shape-defined target
was not delayed or impaired when another shape target at another location had been
selected immediately before. The pattern of N2pc components observed in Experiment 1
was very similar to the pattern previously found for during the selection of multiple
colour-defined targets (e.g., Eimer & Grubert, 2014), which strongly suggests that colour and shape
are attributes that are both equally available for the control of rapid parallel and
independent attentional selection processes.
Perhaps the most surprising outcome of the present study was that essentially the
same temporal pattern of N2pc components to H1 and H2 targets was observed in
Experiment 2 where target objects were defined by their alphanumerical category. These
N2pc components were again equal in size and overlapped in time in the short SOA
conditions, which suggests that the selection of category-defined targets that appear in
rapid succession is based on the same fast parallel attentional processes that are activated
when targets are defined by a visual feature (colour or shape). In contrast to Experiment 1,
there was a small but systematic delay in the onset of N2pc components to H2 versus H1
targets (relative to the onset of their respective stimulus displays) in Experiment 2, which
suggests that the two successive target selection processes may not be entirely
independent, but that the category-guided allocation of attention to a new target object
starts slightly later when attention has already been deployed to another category-defined
target at a different location. The fact that the selection of the second target was delayed
relative to the selection of the first target by approximately 10 ms in Experiment 2 but not in
25
target objects were defined either by the same colour or two different colours (Grubert &
Eimer, 2015). In this study, there was a small but systematic delay of the N2pc to H2 targets
on trials where the two targets differed in colour. This was attributed to costs that arise
when there is a feature change between these targets, so that the selection of the second
target cannot be guided by the same feature-specific template that was activated during the
selection of the first target object. An analogous explanation may also account for the small
delay of the N2pc to H2 targets in Experiment 2, where the two target objects belonged to
the same category but were physically different, and the absence of such a delay in
Experiment 1, where both target objects had the same shape.
Overall, the results of Experiment 2 indicate that alphanumerical category may be
just as efficient as colour and shape in controlling the rapid parallel allocation of attention to
multiple target objects. The behavioural results observed in Experiments 1 and 2 also
suggested that attention was deployed rapidly and in parallel both to shape-defined and to
category-defined objects. There were no systematic performance differences between
these two tasks, as confirmed by between-participant analyses across both experiments,
which found no reliable differences in RTs, F(1,22) < 1, or error rates, F(1,22) = 1.78, p =
.196, ηp2 = .07, between the shape and category selection tasks of Experiments 1 and 2. If
the allocation of attention to shape- or category-defined target objects was slow or
operated in a serial fashion, the selection of target objects in the second display should have
been particularly challenging when the SOAs between the two displays were very brief, and
this should have been reflected by impaired performance in the short SOA conditions. No
such performance costs for short SOAs were observed in either experiment. In Experiment
2, RTs and error rates did not differ between the four SOA conditions. In Experiment 1,
participants performed worse when the SOA between the two displays was 100 ms relative
to blocks with shorter SOAs. These performance costs in the SOA 100 condition are likely
due to the fact that a perceptual comparison between the two successively presented target
shapes was required in Experiment 1, as participants had to decide whether these shapes
had a gap on the same side or on opposite sides. Previous research investigating the
mechanisms of matching successively presented visual stimuli (e.g., Brockmole, Wang, &
Irwin, 2002; Dalvit & Eimer, 2011) have found good matching performance when the
interval between the two stimuli was either very short (below 100 ms) or long (300 ms or
26
results was interpreted as evidence for the existence of two qualitatively different types of
matching processes. With very short intervals between two targets, a sensory-perceptual
representation of the first target is still available when a visual representation of the second
target is generated, and both representations can be directly compared (percept-percept
matching). With longer intervals, a representation of the first target has been encoded in
working memory, and can be compared with a perceptual representation of the second
target (image-percept matching). When the interval between both targets is intermediate,
the sensory representation of the first target is no longer available and a working memory
representation of this target has not yet been formed, resulting in strong impairments for
matching performance. It is likely that the behavioural costs observed for the SOA 100
condition in Experiment 1 are due to the fact that a sensory representation of the first
target shape had already faded at the time when a perceptual representation of the second
target was formed, and a working memory representation was not yet available. No such
performance impairments for the SOA 100 condition were observed in Experiment 2,
presumably because response selection did not require a perceptual comparison between
the two targets, but instead a judgment with respect to their alphanumerical subcategory
(odd/even; vowel/consonant).3
If attention can be allocated rapidly and in parallel to multiple target objects not only
when these objects are defined by a specific visual attribute, but also when they are defined
by their alphanumerical category, which attentional control mechanisms are responsible for
these remarkably fast and flexible selection processes? Attentional target selection is
assumed to be controlled by attentional templates that represent currently relevant
target-defining features (e.g., Desimone & Duncan, 1995; Duncan, 2006). Such templates may be
implemented by target-selective baseline shifts of neural activity that emerge prior to the
arrival of visual input during the preparation for a particular selection task (e.g., Chelazzi,
3
This difference between the two experiments was also confirmed by the comparison of error rates between the two tasks, which found an interaction between task (shape selection versus category selection) and SOA, F(3,66) = 10.58, p < .001, ηp2 = .32. Follow-up