BIROn - Birkbeck Institutional Research Online
Shalev, N. and Farkaš, J. and Fietzke, J. and Novák, M. and Schuessler, J.A.
and Pogge von Strandmann, Philip A.E. and Törber, P.B. (2018) Mg Isotope
Interlaboratory Comparison of Reference Materials from Earth-Surface
Low-Temperature Environments. Geostandards and Geoanalytical Research 42
(2), pp. 205-221. ISSN 1639-4488.
Downloaded from:
Usage Guidelines:
Please refer to usage guidelines at
or alternatively
Mg Isotope Interlaboratory Comparison of Reference Materials
from Earth-Surface Low-Temperature Environments
Netta
Shalev
(1, 2, 3)*, Juraj
Farka
s
(4, 5, 6), Jan
Fietzke
(7), Martin
Nov
ak
(5),
Jan A.
Schuessler
(8), Philip A.E.
Pogge von Strandmann
(9, 10)and Philip B.
T
orber
€
(4, 5, 6)(1) Institute of Earth Science, The Hebrew University of Jerusalem, Edmond J. Safra Campus, Jerusalem, 91904, Israel (2) Geological Survey of Israel, 30 Malkhe Israel Street, Jerusalem, 95501, Israel
(3) Department of Earth Sciences, Institute of Geochemistry and Petrology, ETH Z€urich, Clausiusstrasse 25, Z€urich, 8092, Switzerland (4) Faculty of Environmental Sciences, Czech University of Life Sciences Prague, Kamycka 129, Prague 6, 165 21, Czech Republic (5) Department of Geochemistry, Czech Geological Survey, Geologicka 6, Prague 5, 152 00, Czech Republic
(6) Department of Earth Sciences, University of Adelaide, North Terrace, Adelaide, SA, 5005, Australia (7) GEOMAR Helmholtz Center for Ocean Research Kiel, Wischhofstr. 1-3, Kiel, 24148, Germany (8) GFZ German Research Centre for Geosciences, Telegrafenberg, Potsdam, 14473, Germany
(9) London Geochemistry and Isotope Centre (LOGIC), University College London, and Birkbeck, University of London, Gower Street, London, WC1E 6BT, UK
(10) Bristol Isotope Group (BIG), Bristol University, Wills Memorial Building, Queen’s Road, Bristol, BS8 1RJ, UK * Corresponding author. e-mail: [email protected]
To enable quality control of measurement procedures for determinations of Mg isotope amount ratios, expressed as
d26Mg andd25Mg values, in Earth-surface studies, thed26Mg andd25Mg values of eight reference materials (RMs) were determined by interlaboratory comparison between five laboratories and considering published data, if available. These matrix RMs, including river water SLRS-5, spring water NIST SRM 1640a, Dead Sea brine DSW-1, dolomites JDo-1 and BCS-CRM 512, limestone BCS-CRM 513, soil NIST SRM 2709a and vegetation NIST SRM 1515, are representative of a wide range of Earth-surface materials from low-temperature environments. The interlaboratory variability, 2s(twice the standard deviation), of all eight RMs ranges from 0.05 to 0.17‰ind26Mg. Thus, it is suggested that all these materials are suitable for validation ofd26Mg andd25Mg determinations in Earth-surface geochemical studies.
Keywords: Earth-surface, interlaboratory comparison, low-temperature, Mg isotopes, reference materials.
Received 24 Jul 17–Accepted 29 Jan 18
Magnesium is a major element of the silicate Earth and vital in biogeochemical cycling. It has three stable isotopes: 24Mg (78.99%), 25Mg (10.00%) and 26Mg (11.01%).
Analytical improvements over the past decades have made the differentiation between the Mg isotope amount ratios (expressed as d26Mg and d25Mg relative to the interna-tionald-zero reference material DSM3; Equation (1); Galy et al. 2003, IUPAC, see Brand et al. 2014) of terrestrial materials possible and enable today’s rapid increase in the use of Mg isotopes as a powerful tool in investigations of Earth’s biogeochemistry (e.g., Young and Galy 2004, Teng 2017). Yet, determinations ofd26Mg andd25Mg values of natural samples are challenging, due to the significant risk of bias introduced during Mg purification, the large instrumental mass bias and the sensitivity of the
calibrator-sample bracketing (standard-sample-bracketing, SSB) measurements to matrix effects (e.g., Young and Galy 2004, An and Huang 2014, Teng 2017). Hence, processing well-characterised reference materials (RMs), similar in matrix to the samples, is required to validate the results. While d26Mg and d25Mg values of silicate rock RMs are available for high-temperature systems (Tenget al. 2015), Mg isotope data of RMs representative of samples with complex matrices from Earth-surface low-temperature environments are scarce (Bolou-Bi et al.2009, Fosteret al. 2010, An and Huang 2014, Teng 2017). To assess systematic errors and achieve comparability of Mg isotope data between different laboratories concerning Earth-surface low-temperature systems, well-characterised matrix RMs need to be established.
Vol. 42 — N° 2 0 61 8 P . 2 0 5–2 2 1
d26Mg and d25Mg values are being used as a biogeochemical tool to study many different processes in low-temperature environments, for example in marine envi-ronments and marine sediments and rocks (e.g., Ling et al. 2011, Wombacher et al. 2011, Pogge von Strandmann et al.2014, Higgins and Schrag 2015), evaporitic environ-ments (e.g., Geskeet al.2015, Shalevet al.2017), soils and vegetation (e.g., Tipper et al.2010, Opfergeltet al.2012, Pogge von Strandmannet al.2012, Maet al.2015, Uhlig et al.2017) and groundwater, spring water and rivers (e.g., Tipper et al. 2006a, b, Brenot et al. 2008, Pogge von Strandmann et al. 2008, Chapela Lara et al. 2017). The most fractionated materials on Earth are found in low-temperature environments, with the lowest d26Mg values found in carbonates (d26Mg of-5.6‰, Wombacher et al. 2011) and the highest in weathered residual silicates (d26Mg of+1.8‰, Liu et al. 2014) and evaporites (d26Mg= +1.4‰, Permian carnallite, Shalev et al. 2017). However, the only natural Earth-surface RM which is well characterised to date is seawater (d26Mg of
-0.83±0.09‰; 2s;N=90; Fosteret al.2010, Linget al. 2011 and references therein). Publishedd26Mg andd25Mg data of Earth-surface materials from more than two laboratories (N>2) are also available for limestone Cal-S (-4.38±0.09‰, 2s, N=3; Wombacher et al. 2006, Bolou-Bi et al. 2009), shale SCo-1 (-0.89 ±0.08‰, 2s, N=3), aragonite JCp-1 (-1.96±0.05‰, 2s,N=4) and dolomite JDo-1 (-2.37 ±0.04‰, 2s, N=5; Teng 2017 and references therein). Here, N is used to denote the number of full-procedure replicates, that is independent sample dissolution and Mg purification, while nis used to denote the number of repeated measurements of the purified Mg sample solutions by MC-ICP-MS. 2s is twice the standard deviation onNornvalues.
In this study, thed26Mg andd25Mg values of eight RMs (Table 1), representative for their respective Earth-surface environments, were estimated by interlaboratory comparison, conducted in five laboratories. The participating laboratories utilised different sample preparation methods, that is different analyte-matrix separation procedures, and MC-ICP-mass spectrometers from various manufacturers with different sample introduction systems (Table 2). This approach is suitable to test the applicability of these different measure-ment methods with respect to the varying chemical and physical material properties and to identify potential bias originating from differences in sample preparation and instrument set-up. Whereas measurement results from a single laboratory might produce very precise d26Mg and
d25Mg values for any material never analysed before, there is still the potential risk that the data are affected by undetected bias. We suggest that our interlaboratory
comparison study provides a robust and practicable approach to provide the geo-analytical community with fit-for-purpose d26Mg andd25Mg values for matrix RMs with confidence intervals constrained by the currently attainable level of measurement precision. Materials of this study included solids (carbonates, soil and organic material) and liquids (river water, spring water and brine) thereby representing most of the material types from Earth-surface low-temperature environments studied to date. Most selected RMs are provided by reference material producers and are widely available to the community. Also, certified mass fractions data are available for most materials studied in this work (Table 1). Based on the results of this study and published values, where available, recommended d26Mg and d25Mg values are proposed. These can be used as quality control RMs in laboratories analysing Earth-surface materials to verify their measurement methods.
Methods
Investigated materials
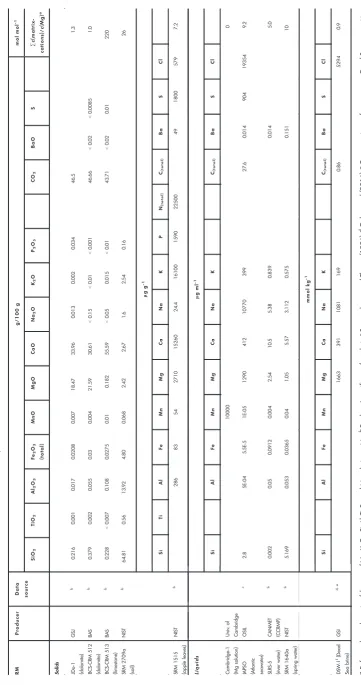
The investigated materials include dolomites JDo-1 and BCS-CRM 512, limestone BCS-CRM 513, NIST SRM 2709a soil, NIST SRM 1515 apple leaves, IAPSO Atlantic seawater, SLRS-5 river water, NIST SRM 1640a spring water and DSW-1 Dead Sea brine. Solid samples are powdered and require complete dissolution prior to the column chemistry. The published chemical compositions of the investigated materials are described in Table 1. ∑c(Matrix cations)/c (Mg) molar ratios (i.e., the molar ratios of the sum of Na, K, Ca, Si, Al, Ti, Fe and Mn relative to Mg) of the RMs vary significantly: Na/Mg ratios range between 0.0 (carbonates) and 8.8 (seawater), Ca/Mg ratios range between 0.2 (seawater) and 220 (BCS-CRM 513 limestone) and K/Mg ratios range between 0.0 (JDo-1 and BCS-CRM 512 dolomites) and 3.7 (NIST SRM 1515 apple leaves). The soil (NIST SRM 2709a), spring water (NIST SRM 1640a) and limestone (BCS-CRM 513) have the most complex matrices with significant Si/Mg ratios (18, 3.3 and 0.8, respectively), Al/Mg ratios (4.6, 0.04 and 0.45, respectively), Fe/Mg ratios (1.0, 0.02 and 0.08, respectively) and Ti/Mg ratio (0.12 in the soil NIST SRM 2709a).
Measurement procedures
Ta bl e 1 . Re fere nce m ateri a ls st udi e d a nd their chemic a l composi tion RM P ro d u ce r D a ta so u rce g/ 100 g mo l m ol -1 SiO 2 Ti O2 Al 2 O3 Fe 2 O3 (to tal) MnO M gO C a O N a2 OK 2 OP 2 O5 CO 2 Ba O S ∑ c(m a tr ix -cation s)/ c(Mg) a
Solids JDo-1 (dolomite)
GSJ b 0.216 0.001 0.017 0.0208 0.007 18.47 33.96 0.013 0.002 0.034 46.5 1.3 BCS-CRM 512 (dolomite) BAS b 0.379 0.002 0.055 0.03 0.004 21.59 30.61 < 0.15 < 0.01 < 0.001 46.66 < 0.02 < 0.0085 1.0 BCS-CRM 513 (limestone) BAS b 0.228 < 0.007 0.108 0.0275 0.01 0.182 55.59 < 0.05 0.015 < 0.01 43.71 < 0.02 0.01 220 SRM 2709a (soil) NIST b 64.81 0.56 13.92 4.80 0.068 2.42 2.67 1.6 2.54 0.16 26 l gg -1 Si T i A l F e M n Mg C a N a K P N(t ota l) C(to ta l) Ba S C l SRM 1515 (apple leaves) NIST b 286 83 54 2710 15260 24.4 16100 1590 22500 49 1800 579 7.2 Li q u id s l gm l -1 Si A l F e M n Mg C a N a K C(to ta l) Ba S C l Cambridge-1 (Mg solution) Univ. of Cambridge 10000 0
IAPSO (Atlantic seawater)
[image:4.595.108.470.93.779.2]Potsdam, Germany; the Czech Geological Survey (CGS) in Prague (Czech Republic); and the GEOMAR Helmholtz Centre for Ocean Research, Kiel, Germany. The powdered or liquid RMs were split and spread among the different laboratories. Each laboratory conducted measurements, using its own previously established measurement proce-dure, to get completely independent results and potentially identify any method-specific bias. The different procedures for material digestion, Mg purification and instrumentation, conducted in each laboratory, are described below and summarised in Table 2. All Mg isotope ratio measurements were conducted by MC-ICP-MS using calibrator-sample bracketing (with DSM3 as the calibrator), and the calculated isotope amount ratios are reported as per mil deviation from the delta-zero reference material DSM3 in the delta notation according to Coplen (2011):
dxMg¼dx=24Mgsample=DSM3¼
ðxMg=24MgÞ
sample
ðxMg=24MgÞ
DSM3
1
" #
ð1Þ
where x denotes either 26 or 25 and DSM3 is the mean value of the two bracketing calibrators measured before and after the sample, respectively. Multiplication of Equa-tion (1) by a factor 1000 gives the per mil (‰) deviaEqua-tion relative to DSM3.
To validate the different measurement procedures used by the participating laboratories and to test for any potential interlaboratory bias, we adapted the following approach. During this study, Cambridge-1 and IAPSO Atlantic seawater were analysed by all participating laboratories. These results are compared with literature values (e.g., compilations in Teng 2017, An and Huang 2014, and the in GeoReM database, Jochumet al.2005) in order to validate the measurement procedure of each laboratory. Thereby, the pure Mg-solution Cambridge-1 was used to evaluate the repeatability preci-sion of the MC-ICP-MS measurements (solution not processed through columns) for each laboratory. Then, seawater was used to evaluate the intermediate precision of the entire measurement procedure for each laboratory, including sample pre-treatment, matrix separation by column chemistry and MC-ICP-MS analysis. In addition, a typical intermediate precision was estimated by each laboratory (Table 2), based on long-term (more than 1 year) repeated measurements of one or more matrix materials as detailed below (following subsections). The only case where this long-term experience with matrix material is missing is at GEOMAR, and therefore only Cambridge-1 repeatability precision was considered. These estimates are considered as a benchmark against which we can evaluate the precision obtained on the matrix
RMs investigated in this interlaboratory comparison study. Then, to provide consensus d26Mg andd25Mg values for each Earth-surface reference material, the arithmetic mean of N≥3 full-procedure replicates was calculated. These com-prised all data produced by the participating laboratories and–where available–literature data and are reported together with 95% confidence intervals.
Sample preparation and Mg isotope ratio
measure-ments at UCL and Bristol (BIG LOGIC): Procedures for
sample analyses are similar to those described in previous studies (Pogge von Strandmann 2008, Foster et al.2010, Pogge von Strandmann et al. 2011, 2012). A brief description is given below.
Carbonate powders (ca. 20 mg) were dissolved in 2 mol l-1 HCl. Apple leaves (NIST SRM 1515, ca 50 mg) were dissolved in repeated steps of concentrated HNO3, heated at 130°C and evaporated to dryness. Soil powders (ca. 10 mg) were dissolved in stages of concentrated HF-HNO3, followed by HNO3, and finally 6 mol l-1HCl. Water samples (ca.0.01–0.2 ml) were simply dried down. Subse-quently, the samples were dissolved in 2 mol l-1HNO
3, and a small aliquot (around 0.2–3lg Mg) was taken for column chemistry.
Magnesium analyte-matrix separation was performed by a two-stage cation exchange chemistry, using Bio-Rad AGâ 50W-X12 (200–400 mesh) resin in 2 mol l-1 HNO
3, as described by Pogge von Strandmann et al. (2011). Soil samples were subjected to an additional column to quanti-tatively remove Ti (because 48Ti2+ and 50Ti2+ are direct interferences on24Mg+and25Mg+). This column contained 0.25 ml of TRU-SpecTMresin, and Mg was eluted in 7 mol l-1 HNO3 (Pogge von Strandmann et al. 2012). The total procedural blank for Mg isotope ratio measurements by this method isca.0.4 ng Mg, which is insignificant compared to the amount of Mg put through chemistry (<0.2%). Splits of the elution were collected before and after the Mg collection bracket, to ensure close to 100% Mg yield was achieved, that is<0.1% of the processed Mg was detected in these splits.
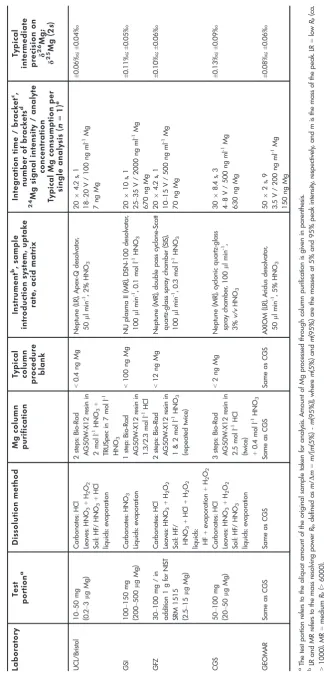
Table 2 . Summa ry o f a nalytica l techniq ue s u se d b y e a ch labo ratory Lab o rato ry Test por tion a Dissolution m e thod Mg column purif ication Typical colum n pro ce d ure bl ank Instrument b, sampl e introdu ction system, u ptake ra te , a ci d m a tr ix Integ ration time / b racket c, number of br ackets d 24 Mg sign al in ten sity / ana lyte concentr ation Typical M g con sump tion pe r sing le anal ysis ( n = 1) e Ty pical intermed iate p recisio n o n d 26 Mg; d 25 Mg (2 s ) UCL/Bristol 10 – 50 mg (0.2 – 3 µ g Mg) Carbonates: HCl Leaves: HNO 3 + H2 O2 Soil: HF/ HNO 3 + HCl liquids: evaporation 2 steps: Bio-Rad AG50W-X12 resin in 2 mol l -1HNO 3 + TRUSpec in 7 mol l -1 HNO 3 < 0.4 ng Mg Neptune (LR), Apex-Q desolvator, 50 µ l min -1,2 % HNO 3 20 9 4.2 s, 1 18 – 20 V / 100 ng ml -1Mg 7n gM g ± 0.06 ‰ ; ± 0.04 ‰ GSI 100 – 150 mg (200 – 500 µ g Mg) Carbonates: HNO 3 Liquids: evaporation 1 step: Bio-Rad AG50W-X12 resin in 1.3/2.3 mol l -1HCl < 100 ng Mg NU plasma II (MR), DSN-100 desolvator, 100 µ l min -1,0.1 mol l -1HNO 3 20 9 10 s, 1 25 – 35 V / 2000 ng ml -1Mg 670 ng Mg ± 0.11 ‰ ; ± 0.05 ‰ GFZ 30 – 100 mg / in addition 1 g for NIST SRM 1515 (2.5 – 15 µ g Mg) Carbonates: HCl Leaves: HNO 3 + H2 O2 Soil: HF/ HNO 3 + HCl + H2 O2 liquids: HF + evaporation + H2 O2 2 steps: Bio-Rad AG50W-X12 resin in 1 & 2 mol l -1HNO 3 (repeated twice) < 12 ng Mg Neptune (MR), double pass cyclone-Scott quartz-glass spray chamber (SIS), 100 µ l min -1,0.3 mol l -1HNO 3 20 9 4.2 s, 1 10 – 15 V / 500 ng ml -1Mg 70 ng Mg ± 0.10 ‰ ; ± 0.06 ‰ CGS 50 – 100 mg (20 – 50 µ g Mg) Carbonates: HCl Leaves: HNO 3 + H2 O2 Soil: HF/ HNO 3 liquids: evaporation 3 steps: Bio-Rad AG50W-X12 resin in 2.5 mol l -1HCl
(twice) +0.4
[image:6.595.133.458.96.782.2]measurement consisted of twenty ratios (84 s total integra-tion time). These condiintegra-tions gave typical signals of 18–20 V per 100 ng ml-1on24Mg. The on-peak background in 2% v/v HNO3 was repeatedly recorded during the sequence and subtracted from all calibrator and sample intensities. Each sample was analysed three or four times (n=3 or n=4 in Table 3) during the same session (336 s per sample), each time separated by several hours. The difference in the measured 26Mg/24Mg intensities ratio between bracketing DSM3 calibrators was≤0.06‰in all analyses performed for this study.
USGS (United States Geological Survey) and GSJ (Geological Survey of Japan) silicate rock reference material measurement results by this procedure are documented by Pogge von Strandmannet al.(2011), other silicate rocks by Tenget al.(2015), IAPSO Atlantic seawater results by Foster et al. 2010 and carbonates by Pogge von Strandmann 2008, Kasemannet al.(2014) and Pogge von Strandmann et al.(2014). For example, measurements of the pure Mg solution Cambridge-1 (without processing through columns) gave -2.63±0.07‰ for d26Mg and -1.36±0.06‰ for
d25Mg (2s, n=126) and IAPSO Atlantic seawater results were -0.82 ±0.06‰ ford26Mg and -0.43 ±0.04‰ for
d25Mg (2s, n=26, Fosteret al.2010). Hence, the typical intermediate precision of this method, based on several years of repeated measurements, is estimated at±0.06‰ (2s) ond26Mg, and±0.04‰(2s) ond25Mg. The results on reference materials agree with data obtained in other laboratories, indicating no bias outside the stated precision.
Sample preparation and Mg isotope ratio
measure-ments at GSI: Carbonate powders (ca. 100–150 mg)
were dissolved in HNO3and evaporated to dryness. Water samples (ca. 10ll DSW-1 and 2 ml IAPSO) were simply dried down. All samples were then redissolved in 10 ml 1.3 mol l-1 HCl, and an aliquot (200–500
lg Mg) was taken for column chemistry.
Magnesium purification was performed by liquid chro-matography (Galy et al. 2002) using Bio-Rad Econo-Pac Chromatography Columns 732-1010 with an extended reservoir, filled with ca. 18 ml of Bio-Rad AGâ50W-X12 100-200 mesh resin. The matrix was rinsed with 25 ml of 1.3 mol l-1HCl, and 20 ml of 2.3 mol l-1HCl. Mg2+was then eluted with 24 ml of 2.3 mol l-1HCl. Total procedural blanks contained <0.5% Mg of the amount of Mg processed through column chemistry. The first and the last 2 ml before and after the Mg elution were collected separately in order to verify close to 100% Mg recovery. In addition, the Mg amount in the Mg cut (Mg-COL) was compared to the amount originally loaded to the column
(Mg-ORIG). Only samples with Mg-COL/Mg-ORIG >95% (taking into account the uncertainties of both measurements), no detectable Mg in the first and the last 2 ml before and after the Mg fraction, and molar ratio of∑c(matrix cations)/c (Mg) in the final Mg fraction of<5% (after Galyet al.2001 and others) were used for isotope ratio measurements. These parameters were verified for each sample separation using ICP-AES (Optima 3300, Perkin–Elmer). Once Mg was purified, the solution was fully evaporated and the chloride salts were redissolved in 0.1 mol l-1HNO
3.
Magnesium isotope ratio measurements were con-ducted using a Nu instruments Plasma II HR-MC-ICP-MS. The 2 lg ml-1 Mg solutions (in 0.1 mol l-1 HNO
3) were introduced into the mass spectrometer via a DSN-100 desolvation system (self-aspirating PFA nebuliser, uptake rate of ca.100ll min-1) and standard Ni cones interface. The measurements were conducted using pseudo-high resolu-tion, with a 50 lm source slit at a mass resolving power RP(5,95%)=7000 (see footnote in Table 2). Three Faraday cup collectors were used to measure the ion beam intensities at m/z24, 25 and 26 simultaneously. Each measurement run comprises twenty integrations of 10 s data acquisition, that is a total 200 s of data acquisition per measurement. These conditions gave sample signal intensities of 25–35 V onm/z24. The zero reference points were reset simultane-ously for all measured masses by deflecting the potential of the electrostatic analyser before measuring each block. A blank solution measured in the beginning of each mea-surements day produced<5 mV onm/z24, and therefore, the difference from the off-peak zero is considered insignif-icant. Each sample solution was measured by several brackets of calibrator-sample-calibrator, which were used for statistical analysis, wherenis the number of brackets of each sample. Outliers were eliminated as long as their elimination reduced the 95% confidence intervalð¼t sffiffi
n
pÞ,
despite the reduction of n that rises both 1ffiffi
n
p and the t-distribution value.
Table 3.
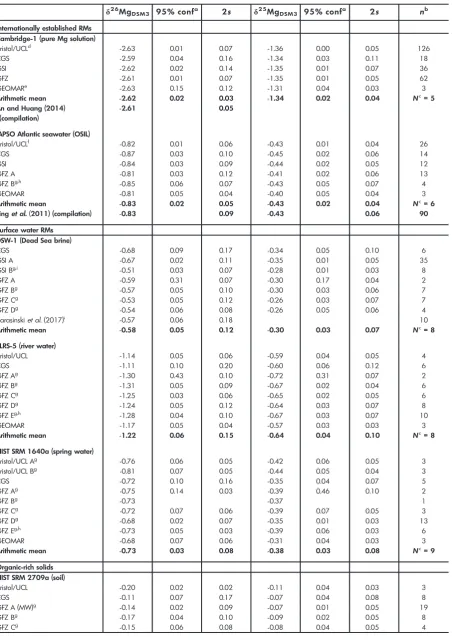
d26Mg and d25Mg values of the low-temperature RMs determined in the current and previous studies
d2 6MgD SM3 95% confa 2s d25MgDSM3 95% confa 2s nb
Internationally established RMs Cambridge-1 (pure Mg solution)
Bristol/UCLd -2.63 0.01 0.07 -1.36 0.00 0.05 126
CGS -2.59 0.04 0.16 -1.34 0.03 0.11 18
GSI -2.62 0.02 0.14 -1.35 0.01 0.07 36
GFZ -2.61 0.01 0.07 -1.35 0.01 0.05 62
GEOMARe -2.63 0.15 0.12 -1.31 0.04 0.03 3
Arithmetic mean -2.62 0.02 0.03 -1.34 0.02 0.04 Nc= 5
An and Huang (2014) (compilation)
-2.61 0.05
IAPSO Atlantic seawater (OSIL)
Bristol/UCLf -0.82 0.01 0.06 -0.43 0.01 0.04 26
CGS -0.87 0.03 0.10 -0.45 0.02 0.06 14
GSI -0.84 0.03 0.09 -0.44 0.02 0.05 12
GFZ A -0.81 0.03 0.12 -0.41 0.02 0.06 13
GFZ Bg,h -0.85 0.06 0.07 -0.43 0.05 0.07 4
GEOMAR -0.81 0.05 0.04 -0.40 0.05 0.04 3
Arithmetic mean -0.83 0.02 0.05 -0.43 0.02 0.04 Nc= 6
Linget al.(2011) (compilation) -0.83 0.09 -0.43 0.06 90
Surface water RMs DSW-1 (Dead Sea brine)
CGS -0.68 0.09 0.17 -0.34 0.05 0.10 6
GSI A -0.67 0.02 0.11 -0.35 0.01 0.05 35
GSI Bg,i -0.51 0.03 0.07 -0.28 0.01 0.03 8
GFZ A -0.59 0.31 0.07 -0.30 0.17 0.04 2
GFZ Bg -0.57 0.05 0.10 -0.30 0.03 0.06 7
GFZ Cg -0.53 0.05 0.12 -0.26 0.03 0.07 7
GFZ Dg -0.54 0.06 0.08 -0.26 0.05 0.06 4
Karasinskiet al.(2017)i -0.57 0.06 0.18 10
Arithmetic mean -0.58 0.05 0.12 -0.30 0.03 0.07 Nc= 8
SLRS-5 (river water)
Bristol/UCL -1.14 0.05 0.06 -0.59 0.04 0.05 4
CGS -1.11 0.10 0.20 -0.60 0.06 0.12 6
GFZ Ag -1.30 0.43 0.10 -0.72 0.31 0.07 2
GFZ Bg -1.31 0.05 0.09 -0.67 0.02 0.04 6
GFZ Cg -1.25 0.03 0.06 -0.65 0.02 0.05 6
GFZ Dg -1.24 0.05 0.12 -0.64 0.03 0.07 8
GFZ Eg,h -1.28 0.04 0.10 -0.67 0.03 0.07 10
GEOMAR -1.17 0.05 0.04 -0.57 0.03 0.03 3
Arithmetic mean -1.22 0.06 0.15 -0.64 0.04 0.10 Nc= 8
NIST SRM 1640a (spring water)
Bristol/UCL Ag -0.76 0.06 0.05 -0.42 0.06 0.05 3
Bristol/UCL Bg -0.81 0.07 0.05 -0.44 0.05 0.04 3
CGS -0.72 0.10 0.16 -0.35 0.04 0.07 5
GFZ Ag -0.75 0.14 0.03 -0.39 0.46 0.10 2
GFZ Bg -0.73 -0.37 1
GFZ Cg -0.72 0.07 0.06 -0.39 0.07 0.05 3
GFZ Dg -0.68 0.02 0.07 -0.35 0.01 0.03 13
GFZ Eg,h -0.73 0.05 0.03 -0.39 0.06 0.03 6
GEOMAR -0.68 0.07 0.06 -0.31 0.04 0.03 3
Arithmetic mean -0.73 0.03 0.08 -0.38 0.03 0.08 Nc= 9
Organic-rich solids NIST SRM 2709a (soil)
Bristol/UCL -0.20 0.02 0.02 -0.11 0.04 0.03 3
CGS -0.11 0.07 0.17 -0.07 0.04 0.08 8
GFZ A (MW)g -0.14 0.02 0.09 -0.07 0.01 0.05 19
GFZ Bg -0.17 0.04 0.10 -0.09 0.02 0.05 8
(d26Mg= -0.67 ±0.11‰, d25Mg= -0.35±0.05‰, 2s, n=35, Table 3). Accordingly, our long-term estimate of the typical intermediate precision is ±0.11‰ (2s) on d26Mg, and ±0.05‰ (2s) on d25Mg. The results on reference materials agree with data obtained in other laboratories, indicating no bias outside the stated precision.
Sample preparation and Mg isotope ratio measure-ments at GFZ: Solid powders (30–100 mg) were digested in HF/HNO3mixture at 110°C, followed by 6 mol l-1HCl, and 14 mol l-1 HNO
3. For all samples, H2O2/HNO3 treatment in closed PFA vials on a hot plate at 150 °C for 24 h was used to remove organics. In addition, a separate
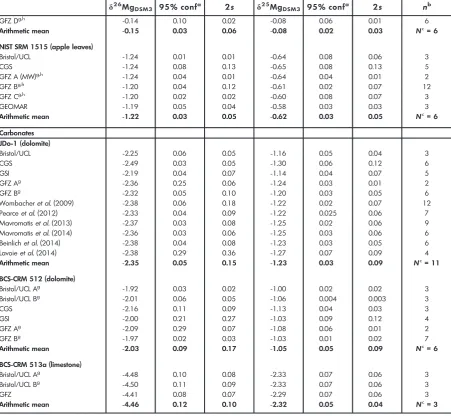
Table 3 (continued).
d26Mg and d25Mg values of the low-temperature RMs determined in the current and previous studies
d2 6MgD SM3 95% confa 2s d25MgDSM3 95% confa 2s nb
GFZ Dg,h -0.14 0.10 0.02 -0.08 0.06 0.01 6
Arithmetic mean -0.15 0.03 0.06 -0.08 0.02 0.03 Nc= 6
NIST SRM 1515 (apple leaves)
Bristol/UCL -1.24 0.01 0.01 -0.64 0.08 0.06 3
CGS -1.24 0.08 0.13 -0.65 0.08 0.13 5
GFZ A (MW)g,h -1.24 0.04 0.01 -0.64 0.04 0.01 2
GFZ Bg,h -1.20 0.04 0.12 -0.61 0.02 0.07 12
GFZ Cg,h -1.20 0.02 0.02 -0.60 0.08 0.07 3
GEOMAR -1.19 0.05 0.04 -0.58 0.03 0.03 3
Arithmetic mean -1.22 0.03 0.05 -0.62 0.03 0.05 Nc= 6
Carbonates JDo-1 (dolomite)
Bristol/UCL -2.25 0.06 0.05 -1.16 0.05 0.04 3
CGS -2.49 0.03 0.05 -1.30 0.06 0.12 6
GSI -2.19 0.04 0.07 -1.14 0.04 0.07 5
GFZ Ag -2.36 0.25 0.06 -1.24 0.03 0.01 2
GFZ Bg -2.32 0.05 0.10 -1.20 0.03 0.05 6
Wombacheret al.(2009) -2.38 0.06 0.18 -1.22 0.02 0.07 12
Pearceet al.(2012) -2.33 0.04 0.09 -1.22 0.025 0.06 7
Mavromatiset al.(2013) -2.37 0.03 0.08 -1.25 0.02 0.06 9
Mavromatiset al.(2014) -2.36 0.03 0.06 -1.25 0.03 0.06 6
Beinlichet al.(2014) -2.38 0.04 0.08 -1.23 0.03 0.05 6
Lavoieet al.(2014) -2.38 0.29 0.36 -1.27 0.07 0.09 4
Arithmetic mean -2.35 0.05 0.15 -1.23 0.03 0.09 Nc= 11
BCS-CRM 512 (dolomite)
Bristol/UCL Ag -1.92 0.03 0.02 -1.00 0.02 0.02 3
Bristol/UCL Bg -2.01 0.06 0.05 -1.06 0.004 0.003 3
CGS -2.16 0.11 0.09 -1.13 0.04 0.03 3
GSI -2.00 0.21 0.27 -1.03 0.09 0.12 4
GFZ Ag -2.09 0.29 0.07 -1.08 0.06 0.01 2
GFZ Bg -1.97 0.02 0.03 -1.03 0.01 0.02 7
Arithmetic mean -2.03 0.09 0.17 -1.05 0.05 0.09 Nc= 6
BCS-CRM 513a (limestone)
Bristol/UCL Ag -4.48 0.10 0.08 -2.33 0.07 0.06 3
Bristol/UCL Bg -4.50 0.11 0.09 -2.33 0.07 0.06 3
GFZ -4.41 0.08 0.07 -2.29 0.07 0.06 3
Arithmetic mean -4.46 0.12 0.10 -2.32 0.05 0.04 Nc= 3
a95% confidence intervals calculated as 2SEt(95 % conf)=ts/√n, withs=standard deviation ofn(orN) repeated measurements or replicates,t=correction
factor for lown(orN) from Student’st-distribution at 95% probability.
bnis the number ofdvalues used for the calculation of the result given by each laboratory. As mentioned in Table 2,n=1 refers to one bracket measured at
Bristol/UCL, GSI and GFZ, an average of three brackets measured at CGS or an average of nine brackets measured at GEOMAR.
cNrefers to the number of averagedvalues used for the calculations of the inter-laboratory arithmetic mean.
dFrom Pogge von Strandmannet al.(2011).
eProcessed through columns.
fFrom Fosteret al.(2010).
gA, B, C, D and E are replicates of the full procedure including sample dissolution (solids) or evaporation (liquids), Mg column purification and MC-ICP-MS
measurements. MW indicates solid sample dissolution using a microwave system.
hFrom Uhliget al.(2017).
[image:9.595.72.524.132.548.2]batch of the organic-rich soil (NIST SRM 2709a) and vegetation (NIST SRM 1515) (ca. 1 g) were also acid-digested (H2O2/HNO3) using a microwave system (MLS Start) at 160°C (for 20 min) and elevated pressure. Both the PFA vial-hot plate and the microwave method achieved complete sample dissolution. Water RMs were evaporated on a hot plate (10 to 20 ml for SLRS-5 and NIST SRM 1640a; 0.1 to 0.5 ml for the others), then treated with HF and H2O2/HNO3and evaporated again to remove Si and dissolved organic carbon, respectively. All samples were finally redissolved in 1 mol l-1HNO
3, and aliquots contain-ing between 2.5 and 15lg Mg were taken for Mg purification.
Procedures for Mg purification and isotope ratio mea-surements are similar to those described previously (Uhlig et al. 2017). A brief description of the method applied during this study is given below. Magnesium purification was performed using chromatography columns (Spectrum PP 104704, ID 8 mm) filled with 2.8 ml Bio-Rad AGâ 50W-X12 resin. After matrix elution with 32 ml 1 mol l-1HNO
3, Mg was quantitatively eluted with 10 ml 2 mol l-1HNO
3. The Mg fraction was treated again with H2O2/HNO3, evaporated and redissolved in 0.3 mol l-1 HNO3. Each material was processed twice through the column proce-dure. Each column batch was accompanied by at least one commonly used reference material (IAPSO Atlantic seawater, basalts BCR-2, BHVO-2 or granite GS-N) and a blank. Total procedural blanks of the column chemistry and the H2O2/ HNO3treatment contained<12 ng Mg, which is<0.5% Mg compared with the amount of Mg processed through column chemistry and is therefore considered insignificant (potential bias in d26Mg is estimated <0.03‰). Magne-sium recovery (quantitative column yield), purity of the Mg solutions (>90% Mg was found to produce no bias using our measurement instrumental set-up; see Pokharel et al. 2017) and the Mg content in total procedural blanks were checked by OES (Varian 720ES) and quadrupole ICP-MS (Thermo Scientific iCAP-Qc), respectively.
Magnesium isotope ratio measurements were con-ducted using a Thermo Scientific Neptune MC-ICP-MS equipped with a Neptune Plus Jet Interface (using a Pfeiffer OnToolBooster interface pump; standard sample cone and X skimmer cone). The 500 ng ml-1 Mg solutions were introduced into the mass spectrometer via a quartz-glass spray chamber (double pass cyclone-Scott type, Thermo SIS) equipped with a self-aspirating PFA nebuliser with an uptake rate ofca.100ll min-1. The ion beam intensities atm/z24, 25 and 26 were measured simultaneously in medium mass resolution mode (see footnote Table 2) on Faraday detectors (L2, C, H2, all 1011Ωamplifiers). The H2 cup was slightly
moved towards higher masses so that26Mg+was measured on the interference-free low mass side of the flat-top peak (to avoid potential interference from 12C14N+). 27Al+ and 23Na+were simultaneously monitored on Faraday detectors
H4 and L4, respectively. Each measurement run comprises twenty cycles, with an integration time of 4.2 s for each cycle. These conditions gave sample signal intensities >10 V for 24Mg. Background intensities (typically<8 mV24Mg) were measured on-peak in 0.3 mol l-1HNO
3before and after each calibrator-sample bracketing block and were sub-tracted from the sample and the calibrator signal intensities. Measurement results were accepted only if the instrumental mass bias was stable, that is linear drift<0.2‰, which is the deviation in 26Mg/24Mg between two bracketing DSM3 calibrators.
The intermediate precision of this measurement proce-dure (including dissolution, Mg column separation, dilution and MC-ICP-MS analyses) was evaluated by repeat anal-yses of reference materials (silicate rocks, IAPSO Atlantic seawater) over the course of about 3 years (e.g., Pokharel et al. 2017, Uhlig et al.2017). For example, for BHVO-2 basalt we obtained a meand26Mg of-0.24±0.10‰and a mean d25Mg of -0.13 ±0.06‰ (2s, n=24 measure-ments on N=6 full dissolution and column chemistry replicates), which is identical within stated precisions to results produced independently in other laboratories (d26Mg= -0.24 ±0.08‰, d25Mg= -0.12± 0.05‰, Teng 2017 and references therein). Measurements of the pure Mg solution Cambridge-1 (without processing through columns) gave a mean of -2.61± 0.07‰ford26Mg and
-1.35±0.05‰ford25Mg (2s,n=62) and IAPSO Atlantic seawater results were -0.81 ±0.12‰ for d26Mg and
-0.41±0.06‰ ford25Mg (2s, n=13). Hence, our long-term estimate of the typical inlong-termediate precision (based on repeated analyses on different materials overca.3 years) is
±0.10‰ (2s) for d25Mg and ±0.06‰ (2s) for d26Mg, respectively. The results on reference materials agree with data obtained in other laboratories, indicating no bias outside the stated precision.
Sample preparation and Mg isotope ratio
measure-ments at CGS and GEOMAR: Sample preparation for the
HNO3. Solutions with visible solid residues were once again redissolved in concentrated 1:1 HNO3:H2O2. All sample solutions were then evaporated to dryness and redissolved in 3% v/v HNO3. Prior to loading samples onto micro-columns, at least 20lg Mg aliquots were taken, evapo-rated to dryness and redissolved in 100ll of 2.5 mol l-1
HCl.
Purification of Mg was accomplished by a three-step chromatographic separation, using 1.25 ml resin (Bio-Rad AGâ 50W-X12, 200–400 mesh) in Savillex PFA 3.2 mm920 cm (inner diameter 9length) microcolumns, for the first and third steps, and 0.12 ml resin in 2.4 mm915 cm microcolumns for the second step. In the first step, the Mg fraction, which still contains Na and Fe, was separated from other matrix elements by elution with 4.90 ml 2.5 mol l-1HCl and collected subsequently. In the second step, the Mg fraction (with Fe) was separated from Na by elution with 4.96 ml 0.4 mol l-1 HCl and subse-quently collected with 1.5 ml 6 mol l-1HCl. In the third step, the Mg fraction was separated from Fe by rinsing with 5.2 ml 2 mol l-1HNO
3prior to the elution of the purified Mg solution with 5.5 ml 2 mol l-1HNO
3. The purified Mg fractions were then evaporated to dryness, redissolved in 200ll concentrated 1:1 HF:HNO3, evaporated to dryness, redissolved in 200ll concentrated 1:1 H2O2:HNO3, evaporated to dryness again and finally dissolved in ca. 3%v/vHNO3for Mg isotope amount ratios analyses. Total procedural blank was <2 ng Mg. Mg yields of close to 100% and molar ratios of∑c(matrix cations)/c(Mg) in the final Mg fractions of <5% were verified by a Thermo Scientific iCAP-Q MS, as well as a Varian 720 series ICP-OES for each sample.
- Mg isotope ratio measurements at CGS.
Magne-sium isotope ratio measurements were conducted using a Thermo Scientific Neptune MC-ICP-MS, equipped with Ni sampler and X-Version Ni skimmer cones. The 500 ng ml-1 Mg solutions were introduced into the plasma via a 100ll min-1PFA nebuliser and a cyclonic quartz-glass spray chamber. All measurements were carried out with the guard electrode turned on and in medium mass resolution mode (see footnote Table 2). The following cup configuration was used: the ion beam intensities at m/z 24, 25 and 26 were measured simultaneously using Faraday cups L1, C and H2, respectively. Measurements were carried out on the low mass side of the peak to avoid 12C14N+ interference signals on m/z 26. Each individual measurement comprised thirty cycles with 8.4 s acquisition time per cycle. Each single delta value (equivalent ton=1, as reported in Table 3) was calculated by at least three
repeated measurements of the same sample solution, each bracketed by DSM3. Thus, each single delta value reported in Table 3 (n=1) represents an average of three measurements of a sample and four measure-ments of DSM3. Typical signals onm/z24 were about 4 to 8 V (i.e., ion beam of 24Mg+). Procedural blank contributions, including background, were consistently below 0.1% of sample signals. Due to these very low blank contributions to the analyte signals, no on-peak blank corrections were applied. Only an electronic background was collected at half mass unit before each block and subtracted from the measured signals.
Isotope fractionation during column chemistry was not detected with d26Mg values of -0.01 ±0.05‰ (2s, n=3, based on a comparison of column processed and unprocessed DSM3), which further substantiates high Mg yields after column chemistry of close to 100%. Measurements of the pure Mg solution Cambridge-1 (without processing through columns) gave a mean of
-2.59±0.16‰ for d26Mg and -1.34 ±0.11‰ for
d25Mg (2s, n=18). The intermediate precision of the sample preparation procedure and MC-ICP-MS mea-surement was estimated based on repeat column purifications and measurements of IAPSO Atlantic sea-water and was -0.87± 0.10‰ for d26Mg and
-0.45±0.06‰ for d25Mg (2s, n=14) during the period between the years 2012 and 2016. Hence, based on these long-term observations we estimate our typical intermediate precision at ±0.13‰ for d26Mg and ±0.09‰ ford25Mg (2s). The results on reference
materials agree with data obtained in other laborato-ries, indicating no bias outside the stated precision.
- Mg isotope ratio measurements at GEOMAR. The
unknown sample. A single run started with a 15 s on-peak-zero baseline measurement, while clean 5% v/v HNO3 was introduced, followed by 5092 s data collection (on either reference material or unknown). Finally, sample washout was performed introducing clean 5% v/v HNO3 for 60 s. Within each run, the collected fifty individual ratios of 25Mg/24Mg and 26Mg/24Mg, respectively, were calculated based on
the on-peak baseline-corrected m/z 24, 25 and 26 signal intensities. Results were calculated using the mean of the individual ratios after removing statistical outliers (1s). Each run of the unknown was used to calculate the
d-value relative to the preceding and following runs of DSM3. The resulting nined-values were combined to an average for the measurement. Each measurement consumed about 200 ng of total Mg.
The repeatability precision is estimated by repeated measurements of Cambridge-1 during this study (without processing through columns), which gave
-2.58 ±0.08‰ for d26Mg and -1.33 ±0.06‰ for
d25Mg (2s, n=11). Measurements of Cambridge-1 processed through columns gave -2.63±0.12‰ for
d26Mg and -1.31 ±0.03‰ for d25Mg (2s, n=3; Table 3). The results agree with data obtained in other laboratories, indicating no bias outside the stated precision. Because no long-term data on repeated measurements on materials with different matrices are available to estimate the typical intermediate precision of the GEOMAR laboratory, as was done for the other laboratories, the typical precision was estimated by the long-term repeatability of the MC-ICP-MS to be
±0.08‰(2s) for d26Mg and ±0.06‰(2s) ford25Mg, based on the unprocessed Cambridge-1 results.
Results and discussion
Individual results validation of the participating laboratories
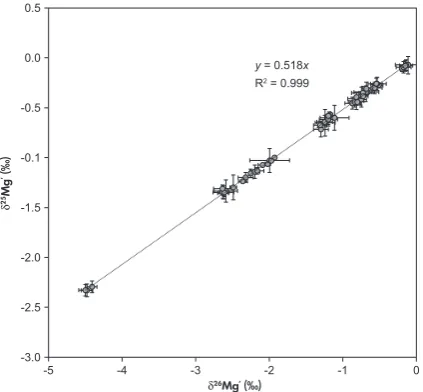
All the d26Mg’ versus d25Mg’ results determined in different laboratories during this study plot on a single line with a slope of 0.518 ±0.004 (Figure 1; linear fit was obtained using the Isoplot software), suggesting no major influence of isobaric interferences on the measured Mg isotope ratios. In addition, thed26Mg andd25Mg values of Cambridge-1 and seawater, on which large data sets are available in the literature (e.g., compilations in Foster et al. 2010, Pogge von Strandmannet al.2011, Linget al.2011, An and Huang 2014, Teng 2017, and references therein and in the GeoReM database, Jochumet al.2005), were used to validate the individual measurement procedures
and measurement results performed by each laboratory. First, to validate each mass spectrometric measurement procedure, the pure Mg solution Cambridge-1 was anal-ysed without processing through Mg column chemistry. Second, to include the various sample preparation methods for Mg purification in the interlaboratory comparison, IAPSO Atlantic seawater, which contains a complex element matrix (∑c(matrix cations)/c(Mg) =9.2; Table 1), was processed and analysed repeatedly in each laboratory. For both RMs, the d25Mg and d26Mg values agree well between all laboratories. The absolute differences (bias) between the values measured in this study and published consensus values are less than 0.04‰ and 0.03‰ for d26Mg and
d25Mg, respectively (Table 3, Figure 2), which are well within the precisions reported by each laboratory. These observations indicate that the various measurement proce-dures (including sample preparation and MC-ICP-MS measurements) do not induce any significant bias outside the reported measurement precision. However, due to the fact that all measurements in this and previous studies were conducted by MC-ICP-MS instruments, an independent validation using a different method cannot be made to exclude any potential systematic MC-ICP-MS bias. However, to date no other technique is able to measured26Mg and
d25Mg at the level of precision obtainable by MC-ICP-MS.
The MC-ICP-MS repeatability precision for Cambridge-1 determined by each laboratory ranges from 0.07 to 0.16‰ (2s) ford26Mg and 0.03 to 0.11‰(2s) ford25Mg (Table 3). The intermediate precision of the entire measurement procedure based on multiple IAPSO Atlantic seawater sample preparations and MC-ICP-MS analyses ranges from 0.04 to 0.12‰ (2s) for d26Mg and 0.04 to 0.09‰ (2s)
for d25Mg (Table 3). Because the 2s of IAPSO Atlantic seawater results is not systematically larger than the precision (2s) of Cambridge-1 results, we conclude that the different sample preparation methods do not introduce any addi-tional significant sources of uncertainty that are not already included in the intermediate measurement precision (2s) reported for each RM result by the different laboratories.
and their variance (reported both as 2s and 95% confidence interval in Tables 3 and 4) include random errors that stem from all influencing factors (sample prepa-ration, matrix sepaprepa-ration, instrumental conditions, etc.). Hence, following a ‘top-down’ approach of uncertainty evaluation (e.g., Potts 2012a, b), we report consensus mean values for each Earth-surface RM characterised in this study together with an uncertainty statement (95% confidence interval, based on the d25Mg and d26Mg values reported by each laboratory, as discussed in the next section.
Assigning consensusd26Mg andd25Mg values to the reference materials
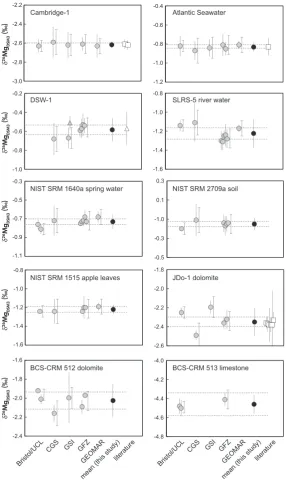
The results of the eight RMs, from the laboratories participating in this study, as well as the available literature data, are shown in Table 3 and Figure 2. The range of
d26Mg values of the studied RMs covers almost the entire range of terrestrial materials (e.g., Teng 2017). As expected, the lowest d26Mg values were found in carbonates: limestone BCS-CRM 513a (-4.46±0.12‰, 95% conf., n=3), which represents the lower part of the globald26Mg range of limestones, and dolomites JDo-1 and BCS-CRM 512 (-2.35 ±0.05‰, 95% conf., n=11 and -2.03 ±
0.09‰, 95% conf.,n=6, respectively), which are within the typical range for dolomites (Teng 2017 and references therein). The most positived26Mg value was found in the soil NIST SRM 2709a (-0.15±0.03‰, 95% conf., n=6), typical for silicate soils (Teng 2017 and references therein).
NIST SRM 1515 (apple leaves) has d26Mg value of
-1.22±0.03‰(95% conf.,n=6), consistent with previous findings. d26Mg values in plants depend on the sources of Mg and on complex isotope fractionation processes during the uptake of Mg and transport within the plant (e.g., Black et al.2008, Bolou-Biet al.2010, 2012, Tipperet al.2010). In general, Mg in rivers and groundwater yield a large range of d26Mg values with a flux-weighted d26Mg of global run-off of-1.09‰(Tipperet al.2006b). SLRS-5 river water (-1.22±0.06‰, 95% conf.,n=8) has lowerd26Mg value, and spring water NIST SRM 1640a (-0.73± 0.03‰, 95% conf., n=9) has higherd26Mg value, relative to this average. The higher d26Mg value of the Dead Sea brine (DSW-1; -0.58 ±0.05‰, 95% conf.,n=8) relative to its precursor seawater may represent a contribution of 24 Mg-depleted dolomitising brines (Gavrieli et al. 2009, Shalev et al.2014).
To obtain meand26Mg andd25Mg values for the RMs, we evaluate the interlaboratory reproducibility (indicated as 2s on the consensus value derived from the results of all laboratories and literature data; Table 3). All eight RMs have an interlaboratory reproducibility (2s) of 0.05 to 0.17‰in
d26Mg. For most RMs (DSW-1, NIST SRM 1640a, NIST SRM 2709a, NIST SRM 1515 and BCS-CRM 513), the interlab-oratory reproducibility (0.05–0.12‰) is within or below the range of the‘typical’intermediate precision of the laborato-ries estimated from repeat analysis of different materials over the long term (0.06–0.13‰ ind26Mg), indicating that the measurement procedures used in all laboratories do not induce any additional uncertainty contributions when sam-ples with such matrices are processed and measured. For these RMs, the individual results from all laboratories also agree within the reported measurement precision of each sample (Table 3 and Figure 2). However, the interlaboratory reproducibilities of three RMs, river water SLRS-5, dolomites JDo-1 and BCS-CRM 512 (2s of 0.15‰, 0.15‰ and 0.17‰, respectively), are slightly higher than the ‘typical’ intermediate precisions reported by the participating labo-ratories. While all the individual SLRS-5 results agree within 2s measurement precision of the repeat measurements of each RM, this is not the case for all individual results of JDo-1 and BCS-CRM 512 (Figure 2). Averaged data of JDo-1 reported in the literature seem to be more uniform, but in some cases, the reported 2sis larger, covering the whole range obtained in current research (Wombacher et al.2009, Pearceet al. 2012, Mavromatiset al.2013, 2014, Beinlichet al.2014, Lavoie et al. 2014, Figure 2). Similar to the results of this study, Wombacher et al. (2009) reported a precision of 0.18‰(2s) on the mean of twelve measurement results of JDo-1 from four different Mg separations (test portions of 2.5– 40 mg). Note that most of these values (Pearceet al.2012, 0.5
0.0
-0.5
-0.1
-1.5
-2.0
-2.5
-3.0
-5 -4 -3 -2 -1 0
δ
25Mg ’ (‰)
δ26Mg’ (‰)
R2 = 0.999
[image:13.595.76.288.101.297.2]y = 0.518x
Mavromatis et al.2013, 2014, Beinlichet al.2014) were obtained using a similar chemical sample preparation procedure.
The reasons for the slightly higher interlaboratory variance in the dolomite RMs are unknown. Interlaboratory variance can arise from many factors, including material -2.2
-2.4
-2.6
-2.8
-3.0
Cambridge-1
δ
26Mg
DSM3
(‰)
-0.4
-0.6
-0.8
-1.0
-1.2
Atlantic Seawater
DSW-1
-0.4
-0.6
-0.8
-1.0 -0.2
δ
26Mg
DSM3
(‰)
SLRS-5 river water
NIST SRM 1640a spring water NIST SRM 2709a soil
NIST SRM 1515 apple leaves JDo-1 dolomite
δ
26Mg
DSM3
(‰)
δ
26Mg
DSM3
(‰)
δ
26Mg
DSM3
(‰)
BCS-CRM 512 dolomite BCS-CRM 513 limestone
-0.5
-0.7
-0.9
-1.1 -0.3
-0.8
-1.0
-1.2
-1.4
-1.6
-0.8
-1.0
-1.2
-1.4
-1.6
-1.6
-1.8
-2.0
-2.2
-2.4
-1.0
-0.5 -0.3 0.3
0.1
-1.8
-2.0
-2.2
-2.4
-2.6
-4.0
-4.2
-4.4
-4.6
-4.8
Bristol/UCL
CGS GSI GFZ
GEOMAR
mean (this study) literature
Bristol/UCL
CGS GSI GFZ
GEOMAR
[image:14.595.157.444.100.582.2]mean (this study) literature
properties (e.g., homogeneity at the level of the test portion, or stability over time), sample preparation procedure (e.g., incomplete dissolution, column yield, analyte purity and blank) and the procedures used in the mass spectrometric measurements and data reduction (e.g., mass bias stability and mass bias correction, matrix effects). No correlation was found between molar matrix elements/Mg ratios and the interlaboratory variance (examples in Figure 3). Moreover,
we checked for any correlations between individuald26Mg values and test portions, blank/Mg, column capacity, but did not find any systematic relations. Thus, further investigation on these RMs is required to determine the sources of the observed variance.
[image:15.595.71.524.145.249.2]The consensusd26Mg andd25Mg mean values for the studied RMs are provided in Table 4 together with an
Table 4.
Interlaboratory consensus d26Mg and d25Mg values from this study and literature, if available, of
low-temperature, Earth-surface reference materials
d2 6MgDS M3 95% confa d2 5MgDS M3 95% confa Nb
DSW-1 (Dead Sea brine) -0.58 0.05 -0.30 0.03 8
SLRS-5 (river water) -1.22 0.06 -0.64 0.04 8
NIST SRM 1640a (spring water) -0.73 0.03 -0.38 0.03 9
NIST SRM 2709a (soil) -0.15 0.03 -0.08 0.02 6
NIST SRM 1515 (apple leaves) -1.22 0.03 -0.62 0.03 6
JDo-1 (dolomite) -2.35 0.05 -1.23 0.03 11
BCS-CRM 512 (dolomite) -2.03 0.09 -1.05 0.05 6
BCS-CRM 513a (limestone) -4.46 0.12 -2.32 0.05 3
a95% confidence intervals calculated as 2SE
t(95% conf)=ts/√N, withs=standard deviation ofNfull-procedure replicates,t=correction factor for lowN
from Student’st-distribution at 95% probability.
bNis the number of results used for the calculation of the consensus values and the 95% confidence interval. These are detailed in Table 3.
0.18
Interlaboratory variance (2
s
)
0.14
0.10
0.02 0.06
JDo-1
R2 = 0.00
CAM-1 SLRS-5
DSW-1
NIST SRM 1515
Seawater
Interlaboratory variance (2
s
)
Interlaboratory variance (2
s
)
0.18
0.14
0.10
0.02 0.06
0 5 10 15 20 25 30
0.18
0.14
0.10
0.02 0.06
0.18
0.14
0.10
0.02 0.06
Interlaboratory variance (2
s
)
0 5 10 15 20
0 1 2 3 4 5
Ca/Mg (molar ratio)
Mn/Mg (molar ratio)
0.00 0.01 0.02 0.03 0.04
Si/Mg (molar ratio)
Σ matrix cations/Mg (molar ratio)
R2 = 0.14 R2 = 0.19
R2 = 0.00
JDo-1 BCS-CRM 512
BCS-CRM 513
NIST SRM 1515 Seawater
NIST SRM 2709a
JDo-1
DSW-1
CAM-1 Seawater
NIST SRM 1640a
JDo-1
DSW-1 SLRS-5
Seawater
NIST SRM 2709a
NIST SRM 1640a
BCS-CRM 513 BCS-CRM 513 (221)
NIST SRM 1640a BCS-CRM 512
SLRS-5 BCS-CRM 512
BCS-CRM 513 (220)
NIST SRM 2709a
NIST SRM 1515
NIST SRM 1640a
BCS-CRM 512
NIST SRM 1515 NIST SRM 2709a
SLRS-5
[image:15.595.75.523.428.711.2]associated uncertainty for each value. This uncertainty was estimated by the 95% confidence interval on the mean ofN laboratory results, including literature data, if available.
Summary and conclusions
In this study, the d26Mg and d25Mg values of eight Earth-surface reference materials (RMs), representative of different low-temperature environments and material types were determined by interlaboratory comparison. Despite the differences in sample preparation procedures, different test portions, instrumentation and isotope ratio measurement procedures, good agreement of the d26Mg and d25Mg data from the different laboratories was found. This encour-aging result suggests that all methods described in this study are suitable for geochemical studies on these types of materials given they are strictly monitored and calibrated (recovery, blanks, matrix removal, etc.). Moreover, the inves-tigated RMs are suitable to be used by other laboratories for routine quality control of Mg isotope ratio measurement procedures during environmental and Earth-surface geo-chemical studies. The wide range of matrices, including river water, spring water, brine, dolomites, limestone, soil and plant leaves, allow analysts to identify potential issues (and facilitate modifications) with sample preparation methods previously developed for silicate rocks, for example, which are then applied to different sample types, such as Ca-rich carbonates, organic-rich soils or vegetation.
Acknowledgements
PPvS acknowledges ERC Consolidator Grant 682760– CONTROLPASTCO2. J. Bartel and J. Buhk are acknowl-edged for laboratory support at GFZ. F. von Blanckenburg and the Helmholtz Association are thanked for infrastructure support at GFZ. The analytical work done at CGS, GEOMAR and CULS was supported via the European Union’s Horizon 2020 research and innovation programme, under Grant Agreement No. 643084 (Base-LiNE Earthproject), and the Czech Science Foundation (GACR) Grant nos. 17-18120S and P210/12/P631. Technical and laboratory assistance of T. Magna, M. Francova, M.Simecek and J. Mıkova at CGS is acknowledged. The research done at the University of Adelaide was supported viaBase-LiNE Earth, and the ARC Linkage project LP160101353 to JF. NS acknowledges L. Halicz, I. Gavrieli, B. Lazar and D. Vance for their advices and support and N. Teplyakov, Y. Zakun and K. Weiss for laboratory support at GSI. The work at GSI was funded by the DFG-trilateral project TRION (Ei272/30-1), the Israeli Ministry of Science, Technology and Space (Eshkol scholar-ship), the Israeli Ministry of National Infrastructures, Energy and Water resources and Dalia and Dan Maydan
Fellowship. The research done at ETH Z€urich was funded by an ETH postdoctoral fellowship (FEL-14 16-1). The authors would also like to thank the editor, T. Meisel and two anonymous reviewers whose comments helped to signifi-cantly improve this manuscript.
References
An Y. and Huang F. (2014)
A review of Mg isotope analytical methods by MC-ICP-MS.
Journal of Earth Science,25, 822–840.
Beinlich A., Mavromatis V., Austrheim H. and Oelkers E.H. (2014)
Inter-mineral Mg isotope fractionation during hydrothermal ultramafic rock alteration–Implications for the global Mg-cycle.Earth and Planetary Science Letters,392, 166–176.
Black J.R., Epstein E., Rains W.D., Yin Q.Z. and Casey W.H. (2008)
Magnesium-isotope fractionation during plant growth.
Environmental Science and Technology,42, 7831–7836.
Bolou-Bi E.B., Vigier N., Brenot A. and Poszwa A. (2009)
Magnesium isotope compositions of natural reference materials.Geostandards and Geoanalytical Research,
33, 95–109.
Bolou-Bi E.B., Poszwa A., Leyval C. and Vigier N. (2010)
Experimental determination of magnesium isotope frac-tionation during higher plant growth.Geochimica et Cosmochimica Acta,74, 2523–2537.
Bolou-Bi E.B., Vigier N., Poszwa A., Boudot J.P. and Dambrine E. (2012)
Effects of biogeochemical processes on magnesium iso-tope variations in a forested catchment in the Vosges Mountains (France).Geochimica et Cosmochimica Acta,
87, 341–355.
Brand W.A., Coplen T.B., Vogl J., Rosner M. and Prohaska T. (2014)
Assessment of international reference materials for isotope-ratio analysis (IUPAC Technical Report).Pure and Applied Chemistry,86, 425–467.
Brenot A., Cloquet C., Vigier N., Carignan J. and France-Lanord C. (2008)
Magnesium isotope systematics of the lithologically varied Moselle river basin, France.Geochimica et Cosmochimica Acta,72, 5070–5089.
Chapela Lara M., Buss H.L., Pogge von Strandmann P.A.E., Schuessler J.A. and Moore O.W. (2017)
r e f e r e n c e s
Coplen T.B. (2011)
Guidelines and recommended terms for expression of stable-isotope-ratio and gas-ratio measurement results.
Rapid Communications in Mass Spectrometry,25, 2538– 2560.
Foster G.L., Pogge von Strandmann P.A.E. and Rae J.W.B. (2010)
Boron and magnesium isotopic composition of seawater.
Geochemistry Geophysics Geosystems,11, 1–10.
Galy A., Belshaw N.S., Halicz L. and O’Nions R.K. (2001)
High-precision measurement of magnesium isotopes by multiple-collector inductively coupled plasma mass spec-trometry.International Journal of Mass Spectrometry,208, 89–98.
Galy A., Bar-Matthews M., Halicz L. and O’Nions R.K. (2002)
Mg isotopic composition of carbonate: Insight from spe-leothem formation.Earth and Planetary Science Letters,201, 105–115.
Galy A., Yoffe O., Janney P.E., Williams R.W., Cloquet C., Alard O., Halicz L., Wadhwa M., Hutcheon I.D., Ramon E. and Carignan J. (2003)
Magnesium isotope heterogeneity of the isotopic standard SRM 980 and new reference materials for magnesium-isotope-ratio measurements.Journal of Analytical Atomic Spectrometry,18, 1352–1356.
Gavrieli I., Yoffe O., Burg A. and Halicz L. (2009)
Mg isotope fractionation in the Ca-chloride Dead Sea brine system.Geochimica et Cosmochimica Acta Supple-ment,73, A419.
Geske A., Lokier S., Dietzel M., Richter D.K., Buhl D. and Immenhauser A. (2015)
Magnesium isotope composition of sabkha porewater and related (Sub-)Recent stoichiometric dolomites, Abu Dhabi (UAE).Chemical Geology,393–394, 112–124.
Golan R., Gavrieli I., Ganor J. and Lazar B. (2016)
Controls on the pH of hyper-saline lakes–A lesson from the Dead Sea.Earth and Planetary Science Letters,434, 289– 297.
Higgins J.A. and Schrag D.P. (2015)
The Mg isotopic composition of Cenozoic seawater– evidence for a link between Mg-clays, seawater Mg/Ca, and climate.Earth and Planetary Science Letters,416, 73– 81.
Jochum K.P., Nohl U., Herwig K., Lammel E., Stoll B. and Hofmann A.W. (2005)
GeoReM: A new geochemical database for reference materials and isotopic standards.Geostandards and Geoanalytical Research,29, 333–338.
Karasinski J., Bulska E., Wojciechowski M., Halicz L. and Krata A.A. (2017)
High precision direct analysis of magnesium isotope ratio by ion chromatography/multicollector-ICP-MS using wet and dry plasma conditions.Talanta,165, 64–68.
Kasemann S.A., Pogge von Strandmann P.A.E., Prave A.R., Fallick A.E., Elliott T. and Hoffmann K.H. (2014)
Continental weathering following a Cryogenian glaciation: Evidence from calcium and magnesium isotopes.Earth and Planetary Science Letters,396, 66–77.
Lavoie D., Jackson S. and Girard I. (2014)
Magnesium isotopes in high-temperature saddle dolomite cements in the lower Paleozoic of Canada.Sedimentary Geology,305, 58–68.
Ling M.-X., Sedaghatpour F., Teng F.-Z., Hays P.D., Strauss J. and Sun W. (2011)
Homogeneous magnesium isotopic composition of seawa-ter: An excellent geostandard for Mg isotope analysis.Rapid Communications in Mass Spectrometry,25, 2828–2836.
Liu X.M., Teng F.Z., Rudnick R.L., McDonough W.F. and Cummings M.L. (2014)
Massive magnesium depletion and isotope fractionation in weathered basalts.Geochimica et Cosmochimica Acta,
135, 336–349.
Ma L., Teng F.-Z., Jin L., Ke S., Yang W., Gu H.-O. and Brantley S.L. (2015)
Magnesium isotope fractionation during shale weathering in the Shale Hills Critical Zone Observatory: Accumulation of light Mg isotopes in soils by clay mineral transformation.
Chemical Geology,397, 37–50.
Mavromatis V., Gautier Q., Bosc O. and Schott J. (2013)
Kinetics of Mg partition and Mg stable isotope fractiona-tion during its incorporafractiona-tion in calcite.Geochimica et Cosmochimica Acta,114, 188–203.
Mavromatis V., Meister P. and Oelkers E.H. (2014)
Using stable Mg isotopes to distinguish dolomite formation mechanisms: A case study from the Peru Margin.Chemical Geology,385, 84–91.
Opfergelt S., Georg R.B., Delvaux B., Cabidoche Y.-M., Burton K.W. and Halliday A.N. (2012)
Mechanisms of magnesium isotope fractionation in vol-canic soil weathering sequences, Guadeloupe.Earth and Planetary Science Letters,341–344, 176–185.
Pearce C.R., Saldi G.D., Schott J. and Oelkers E.H. (2012)
Isotopic fractionation during congruent dissolution, precip-itation and at equilibrium: Evidence from Mg isotopes.
Geochimica et Cosmochimica Acta,92, 170–183.
Pogge von Strandmann P.A.E. (2008)
Precise magnesium isotope measurements in core top planktic and benthic foraminifera.Geochemistry, Geo-physics, Geosystems,9, 1–13.
Pogge von Strandmann P.A.E., Burton K.W., James R.H., van Calsteren P., Gislason S.R. and Sigfusson B. (2008)
The influence of weathering processes on riverine mag-nesium isotopes in a basaltic terrain.Earth and Planetary Science Letters,276, 187–197.
Pogge von Strandmann P.A.E., Elliott T., Marschall H.R., Coath C., Lai Y.J., Jeffcoate A.B. and Ionov D.A. (2011)
Variations of Li and Mg isotope ratios in bulk chondrites and mantle xenoliths.Geochimica et Cosmochimica Acta,
r e f e r e n c e s
Pogge von Strandmann P.A.E., Opfergelt S., Lai Y.-J., Sigfusson B., Gislason S.R. and Burton K.W. (2012)
Lithium, magnesium and silicon isotope behaviour accompanying weathering in a basaltic soil and pore water profile in Iceland.Earth and Planetary Science Letters,339–340, 11–23.
Pogge von Strandmann P.A.E., Forshaw J. and Schmidt D.N. (2014)
Modern and Cenozoic records of magnesium behaviour from foraminiferal Mg isotopes.Biogeosciences Discus-sions,11, 7451–7484.
Pokharel R., Gerrits R., Schuessler J.A., Floor G., Gor-bushina A.A. and von Blanckenburg F. (2017)
Mg isotope fractionation during uptake by a rock-inhabiting, model microcolonial fungusKnufia petricolaat acidic and neutral pH.Environmental Science and Tech-nology,51, 9691–9699.
Potts P.J. (2012a)
A proposal for the publication of geochemical data in the scientific literature.Geostandards and Geoanalytical Research,36, 225–230.
Potts P.J. (2012b)
Glossary of analytical and metrological terms from the International Vocabulary of Metrology (2008). Geostan-dards and Geoanalytical Research,36, 231–246.
Shalev N., Lazar B., Halicz L. and Gavrieli I. (2014)
Magnesium isotope fractionation during epigenetic dolomitization of carbonate rocks.Goldschmidt Abstracts,
2014, 2257.
Shalev N., Lazar B., Halicz L. and Gavrieli I. (2017)
Mg isotope fractionation during precipitation of marine Mg-evaporites.Goldschmidt Abstracts,2017, 3606.
Summerhayes C.P and Thorpe S.A. (1996)
Oceanography–An illustrated guide: Chapter 11.CRC Press(Boca Raton, FL), 165–181.
Teng F.-Z. (2017)
Magnesium isotope geochemistry.Reviews in Mineralogy and Geochemistry,82, 219–287.
Teng F.-Z., Yin Q.-Z., Ullmann C.V., Chakrabarti R., Pogge von Strandmann P.A.E., Yang W., Li W.-Y., Ke S., Wimpenny F.S.J., Meixner A., Romer R.L., Wiechert U. and
Jacobsen S.B. (2015)
Interlaboratory comparison of magnesium isotopic com-positions of twelve felsic to ultramafic igneous rock standards analyzed by MC-ICP-MS.Geochemistry Geo-physics Geosystems,16, 3197–3209.
Tipper E.T., Galy A. and Bickle M.J. (2006a)
Riverine evidence for a fractionated reservoir of Ca and Mg on the continents: Implications for the oceanic Ca cycle.
Earth and Planetary Science Letters,247, 267–279.
Tipper E.T., Galy A., Gaillardet J., Bickle M.J., Elderfield H. and Carder E.A. (2006b)
The magnesium isotope budget of the modern ocean: Constraints from riverine magnesium isotope ratios.Earth and Planetary Science Letters,250, 241–253.
Tipper E., Gaillardet J., Louvat P., Capmas F. and White A.F. (2010)
Mg isotope constraints on soil pore-fluid chemistry: Evi-dence from Santa Cruz, California.Geochimica et Cos-mochimica Acta,74, 3883–3896.
Uhlig D., Schuessler J.A., Bouchez J., Dixon J.L. and von Blanckenburg F. (2017)
Quantifying nutrient uptake as driver of rock weathering in forest ecosystems by magnesium stable isotopes. Biogeo-sciences,14, 3111–3128.
Wombacher F., Eisenhauer A., Heuser A. and Weyer S. (2006)
Combined chemical separation of Mg, Ca and Fe from geological reference samples for stable isotope determi-nation by MC-ICP-MS and double-spike TIMS. Geophys-ical Research Abstracts,8, A06219.
Wombacher F., Eisenhauer A., Heuser A. and Weyer S. (2009)
Separation of Mg, Ca and Fe from geological reference materials for stable isotope ratio analyses by MC-ICP-MS and double-spike TIMS.Journal of Analytical Atomic Spectrometry,24, 627.
Wombacher F., Eisenhauer A., B€ohm F., Gussone N., Regenberg M., Dullo W.-C. and R€uggeberg A. (2011)
Magnesium stable isotope fractionation in marine biogenic calcite and aragonite.Geochimica et Cosmochimica Acta,
75, 5797–5818.
Young E.D. and Galy A. (2004)