BIROn - Birkbeck Institutional Research Online
Wilkinson, M. and McCaffrey, K.J.W and Jones, R.P. and Roberts, Gerald
P. and Holdsworth, R. and Gregory, L. and Walters, R. and Wedmore, L.
and Goodall, H. and Iezzi, F. (2017) Near-field fault slip of the 2016 Vettore
Mw 6.6 earthquake (Central Italy) measured using low-cost GNSS. Scientific
Reports 7 , ISSN 2045-2322.
Downloaded from:
Usage Guidelines:
Please refer to usage guidelines at
or alternatively
Near-field fault slip of the 2016
Vettore M
w
6.6 earthquake (Central
Italy) measured using low-cost
GNSS
Maxwell W. Wilkinson
1, Ken J. W. McCaffrey
2, Richard R. Jones
1, Gerald P. Roberts
3, Robert
E. Holdsworth
2, Laura C. Gregory
4, Richard J. Walters
5, Luke Wedmore
4, Huw Goodall
4&
Francesco Iezzi
3The temporal evolution of slip on surface ruptures during an earthquake is important for assessing fault displacement, defining seismic hazard and for predicting ground motion. However, measurements of near-field surface displacement at high temporal resolution are elusive. We present a novel record
of near-field co-seismic displacement, measured with 1-second temporal resolution during the 30th
October 2016 Mw 6.6 Vettore earthquake (Central Italy), using low-cost Global Navigation Satellite System (GNSS) receivers located in the footwall and hangingwall of the Mt. Vettore - Mt. Bove fault system, close to new surface ruptures. We observe a clear temporal and spatial link between our near-field record and InSAR, far-near-field GPS data, regional measurements from the Italian Strong Motion and National Seismic networks, and field measurements of surface ruptures. Comparison of these datasets illustrates that the observed surface ruptures are the propagation of slip from depth on a surface
rupturing (i.e. capable) fault array, as a direct and immediate response to the 30th October earthquake.
Large near-field displacement ceased within 6–8 seconds of the origin time, implying that shaking induced gravitational processes were not the primary driving mechanism. We demonstrate that low-cost GNSS is an accurate monitoring tool when installed as custom-made, short-baseline networks.
Improved measurements of co-seismic fault slip and surface rupture are critical to our understanding of earth-quake processes and the design of major infrastructure1–3. The 30th October M
w 6.64/Mw 6.55 earthquake was the
largest in Italy for 36 years and forms part of a recent sequence of earthquakes in the central Italian Apennines that includes the Mw 6.24/Mw 6.05 Amatrice earthquake6–8 of 24th August 2016 with 299 fatalities, the Mw 5.44
and Mw 6.14/Mw 5.95 earthquakes of 26th October9 and the Mw 5.34, Mw 5.74, Mw 5.64 and Mw 5.24 earthquakes
of 18th January 2017 that caused 34 fatalities. During the 30th October earthquake ground motions up to 547 gal
were recorded at a strong motion station in Accumoli, and shaking of magnitude five on the Mercalli Cancani Sieberg (MCS) scale was felt up to 75 km from the epicentre10. Regional GPS stations10 measured horizontal
co-seismic displacements of 38.3 cm north-east (station VETT, in the footwall) and 26 cm south-west (MSAN, hangingwall). These same stations measured absolute vertical co-seismic displacements of 5.5 cm uplift (VETT, footwall) and 44.6 cm of subsidence (ARQT, hangingwall). The Time Domain Moment Tensor focal mechanism11
was extensional, with a strike of 151° and dip of 47° south-west10. A maximum slip of 2.5 meters at 4–6 km depth
has been inferred10. Least squares inversion of the strong motion-derived source model defined a rise time of
2.1 seconds, rupture velocity of 2.5 km/s and total rupture duration of 8 seconds10. Inversion of accelerometer
data suggest >80 cm of inferred slip at the intersection of the fault and the ground surface, which corresponds well with offsets we measured directly from outcrop in the two days following the earthquake. Surface ruptures within a zone of minimum length of 15 km along the Mt Vettore - Mt. Bove Fault System were mapped remotely by helicopter the day after the earthquake10 and in the field by our group, and have helped to identify a complex
1Geospatial Research Ltd, Department of Earth Sciences, Durham University, Durham, DH1 3LE, UK. 2Department of
Earth Sciences, Durham University, Durham, DH1 3LE, UK. 3Department of Earth and Planetary Sciences, Birkbeck,
University of London, London, WC1E 7HX, UK. 4School of Earth and Environment, University of Leeds, Leeds, LS2
9JT, UK. 5COMET, Department of Earth Sciences, Durham University, Durham, DH1 3LE, UK. Correspondence and
requests for materials should be addressed to M.W.W. (email: maxwell.wilkinson@durham.ac.uk) Received: 1 March 2017
Accepted: 22 May 2017 Published: xx xx xxxx
www.nature.com/scientificreports/
network comprising of three different west-dipping synthetic fault splays and two antithetic structures (Fig. 1). Preliminary InSAR measurements spanning the 26th October and 30th October earthquakes using Sentinel-1 data
of 26 October – 1 November reveal low far-field deformation gradients (1–5 cm/km), with higher gradients up to 30 cm/km observed closer to the Mt Vettore - Mt. Bove Fault System10.
GNSS results from the 30
thOctober earthquake
We recorded positional data using custom-made GNSS units that are designed around a low-cost U-blox NEO-M8T GNSS receiver chip, and built to be compact, robust, weatherproof, and power-efficient. The GNSS chips allow GNSS constellations to be tracked using a single frequency over the L1 band and provide observation data of pseudo-range and carrier phase at rates of up to 10 Hz. These single-frequency observations allow the
c
60 cm
d
b
a
13.1˚ 13.3˚
42.7˚ 42.9˚
10.0˚ 15.0˚
40.0˚ 45.0˚
Arquata del Tronto Norcia
MSAN RIFP
ARQT
VETT
Mt. Veore Mt. Bove
Foce Castelsantangelo
sul Nera
30th October Mw 6.6 earthquake epicenter (Hypocenter depth: 9200 m ±200 m)
IT.CLO Castelluccio
MV04
MV03
MV02 MV01
Settlement Accelerometer
(Italian Strong Motion Network) Low-cost GNSS unit
Regional GPS network Topographic peak Known active faults Mapped surface rupture (30th October earthquake)
500 1000 1500 2000 2500
m
10 km
[image:3.595.155.517.43.500.2]Fig. 1b Fig. 1d
Fig. 1c
42.7˚ 42.9˚
RomeAmatrice
42.86672˚ 13.22705˚ Looking NNE
42.81387˚ 13.25901˚ Looking N
42.85963˚ 13.20580˚ Looking SW
32 cm
2 m
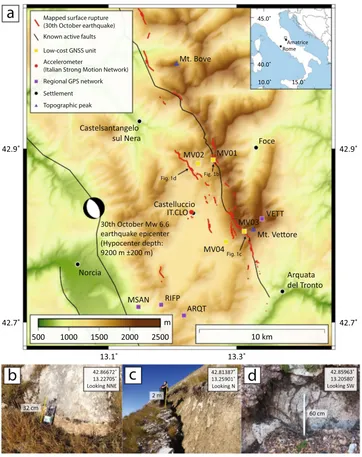
Figure 1. (a) Location map of 6.6 Mw October 30th Vettore earthquake. Red lines are surface ruptures from
this event mapped by the EMERGEO working group using ground observations. MV01, MV02, MV03 and MV04 are GNSS units used in this study. Additional GNSS stations operated by other researchers are: VETT (INGV – IGM network benchmark), ARQT (INGV, RING network), RIFP and MSAN (INGV – CaGeoNet network). IT.CLO is a strong motion station situated near the village of Castelluccio. The location of the earthquake epicentre was retrieved from http://cnt.rm.ingv.it/en/event/88636815. Map coordinates are latitude
and longitude decimal degrees of the geographic co-ordinate system WGS84. Topographic elevation is based on 90 m SRTM data24. Map generated using GMT software v. 4.5.15 (http://www.soest.hawaii.edu/gmt/)25. (b)
position of one receiver relative to another to be continually resolved with centimetre spatial accuracy for base-lines up to approximately 10 km12, 13. The temporal accuracy is sub-microsecond14, as GNSS is fundamentally
dependant on very precise timing. The GNSS units were assembled with the purpose to monitor surface deforma-tion resulting from earthquakes, but the underlying technology could be applied to many potential monitoring applications within the geosciences, such as volcanic deformation, mass wasting processes, glacial motion or anthropogenic ground movements.
Following the 24th August Amatrice earthquake we deployed four GNSS units along the Mt. Vettore fault as
two footwall-hangingwall pairs, to create two baselines with lengths of 1,286 m and 1,870 m (Fig. 1, Table 1). The along-strike separation of these two baselines is 6.2 km. To eliminate the potential for gravitationally-induced effects in the displacement signal, the locations of the GNSS units were chosen on stable bedrock. The two hang-ingwall units, MV02 and MV04, are located on a hill within the basin below MV01, and on the Castelluccio plain, respectively. All units recorded positional data at 1 Hz continually to a data card from the time they were installed; there is no triggering mechanism to capture particular seismic events. We deployed the units with the intent to measure the near-field post-seismic deformation of the Mt. Vettore fault following the Amatrice earthquake; by chance, both our baselines were located on a section of the Mt. Vettore fault which subsequently ruptured during the 30th October earthquake. The duration of the data presented here is 1 minute, starting from 06:40:00 UTC,
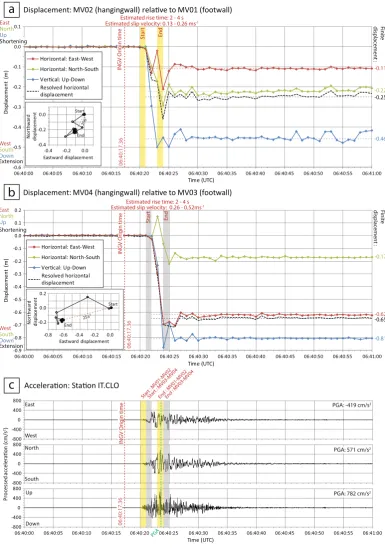
that covers 18 seconds preceding the earthquake and 42 seconds following it (Fig. 2a,b, Supplementary Table S1). The data describe the displacement of the hangingwall GNSS unit relative to the corresponding footwall unit as three components: horizontal east-west, horizontal north-south, and vertical up-down. The resolved horizontal displacement (“horizontal throw”) is derived from the two horizontal components, and corresponds to the incre-mental relative displacement maps shown as insets in Fig. 2a,b.
Data from both GNSS pairs show an absence of pre-seismic deformation, as the hangingwall is stationary relative to the footwall for the time preceding the sudden onset of co-seismic displacement. The initiation of relative displacement occurs between 06:40:20 and 06:40:21 for baseline MV01-MV02 and 06:40:21 and 06:40:22 for baseline MV03-MV04. The data then indicate rapid south-westward and downward displacement of the hang-ingwall relative to the footwall over the following 2–4 seconds. We infer that the data recorded within this period reflect a composite signal of increasing co-seismic displacement together with superimposed high frequency ground motions associated with differential shaking. We estimate rise time (the duration between onset and ces-sation of co-seismic fault displacement) to be ca. 2–4 s for both baselines assuming that co-seismic displacement on the fault surface ended when all three components of displacement reached their finite offset values (Fig. 2). The 1 Hz temporal frequency of the displacement record effectively limits the resoultion of this approximation to integer seconds. Estimated slip velocities are 0.13–0.26 ms−1 and 0.26–0.52 ms−1 for baselines MV01-MV02 and
MV03-MV04 respectively. Following this short period of large, rapid displacement, the data then indicate only very slight relative movement for the remaining 35–37 seconds. We interpret small fluctuations in displacement during this latter period as the remaining effects of differential ground shaking, as they do not produce further finite displacement.
Table 1 summarises our interpreted values of finite displacement during this event from the two hangingwall-footwall pairs. The finite displacement observed at baseline MV03-MV04 close to the along-strike centre of the rupture trace exceeds that observed along baseline MV01-MV02 located towards the north-eastern tip of the rupture trace. Furthermore, a footwall fault splay behind site MV01 ruptured during the October 30th earthquake. This rupture was not visited on foot, but could be seen from across the valley, and it likely accommo-dated a portion of the total slip, which is not represented by the GNSS data on baseline MV01-MV02.
Comparison of GNSS and other datasets
Co-seismic offsets derived from the regional GPS network9 (Fig. 1a) show far-field horizontal displacements
across the Mt. Vettore fault of 0.53 m (VETT-RIFP) and 0.63 m (VETT-MSAN), in close agreement with the displacement of 0.65 m observed from our near-field GNSS at a similar along strike position on baseline MV03-MV04. The vertical co-seismic displacements measured in the far-field across the Mt. Vettore fault are
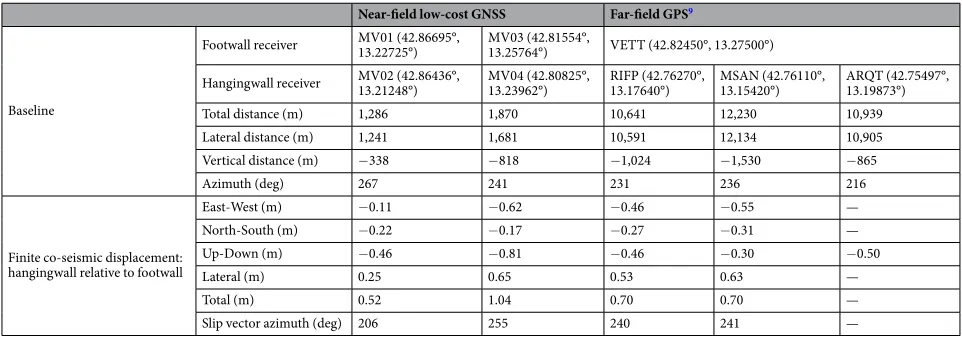
Near-field low-cost GNSS Far-field GPS9
Baseline
Footwall receiver MV01 (42.86695°, 13.22725°) MV03 (42.81554°, 13.25764°) VETT (42.82450°, 13.27500°)
Hangingwall receiver MV02 (42.86436°, 13.21248°) MV04 (42.80825°, 13.23962°) RIFP (42.76270°, 13.17640°) MSAN (42.76110°, 13.15420°) ARQT (42.75497°, 13.19873°)
Total distance (m) 1,286 1,870 10,641 12,230 10,939
Lateral distance (m) 1,241 1,681 10,591 12,134 10,905
Vertical distance (m) −338 −818 −1,024 −1,530 −865
Azimuth (deg) 267 241 231 236 216
Finite co-seismic displacement: hangingwall relative to footwall
East-West (m) −0.11 −0.62 −0.46 −0.55 —
North-South (m) −0.22 −0.17 −0.27 −0.31 —
Up-Down (m) −0.46 −0.81 −0.46 −0.30 −0.50
Lateral (m) 0.25 0.65 0.53 0.63 —
Total (m) 0.52 1.04 0.70 0.70 —
Slip vector azimuth (deg) 206 255 240 241 —
[image:4.595.74.555.45.215.2]www.nature.com/scientificreports/
-0.9 -0.8 -0.7 -0.6 -0.5 -0.4 -0.3 -0.2 -0.1 0.0 0.1 0.206:40:00 06:40:05 06:40:10 06:40:15 06:40:20 06:40:25 06:40:30 06:40:35 06:40:40 06:40:45 06:40:50 06:40:55 06:41:00 -0.6 -0.5 -0.4 -0.3 -0.2 -0.1 0.0 0.1
06:40:00 06:40:05 06:40:10 06:40:15 06:40:20 06:40:25 06:40:30 06:40:35 06:40:40 06:40:45 06:40:50 06:40:55 06:41:00
Dis pl ac emen t (m ) Time (UTC)
Displacement: MV02 (hangingwall) relave to MV01 (footwall)
-800 -400 0 400 800
Acceleraon: Staon IT.CLO
-800 -400 0 400 800 -800 -400 0 400 800
06:40:00 06:40:05 06:40:10 06:40:15 06:40:20 06:40:25 06:40:30 06:40:35 06:40:40 06:40:45 06:40:50 06:40:55 06:41:00
Time (UTC) Proc es se d accele ra o n (cm/ s 2) East West North South Up Down -0.25 -0.11 -0.22 -0.46 -0.65 -0.62 -0.81
INGV Origin time
-0.2 0.0 0.2
-0.8 -0.6 -0.4 -0.2 0.0
No rt hw ar d di sp la ce me nt Eastward displacement Start End 255°
Estimated rise time: 2 - 4 s
Estimated slip velocity: 0.26 - 0.52ms-1 Estimated slip velocity: 0.13 - 0.26 ms-1
Start : MV01-MV02Start : MV03-MV04End : MV01-MV02End : MV03-MV04
East North Up West South Down Finite displacement : Finite displacement :
a
b
c
PGA -0.4 -0.2 0.0-0.4 -0.2 0.0
No rt hw ar d di sp la ce me nt Eastward displacement Start End 206°
Estimated rise time: 2 - 4 s
Disp la ce me nt (m ) Time (UTC) -0.17 Horizontal: East-West Horizontal: North-South Vercal: Up-Down Resolved horizontal displacement
Displacement: MV04 (hangingwall) relave to MV03 (footwall)
Extension East North Up West South Down Extension 06: 40: 17 .36 06 :4 0: 17 .3 6 Horizontal: East-West Horizontal: North-South Vercal: Up-Down Resolved horizontal displacement Shortening Shortening 06 :4 0: 17 .3 6
PGA: -419 cm/s2
PGA: 571 cm/s2
PGA: 782 cm/s2
Star
t yy
End
INGV Origin time
yy
End
Star
t
INGV Origin time
Figure 2. (a,b) Time-series of three component relative displacement recorded by GNSS receivers (06:40:00–
[image:5.595.164.550.51.606.2]0.50 m (VETT-ARQT), 0.46 m (VETT-RIFP) and 0.30 m (VETT-MSAN), which are less than the corresponding near-field displacement of 0.81 m we recorded with GNSS (MV03-MV04), consistent with the localisation of vertical displacement close to extensional faults. Near-field GNSS data for baseline MV01-MV02, approximately 6 km to the north west are more difficult to reconcile with far-field GPS data, due to an increase in structural complexity in this region, including additional synthetic and antithetic faults that produced surface ruptures to the west and east of our GNSS baseline.
InSAR-derived line of sight displacements (24 August, 2016–02 November, 2016, ALOS-2, descending track), averaged within a 200 meter radius of our GNSS units show relative displacements of −0.42 m and −0.97 m for the two baselines. These compare very closely with our near-field GNSS displacement values of −0.41 m and
−1.00 m derived by resolving the GNSS displacements into the InSAR line of sight measurement direction. We visited the GNSS sites and inspected nearby scarp surfaces of the Mt. Vettore fault on 28–29th October (i.e. prior to the Mw 6.6 event), and again in the two days following the 30th October earthquake. Our field
observations four hours after the earthquake confirmed finite surface rupture displacements had intersected both GNSS baselines (Fig. 1b,c) and that significant slip had occurred on an antithetic fault system to the west of MV02 (Fig. 1d). The measured total displacement of ruptures intersecting baseline MV03-MV04 are similar to the GNSS displacements (−1.21 m downward and 0.44 m horizontal), while those rupture displacements inter-secting baseline MV01-MV02 were far less than the corresponding GNSS displacements (−0.06 downward and 0.05 horizontal). These two comparisons are highly informative as they provide a unique insight into two typical situations encountered when comparing near-field displacements to finite surface slip. Firstly, the case of base-line MV03-MV04 where the tectonic system is relatively simple and a good agreement exists between near-field displacement and finite surface displacement. Secondly, the case of MV01-MV02, where the tectonic system is complex and disparities exist between near-field displacement and finite surface displacement that in this case is due to the presence of multiple closely spaced faults with differing orientations and slip vector azimuths.
Timing of ground rupture
Data from the Italian National Seismic Network5 record the hypocentre origin time for the 30th October
earth-quake as 06:40:17.36 ±0.02 UTC. The accelerometer IT.CLO at Castelluccio village (Fig. 1), installed as part of the Italian Strong Motion Network15, recorded an arrival time of 06:40:20.24 UTC, with a duration of 8.86–9.71
seconds16 (Fig. 2c). The initiation of acceleration at IT.CLO preceded the rupture-induced co-seismic
displace-ment at our GNSS baselines by no more than 1–2 s. At IT.CLO the peak ground acceleration in the north-south and up-down components occurred at approximately 06:40:23.50, and the east-west component is also close to its maximum value at that time which is near-synchronous with the interpreted cessation of co-seismic displacement at each of our baselines (Fig. 2c).
By comparing the timing of key events across different datasets, we can make the following observations on the evolution of the co-seismic sequence. Surface and near-surface rupture initiated almost immediately (1–2 s) after the onset of shaking at the Castelluccio accelerometer IT.CLO, and significant rupture ceased within five seconds or less after the onset of shaking at IT.CLO. Most, if not all, of the GNSS measured co-seismic displace-ment occurred prior to the time of peak ground acceleration. Finite displacedisplace-ment across both GNSS baselines was achieved rapidly, within ca. six to eight seconds of the hypocentre origin time (Fig. 2c), demonstrating that the observed surface ruptures are the result of dynamic earthquake slip.
The timing and magnitude of the co-seismic displacements measured using GNSS in the near-field show that the observed surface ruptures are part of a capable fault array on which the surface rupture developed as a direct and immediate response to the propagation of slip from depth during the 30th October earthquake. The implica-tion of this unique observaimplica-tion is that measurements of surface slip obtained through earthquake geology and pal-aeoseismology can reliably inform physical models of earthquakes where rupture mechanics are required and to aid interpretation of the palaeoseismic record. Alternative mechanisms for the partial or complete generation of some of the surface displacements of this earthquake sequence have been proposed, involving shaking induced shallow landslides and deep seated gravitational slope deformation on a large scale17–21. Such mechanisms are very unlikely
to be the cause of the displacements we have observed, as landslides and large-scale slope deformation are known to occur progressively over typical time periods of 45–220 seconds22, 23, whereas we have shown that finite co-seismic
displacement in the near-field occurred rapidly, within six to eight seconds of the hypocentre origin time. The use of low-cost GNSS receivers located in close proximity to capable faults can significantly enhance our understanding of co-seismic processes and are complementary to existing far-field networks. There is additional scope for further technical development and improved deployment of GNSS receivers, and we are currently testing a number of future enhancements. To provide greater insight into earthquake propagation and surface rupture processes we need to increase the temporal resolution of co-seismic measurements, and are already now using a higher GNSS recording frequency of 10 Hz in other active tectonics projects. Similarly, we are improving spatial resolution by deploying a larger number of receivers in closer proximity to recent surface ruptures, to help investigate spatial variability in near-field displacements during future earthquakes. Remotely operated units that require minimal maintenance will significantly reduce deployment costs.
Methods
www.nature.com/scientificreports/
design; the units log data continuously until power is depleted or the memory of the logger is full. Hence this configuration requires no maintenance or interaction duration operation other than to change the battery and to retrieve data from the data logger. Additional batteries can be installed in parallel to lengthen this maintenance interval. We are developing future versions of these units which will record dual frequency observation data at 10 Hz and be entirely self-sufficient in terms of power and data transfer.
The units were already installed prior to the 30th October earthquake as part of a longer-term project to
mon-itor seismicity following the 24th August Amatrice earthquake. Following retrieval of data from the GNSS units the recorded observation data from each hangingwall receiver and its footwall counterpart was post-processed using static relative positioning to calculate the position of the hangingwall receiver relative to its footwall coun-terpart with time. The initial position of the footwall receiver of each footwall-hangingwall pair was calculated using Precise Point Positioning (PPP). The recorded observation data were supplemented with navigation, iono-spheric, precise orbit and clock data from the International GNSS service (www.igs.org).
Data Availability
The datasets generated during and/or analysed during the current study are available from the corresponding author on reasonable request.
References
1. Wallace, R. E. Impacts on society, Active Tectonics (National Academy Press, Washington, D.C., 1986).
2. Seismic Hazards in Site Evaluation for Nuclear Installations, IAEA Safety Standards Series No. SSG-9 (International Atomic Energy Agency, Vienna, 2010).
3. The contribution of palaeoseismology to seismic hazard assessment in site evaluation for nuclear installations. IAEA TECDOC 1767
(International Atomic Energy Agency, Vienna, 2015)
4. U.S. Geological Survey, ANSS Comprehensive Earthquake Catalog (ComCat), https://earthquake.usgs.gov/earthquakes/ (2017) (27/02/2017).
5. INGV Seismological Data Centre. Rete Sismica Nazionale (RSN). Istituto Nazionale di Geofisica e Vulcanologia (INGV), Italy.
doi:10.13127/SD/X0FXnH7QfY (1997).
6. Pucci, S. et al. Coseismic effects of the 2016 Amatrice seismic sequence: first geological results. Annals of Geophysics 59, doi:10.4401/ ag-7195 (2016).
7. Livio, F. A. et al. Surface faulting during the August 24, 2016, Central Italy earthquake (Mw 6.0): preliminary results. Annals of Geophysics 59, doi:10.4401/ag-7197 (2016).
8. Michele, M. et al. The Amatrice 2016 seismic sequence: a preliminary look at the mainshock and aftershocks distribution. Annals of Geophysics 59, doi:10.4401/ag-7227 (2016).
9. INGV Working Group “GPS Geodesy (GPS data and data analysis centre)”. Preliminary co-seismic displacements for the October 26 (Mw5.9) and October 30 (Mw6.5) central Italy earthquakes from the analysis of GPS stations. Zenodo. doi:10.5281/
zenodo.167959 (2016).
10. INGV Working Group “Terremoto in centro Italia”. Summary report on the October 30, 2016 earthquake in central Italy Mw 6.5. doi:10.5281/zenodo.166238 (2016).
11. Scognamiglio, L., Tinti, E. & Michelini, A. Real-time determination of seismic moment tensor for italian region. Bull. Seism. Soc. of Am. 99, 2223–2242, doi:10.1785/0120080104 (2009).
12. Brown, N., Troyer, L., Zelzer, O. & Van Cranenbroek, J. Advances in RTK and Post Processed Monitoring with Single Frequency GPS. Journal of Global Positioning Systems 5, 145–151 (2006).
13. Takasu, T. & Yasuda, A. Evaluation of RTK-GPS performance with low-cost single-frequency GPS receivers. Paper presented at: International Symposium on GPS/GNSS, Tokyo. Place of publication: Tokyo University of Marine Science and Technology (2008). 14. DoD, U.S. Global positioning system standard positioning service performance standard. Assistant secretary of defense for command,
control, communications, and intelligence (2001).
15. Gorini, A. et al. The Italian strong motion network. Bulletin of Earthquake Engineering 8, 1075–1090, doi:10.1007/s10518-009-9141-6 (2010).
16. Luzi, L., Puglia, R. & Russo, E. ORFEUS WG5. Engineering Strong Motion Database, version 1.0. Istituto Nazionale di Geofisica e Vulcanologia, Observatories & Research Facilities for European Seismology, doi:10.13127/ESM (2016).
17. Aringoli, D. et al. The August 24th 2016 Accumoli earthquake: surface faulting and Deep Seated Gravitational Slope Deformation
(DSGSD) in the Monte Vettore area. Annals of Geophysics 59, doi:10.4401/ag-7199 (2016).
18. Albano, M. et al. Minor shallow gravitational component on the Mt. Vettore surface ruptures related to the Mw 6, 2016 Amatrice earthquake. Annals of Geophysics 59, doi:10.4401/ag-7299 (2016).
19. Blumetti, A. M. et al. On the significance of the Mt. Vettore surface ruptures. GNGTS, Sessione Amatrice, available from http:// www3.ogs.trieste.it/gngts/files/2016/SSp/Riassunti/Blumetti.pdf (04/04/2017) (2016).
20. Huang, M.-H. et al. Coseismic deformation and triggered landslides of the 2016 Mw 6.2 Amatrice earthquake in Italy. Geophys. Res. Lett. 44, 1266–1274, doi:10.1002/2016GL071687 (2017).
21. Pucci, S. et al. Coseismic ruptures of the 24 August 2016, Mw 6.0 Amatrice earthquake (central Italy). Geophys. Res. Lett. 44, 2138–2147, doi:10.1002/2016GL071859 (2017).
22. La Rocca, M. et al. Seismic Signals Associated with Landslides and with a Tsunami at Stromboli Volcano, Italy. BSSA 94, 1850–1867, doi:10.1785/012003238 (2004).
23. Ekström, G. & Stark, C. P. Simple Scaling of Catastrophic Landslide Dynamics, Science 339, doi:10.1126/science.1232887 (2013). 24. Jarvis, A., Reuter, H. I., Nelson, A. & Guevara, E. Hole-filled seamless SRTM data V4, International Centre for Tropical Agriculture
(CIAT), available from http://srtm.csi.cgiar.org (11/01/2017) (2008).
25. Wessel, P. & Smith, W. H. F. New, improved version of generic mapping tools released. Eos Trans. Am. Geophys. Union 79, 579–579 (1998).
Acknowledgements
[image:7.595.162.557.226.646.2]Author Contributions
Dr. Maxwell Wilkinson (Geospatial Research Ltd., Durham University): Lead author. Industry partner of NE/ P018858/1. Designed, developed and deployed the low-cost GNSS units. Processed GNSS data to produce the time-displacement datasets. Produced the comparison with other datasets. Prof. Ken McCaffrey (Durham University): Co.I. of NE/P018858/1 and P.I. of NE/I02318X/1. Suggested we apply low-cost GNSS to monitor post-seismic deformation in Italy, co-ordinated fieldwork, advised on GNSS deployment locations and contributed to the discussion and manuscript preparation. Dr. Richard Jones (Geospatial Research Ltd., Durham University): Assisted in the development of the GNSS units, contributed to the discussion and manuscript preparation. Prof. Gerald Roberts (Birkbeck University of London): Co.I. of NE/P018858/1 and P.I. of NE/I02318X/1. Advised on GNSS deployment locations, contributed to the discussion and manuscript preparation. Prof. Bob Holdsworth (Durham University): Contributed to the discussion and manuscript preparation. Dr. Laura Gregory (University of Leeds): P.I. of NE/P018858/1 and NE/I02318X/1. Co-ordinated fieldwork, assisted in GNSS deployment and contributed comparative surface rupture displacement measurements. Dr. Richard Walters (COMET, Durham University): Co.I. of NE/P018858/1. Advised on GNSS deployment and contributed comparative InSAR data. Dr. Luke Wedmore (University of Leeds): Assisted in GNSS deployment and contributed comparative surface rupture displacement measurements. Drafted Fig. 1a. Mr. Huw Goodall (University of Leeds): Helped select locations for GNSS deployment and assisted in deployment. Mr. Francesco Iezzi (Birkbeck University of London): Helped select locations for GNSS deployment and assisted in deployment.
Additional Information
Supplementary information accompanies this paper at doi:10.1038/s41598-017-04917-w
Competing Interests: The low-cost GNSS units used in this research are developed by Geospatial Research
Limited. Maxwell Wilkinson is an employee of Geospatial Research Limited, Richard Jones is the managing director, Ken McCaffrey and Robert Holdsworth are directors.
Publisher's note: Springer Nature remains neutral with regard to jurisdictional claims in published maps and
institutional affiliations.
Open Access This article is licensed under a Creative Commons Attribution 4.0 International
License, which permits use, sharing, adaptation, distribution and reproduction in any medium or format, as long as you give appropriate credit to the original author(s) and the source, provide a link to the Cre-ative Commons license, and indicate if changes were made. The images or other third party material in this article are included in the article’s Creative Commons license, unless indicated otherwise in a credit line to the material. If material is not included in the article’s Creative Commons license and your intended use is not per-mitted by statutory regulation or exceeds the perper-mitted use, you will need to obtain permission directly from the copyright holder. To view a copy of this license, visit http://creativecommons.org/licenses/by/4.0/.