BRAND AWARENESS AND BRAND PREFERENCE
Pramod Hanmantrao Patil Assistant Professor
BE( Mechanical), MBA ( Marketing), PGDDM, PhD ( Marketing)
School of Management Sciences, SRTMUN Sub-centre
Swami Ramanad Teerth Marathwada University , Nanded
Latur ( Maharashtra)
ABSTRACT
Nowadays, branded products are consumed almost in every sector by all sections of the society.
A brand name is an assurance by the seller to consumers about services offered by him. It
reduces buyer’s risk and makes the decision making process simpler. In order to reduce risk
consumers prefer those brands which are known and familiar to them. Hence, brand awareness
becomes the initial step and foundation for brand preference. As Fast Moving Consumer Goods
are frequently consumed by every section of the society, the relationship between these two
dimensions of brand equity – brand awareness and brand preference can be well defined and
understood . Sixteen FMCG brands from different segments and eight product categories were
selected for the study. A significant relationship is observed between brand awareness and brand
preference for all sixteen FMCG brands.
Keywords: Brand, brand awareness, brand preference, brand recall, FMCG
Inte rnational Research Journal of Management and Comme rce ISSN: (2348-9766) Impact Factor- 5.564, Volume 4, Issue 7, July 2017 We bsite- www.aarf.asia, Email : editor@aa rf.asia , ed itoraarf@g mail.co m
Introduction
The Fast Moving Consumer Goods (FMCG) sector is a key contributor of the Indian economy.
The industry has tripled in size in the last few years and growing much faster than in past
decades. Favorable developments happening in demand side, supply side and systematic drivers
shows that this sector has a bright futurei . FMCG sector is more lucrative because of low
penetration levels (especially rural region), well established distribution network, low operating
cost, lower per capita consumption, large consumer base and simple manufacturing processes for
most of products. The mushrooming Indian population with the rising disposable income,
particularly the middle class and the rural segments are acting as a demand driver for this sector.
FMCG sector has tough competition from both unorganized sector and me-too products
particularly in rural areas. Still, a larger section of the society is regularly consuming branded
products of this sector.
A brand is an offering from a known source. A brand name carries many associations in
people’s mind that make up the brand image. All companies strive to build a strong, favorable,
and unique brand imageii. If a mind is not aware of a brand then it is difficult to develop desired
brand associations in consumer’s mind. Awareness of the name act as an anchor to which
everything else about the brand is linked, much like the name of a person acting as an anchor for
tying all associations about himiii . According to Aaker, brand equity is a set of fundamental
dimensions such as brand awareness, brand perceived quality, brand loyalty and brand
associationsiv. Brand awareness is related to the strength of brand node or trace in memory,
which we can measure as the consumer’s ability to identify brand under different conditionsv
. It
is the ability of a potential buyer to recognize or recall that a brand is a member of a certain
product category. The importance of brand awareness in the mind of the customers can be
evaluated at various stages e.g. recognition, recall, top of mind, brand dominance and brand
knowledgevi . According to Keller, the relative importance of brand recognition and recall
depends on the extent to which consumers make decisions in the store versus outside the store.
Brand recognition may be more important to the extent that product decisions are made in the
store. Unaided awareness is very important for low value, fast moving goods. When three brands
only those brand which are famous in the marketviii. By creating high brand awareness one can
influence brand liking and hence behavioral intention to purchaseix. In low involvement decision
settings brand awareness is just adequate leading to purchase .Repeat purchase then, is a function
of the functional utility and image utility of the brand. Thus, when perceived quality differences
exist among competing brands, consumers may “pay a price” for employing simple choice
heuristics such as brand awareness in the interest of economizing time and effortx. Results reveal
consumers' brand usage experiences contribute to brand awareness, implying experience
precedes awareness in some contexts. The results also confirm positive association between
brand awareness and brand equityxi.
American Marketing Association defined brand preference as one of the indicators of strength of
a brand in the hearts and minds of customers; it represents which brands are preferred under
assumptions of equality in price and availability. Customers form brand preferences to reduce the
complexity of the purchase decision processxii. The process of forming brand preference
involves: first, being exposed to many brands, followed by a complex purchase decision process.
Customers often remove some brands from their memory; then, among remaining brands of
products, customers memorize brands they would consider purchasing in the futurexiii.Consumer
brand preference represents three components: cognitive, affective and conative or behavioralxiv.
There is high relation between cognition and consumer choicexv. Thus it is concluded that
purchase intentions can be enhanced with the increase in the Brand awareness.
Objectives
To study the concept of brand awareness and brand preference
To study relation between brand awareness and brand preference
Hypothesis
H0: There is no relation between brand awareness and brand preference
Research Methodology
This study of brand awareness and brand preference was conducted in both rural and urban
regions of Latur district (Maharashtra, India). Total sixteen FMCG brands which were easily
available in both regions - two brands from eight product categories each ( toilet soap, detergent
powder, detergent flake, hair oil, fairness cream , biscuit and tea) were selected after conducting
the pilot study. Both exploratory and descriptive research design was used. Multi stage sampling
technique was used for selection of sampling units. In first-stage, Latur district was divided into
10 clusters i.e. talukas such as Latur, Udgir, Ausa, Nilanga, Renapur, Chakur, Devani, Shirur
anantpal, Jalkot and Ahmadpur. The survey sample size was 938 and it was calculated using
statistical formula. A structured questionnaire containing close ended questions was used for data
collection. The questionnaire was designed in both English and Marathi languages considering
the profile of respondents, especially rural consumers.
Brand knowledge can be expressed as a sum of brand awareness and brand image. Each of the
parameters (i.e. brand recall/strength of brand associations/attitudes/user image) can be measured
on 1 to 10 scalesxvi. In this study brand recall was given highest point as 10, brand recognitio n as
6 and unawareness as 2 points for the calculation of brand awareness. First respondents were
asked to recall brands from each product category, if he/she answers any of t he selected brand
(for e.g. Lux and Santoor in toilet soap category) it was treated as highest awareness level and
ten points were given. If the respondent could not recall selected brands then aided questions
were asked on the basis of positioning aspect (for Lux brand),color of the product (Santoor),color
and content (Wheel, Rin, Nirma), packaging ( Parle, Fair& lovely ) and advertising (Tata tea). If
the respondent recalls the brand then 6 points were given (Aided brand recall) if he or she didn’t
answer, then 2 points were given (No recognition). Brand preference questions were asked to
each respondent for each product category.
Findings and Discussion
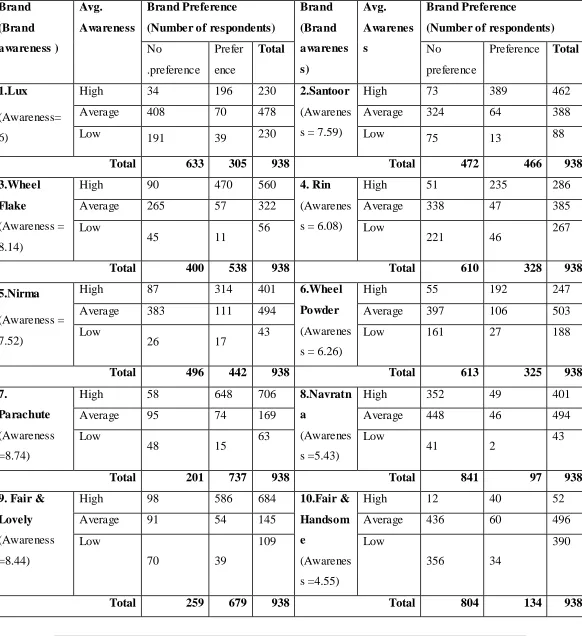
Table 1 Cross tabulation between brand awareness and brand preference categories Brand (Brand awareness ) Avg. Awareness Brand Preference
(Number of respondents)
Brand (Brand awarenes s) Avg. Awarenes s Brand Preference
(Number of respondents) No
.preference
Prefer
ence
Total No
preference
Preference Total
1.Lux (Awareness=
6)
High 34 196 230 2.Santoor
(Awarenes
s = 7.59)
High 73 389 462
Average 408 70 478 Average 324 64 388
Low 191 39 230 Low 75 13 88
Total 633 305 938 Total 472 466 938
3.Wheel Flake
(Awareness =
8.14)
High 90 470 560 4. Rin
(Awarenes
s = 6.08)
High 51 235 286
Average 265 57 322 Average 338 47 385
Low
45 11 56 Low 221 46 267
Total 400 538 938 Total 610 328 938
5.Nirma (Awareness =
7.52)
High 87 314 401 6.Wheel
Powder (Awarenes
s = 6.26)
High 55 192 247
Average 383 111 494 Average 397 106 503
Low
26 17 43 Low 161 27 188
Total 496 442 938 Total 613 325 938
7.
Parachute (Awareness
=8.74)
High 58 648 706 8.Navratn
a
(Awarenes
s =5.43)
High 352 49 401
Average 95 74 169 Average 448 46 494
Low
48 15 63 Low 41 2 43
Total 201 737 938 Total 841 97 938
9. Fair & Lovely (Awareness
=8.44)
High 98 586 684 10.Fair &
Handsom e
(Awarenes
s =4.55)
High 12 40 52
Average 91 54 145 Average 436 60 496
Low
70 39
109 Low
356 34
390
11. Colgate (Awareness
=8.36)
High 93 567 660 12.
Close up (Awarenes
s =4.86)
High 25 70 95
Average 133 39 172 Average 403 79 482
Low
71 35 106 Low 347 14 361
Total 297 641 938 Total 775 163 938
13. Parle-G (Awareness
=8.66)
High 131 549 680 14.
Good day (Awarenes
s =5.59)
High 20 116 136
Average 162 40 202 Average 454 116 570
Low
45 11 56 Low 187 45 232
Total 338 600 938 Total 661 277 938
15.
Broke bond (Awareness
=4.38)
High 67 92 159 16.
Tata (Awarenes
s =5.88)
High 62 214 276
Average 210 32 242 Average 251 107 358
Low
463 74 537 Low 257 47 304
Total 740 198 938 Total 570 368 938
The major findings of the study are as follows:
In toilet soap category, the average brand awareness of Santoor (7.59) is more than Lux (6).
Also, brand recall is higher for Santoor soap than Lux. Out of the total 938 respondents, 305
preferred Lux brand whereas 460 preferred Santoor brand.
The average brand awareness of Wheel flake (8.14) is more than Rin (6.08). Wheel brand
was preferred by 538 respondents whereas Rin was preferred by 328 respondents.
The average brand awareness of Nirma (7.52) is more than Wheel (6.26). Nirma brand is
preferred by 442 respondents and Wheel by 325.
The average brand awareness of Parchute (8.74) brand is more than Navratna (5.43). Out of
938 respondents, 737 preferred Parchute brand whereas only 97 respondents shown
preference for Navratna brand.
The average brand awareness for the Fair& lovely brand is 8.44 which is almost double of
The average brand awareness for Colgate is 8.36 whereas for Close up it is 4.86. The brand
preference is more for Colgate (641 respondents) than Close up (163).
The average awareness for Parle-G is 8.46 and for Good day it is 5.59.The brand preference
is more for Parle-G than Good day, 600 respondents preferred Parle-G where as 277
preferred Good day.
The average brand awareness for Tata tea (5.88) is marginally more than Broke bond
(4.38).Out of 938 respondents, 368 preferred Tata tea whereas 198 preferred Broke bond
brand.
In all product categories, the brand having high awareness is more preferred. Also, in most of
the cases the relative percentage of people who prefer the brand decreases with dcreasing
awareness level .i.e consumer brand preference is found more in higher brand awareness
category than average and lower awareness categories.
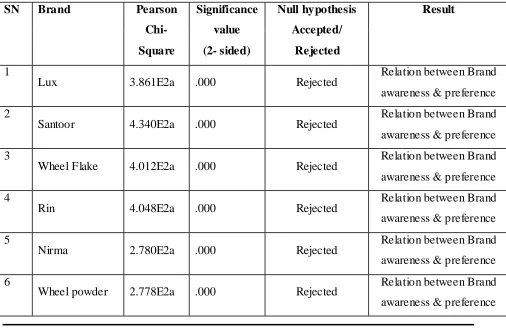
Chi-square test results between brand awareness category (High, Average & low brand
[image:7.612.68.574.369.698.2]awareness) and Brand preference status for all sixteen brands is given in the following table:
Table no.2 Chi square test between brand awareness and brand preference
SN Brand Pearson
Chi-Square
Significance value (2- sided)
Null hypothesis Accepted/
Rejected
Result
1
Lux 3.861E2a .000 Rejected Relation between Brand
awareness & preference
2
Santoor 4.340E2a .000 Rejected Relation between Brand
awareness & preference
3
Wheel Flake 4.012E2a .000 Rejected Relation between Brand
awareness & preference
4
Rin 4.048E2a .000 Rejected Relation between Brand
awareness & preference
5
Nirma 2.780E2a .000 Rejected Relation between Brand
awareness & preference
6
Wheel powder 2.778E2a .000 Rejected Relation between Brand
7
Parachute 3.069E2a .000 Rejected Relation between Brand
awareness & preference
8
Navratna 3.592a .166 Rejected Relation between Brand
awareness & preference
9
Fair & Lovely 2.288E2a .000 Rejected Relation between Brand
awareness & preference
10 Fair &
Handsome 1.799E2a .000 Rejected
Relation between Brand
awareness & preference
11
Colgate 3.210E2a .000 Rejected Relation between Brand
awareness & preference
12
Close up 2.559E2a .000 Rejected Relation between Brand
awareness & preference
13
Parle 3.016E2a .000 Rejected Relation between Brand
awareness & preference
14
Good day 2.377E2a .000 Rejected Relation between Brand
awareness & preference
15
Brooke Bond 1.553E2a .000 Rejected Relation between Brand
awareness & preference
16
Tata 2.550E2a .000 Rejected Relation between Brand
awareness & preference
The relation between brand awareness and brand preference is tested by applying Chi square test
at 5% significance level. The null hypothesis is rejected in all cases, i.e. alternate hypothesis is
accepted. It means there is a relation between brand awareness and brand preference.
Conclusion
For all sixteen brands, a positive relation between brand awareness and brand preference is
References
i
Patil, P. (2016, “a” ) , “An Overview of Indian FMCG Sector” , Paripex- Indian Journal of
Research, 5(2),pp.171-173.
ii
Kotler, P., Keller, K., Koshy, A., Jha M. (2009), Marketing Management- A South Asian
Perspective, (13th ed.), Pearsons Education, New Delhi, pp. 15.
iii
Kumar,A. , Meenakshi, N. (2006). Marketing Management, (1st ed.),Vikas Publishing House
Pvt. Ltd, New Delhi, pp. 223.
iv
Aaker, D.A. (1991), Managing Brand Equity: Capitalizing on the Value of a Brand Name, The Free Press, New York.
v
Keller,K. (2008, “b”). Strategic Brand Management, (3rd ed.), Prentice Hall, New Jersey, pp.
73.
vi
Aaker, D.A. (1996), Building Strong Brands, The Free Press, New York
vii
Laurent, G., Kapferer, J., Roussel, F. (1995), “The Underlying Structure of Brand Awareness Scores”, Marketing Science,14(3) part2 of 2, 1995.
viii
Keller, K.L. (1993), “Conceptualizing, Measuring, and Managing Customer-Based Brand Equity”, Journal of Marketing, Vol.57 (1).
ix
Patro, S., Varshney, S. (2008), “Brand awareness and preference in rural markets”, proceedings of International conference on Marketing to rural consumers- understanding and
tapping the rural potential in IIMK, 3rd to 5th April 2008.
x
Hoyer, W., Brown, S.(1990), “Effects of Brand Awareness on Choice for a Common,
Repeat-Purchase Product”, Journal of consumer research, 17(2) ,pp. 141-148.
xi
Huang, R., Sarigollu, E. (2012), “How brand awareness relates to market outcome, brand equity, and the marketing mix” , Journal of Business Research , 65(1), pp. 92-99.
xii
Gensch, D. (1987), “A two-stage disaggregate attribute choice model”, Marketing Science,
6(3), pp.223-231.
xiii
Hwang, J.,Chihyung O. (2013), “The antecedents and consequence of consumer attitudes
toward restaurant brands: A comparative study between casual and fine dining restaurants”,
International Journal of Hospitality Management, pp121 -131.
xiv
Grimm, P. (2005), “Ab components’ impact on brand preference”, Journal of Business
xv
Bartels, D., Johnson, E., “Connecting cognition and consumer choice”,
Cognition,135,pp.47-51.
xviMoorthi ,YLR,( 2003, “c”),