Conditioning Research. ISSN 1064-8011 DOI: https://doi.org/10.1519/JSC.0000000000002943
Link to Leeds Beckett Repository record: http://eprints.leedsbeckett.ac.uk/5344/
Document Version: Article
The aim of the Leeds Beckett Repository is to provide open access to our research, as required by funder policies and permitted by publishers and copyright law.
The Leeds Beckett repository holds a wide range of publications, each of which has been checked for copyright and the relevant embargo period has been applied by the Research Services team.
We operate on a standard take-down policy. If you are the author or publisher of an output and you would like it removed from the repository, please contact us and we will investigate on a case-by-case basis.
Seasonal Changes in the Physical Performance of Elite Youth Female Soccer
Players.
Emmonds, S; Sawczuk, T; Scantlebury, S; Till, K; Jones, B.
ABSTRACT
This study investigated the seasonal change in physical performance of 113 (Under 10: U10 (n=20), U12 (n=30), U14 (n=31) and U16 (n=32)) elite youth female soccer players. Players completed testing pre-, mid- and post-season, including speed (10 and 30m sprint), change of direction (CoD; 505 test), power (Countermovement jump, CMJ), strength (isometric mid-thigh pull) and aerobic capacity (YoYo Intermittent Recovery Test Level 1; YYIRL1). A general linear model was used to evaluate the change in physical characteristics and the influence of covariates (baseline performance; change in maturity status) on each
INTRODUCTION
In recent years there has been an increase in the profile of women’s soccer (5). Professional women’s soccer leagues now exist in several countries across the world. At the elite level, soccer requires high technical ability, tactical awareness, and a high level of physical conditioning (6). Therefore, women’s soccer clubs are now investing in youth academies, designed to develop future professional players (10).
Straight line sprinting and jumps have been reported as frequent actions prior to goals during elite soccer for both the scoring and assisting player (12), and to discriminate between standard of competition (16), highlighting the importance of testing and developing such physical qualities in players from a young age. Furthermore, high intensity running ability has also been determined as a key physical attribute for elite soccer performance (1, 2, 24). Elite female players have been reported to perform more high intensity running during International matches compared to domestic matches (1) and perform high intensity running for 28% longer and sprint for 24% longer during matches than non-elite players (24). Similarly, Bradley et al. (2) reported that players performed better on the Yo-Yo Intermittent Endurance Test Level 2 (YYIEL2) than non-elite players, highlighting the importance of testing and training the ability to sustain high intensity running in female soccer players. Therefore, it is important that the monitoring development of these physical qualities as part of a long term athletic development (LTAD) programme is incorporated into the training programme for youth female soccer players (10).
Within England, talented youth female soccer players between the ages of 8-16 years are recruited to attend Regional Talent Centre’s (RTC’s), with the purpose to develop players for the elite senior game. Cross-sectional data examining the physical qualities of elite youth
female soccer players exists, demonstrating that physical qualities develop with increasing age (10, 11, 31). While cross-sectional data are useful for player monitoring and evaluation
development of physical qualities. This is important, particularly for youth players due to factors such as growth and maturation, which may impact upon physical performance (3, 29).
Such analysis is required to facilitate the development of an appropriate long-term athletic development (LTAD) model in youth female soccer and to develop appropriate training
interventions for players.
female soccer to identify and develop talent at a young age, such information would be advantageous for practitioners working with youth players to provide comparative data for
expected seasonal changes across academy-aged squads and how changes in maturity status may impact upon performance. Therefore, the purpose of this study was to evaluate the seasonal
changes in physical performance of U10-U16 elite youth female soccer players with consideration for baseline performance and change in maturity status across the season.
METHODS
Experimental Approach to the Problem
All subjects completed a physical testing battery at three time points (pre, mid and post season) during the 2016-2017 season. Testing was conducted a minimum of 48 hours post competitive match play or training at each respective RTC. A standardised warm-up,
including jogging and dynamic movements were undertaken prior to testing, followed by full instruction and demonstrations of the assessments. The lead researcher undertook all testing.
The testing battery included assessments of anthropometry (standing height, sitting height and body mass), strength (isometric mid-thigh pull; IMTP), lower body power (countermovement jump; CMJ), speed (10 and 30 m sprint) and CoD (505 test left and right) and aerobic
capacity (Yo-Yo intermittent recovery test level 1; YYIRL1). The YYIRL1 was not
conducted at the U10 age category, as this was not current practice at the RTC’s. Participant
were randomly assigned to one of 3 groups; station 1: anthropometric characteristics, station 2: speed and CoD ability, station 3: strength and power. To prevent an order effect, each group of participants completed each station in a random order. The YYIRL1 was completed as one large group to limit the cumulative effects of fatigue on the speed, CoD, strength and power assessments.
One hundred and thirteen players from three Tier 1 RTC’s participated in the study. Players within the academies are grouped into specific age categories for training, including U10 (n =
20, 9.3 ± 0.5 years), U12 (n = 30, 11.3 ± 0.5 years), U14 (n = 31 13.2 ± 0.7 years) and U16 (n = 32, 15.1 ± 0.7 years). U10 and U12 age categories trained twice per week (2 x 90 min
pitched based sessions and 1 x 30-min strength and conditioning session) and U14 and U16 age categories trained three times per week (3 x 90 min based sessions and 2 x 60-min strength and conditioning session), with each age group having on average 20 matches over a 35-week season. Institutional ethics approval was granted from the University Research Ethics Committee. Parental consent and participant ascent were obtained prior to commencing the study.
Procedures
Anthropometric measures and maturity status:
Subjects body mass (kg) was measured to the nearest 0.1 kg using calibrated Seca Alpha (model 770) scales. Standing and sitting height (cm) were recorded to the nearest 0.1 cm using a 132 Seca Alpha stadiometer according to methods previously outlined by Malina and Koziel (21). Maturity was estimated from anthropometric measurements using the Mirwald et al. (23)equation (Equation 1) to predict the number of years from peak height velocity (PHV). While some studies have questioned the use of this method(21, 22), this method was chosen due to the non-invasive nature of the assessment and the satisfactory levels of
measurement accuracy (R2= 0.91, SEE=0.50; Mirwald et al. (23)). This equation has previously been used for the assessment of maturation in youth female soccer (10, 28, 33).
Maturity Offset = -16.364 + 0.0002309 x leg length and sitting height interaction + 0.006277 x age and sitting height interaction + 0.179 x leg by height ratio + 0.0009428 x age and weight interaction.
Strength:
The IMTP was performed on a portable force platform (AMTI, ACP, Watertown, MA) with a sampling rate of 1,000 Hz. Subjects performed the IMTP on a customized pull rack, using a
self-selected position similar to that of the second pull of a power clean (15).The self-selected mid-thigh position was preferred, as differences in knee and hip joint angles during the IMTP have previously been shown to have no influenceon kinetic variables (4). Subjects were given two practice trials prior to testing commencing. Subjects were instructed to pull as “fast and hard” as possible, and received verbal encouragement (9). Each participant completed two trials lasting five seconds, with 5-min rest between each trial. The highest peak force (PF) achieved over the two trials was considered the participants ‘best trial.’ Relative PF was calculated using the ratio scaling method (i.e. PF / body mass) (18). PF intraclass correlation (ICC) and coefficient of variation (CV) were r = 0.93, CV = 3.6%.
Lower Body Power:
Lower body power was assessed using a CMJ in an indoor gym facility and performed according to previously described methods (25) using a portable photoelectric cell system (Optojump; Microgate, Bolzano, Italy). This equipment has been reported as both reliable and valid (CV = 6%, standard error of estimate = 1%) for vertical jump assessment compared with a biomechanical force plate (14). Jump height was calculated using the cell system software (Optojump Next v1.7.9; Microgate). Subjects completed 3 submaximal CMJ efforts prior to testing commencing and then completed 3 attempts with a 2-min rest period between jumps in line with the methods utilised by Emmonds et al. (10). The he highest jump was selected for analysis. ICC and CV for CMJ were r = 0.96, CV = 4.5%.
Change of Direction (CoD) Time:
accelerated from the start through the timing gates, turning 1800 at the 15 m mark and sprinted back through the timing gates. Subjects completed 3 alternate attempts on each foot
(i.e., right and left leg), separated by a 2–3 min rest period. Times were recorded to the nearest 0.01 sec with the quickest of the 3 attempts used as the final score. ICC and CV for
the 505 test were r = 0.995, CV = 2.2%.
Sprint time:
Sprint times were assessed over 10 and 30m using timing gates (Brower Timing Systems, IR Emit, USA). Subjects started 0.5m behind the initial timing gate and were instructed to set off in their own time and run maximally past the 30 m timing gate. Each subject had 3 attempts, separated by a 3-minute rest period. Times were recorded to the nearest 0.01 seconds with the quickest of the three attempts used for the sprint score. ICC and CV’s for 10 and 30 m sprint time were r = 0.76, CV = 4.8% and r = 0.78, CV = 3.9%, respectively.
Soccer Specific Fitness:
Soccer specific fitness was assessed using the YYIRL1. The YYIRL1 was selected as it has been reported as a valid and reliable test (ICC = 0.82-0.84, CV = 7-16%) for the assessment of soccer specific fitness in youth soccer players (8). While the test is not a true measure of aerobic performance per se, given the duration of the test, the aerobic system will make the largest proportionate contribution to energy production. The test consisted of repeated 20 m shuttle runs at progressively increasing speeds dictated by an audio bleep from a CD player. Between each shuttle a recovery period of 10 seconds is allowed involving walking around a marker placed 5m behind the finishing line. Failure to achieve the shuttle run in time on two occasions resulted in termination of the test. The final level achieved and total running distances were recorded.
A general linear model was conducted using SAS University Edition (SAS Institute, Cary, NC).A general linear model is a generalisation of multiple linear regression model to the case
of more than one dependent variable and therefore allows the control of confounding
variables. This was used to evaluate the change in performance variables and the influence of
the covariates on each performance variable over the course of the season. The change in performance of each variable was used as the dependent variable, with time (mid and end of season) and age group (U10's, U12's, U14's, U16's) added as fixed factors. The pre-season score in the appropriate variable and the change in maturity over the specific period of the study (e.g. pre- to mid-season) were used as covariates. A separate general linear model was used to evaluate the changes in performance from pre-post season.
Results were analysed for practical significance using magnitude-based inferences (17). The threshold for a change to be considered practically important (the smallest worthwhile change; SWC) was set as 0.2 x observed between participant SD, based on Cohen's d effect size (ES) principle. Thresholds for ES were set as: 0.2 small; 0.6 moderate; 1.2 large, 2.0 very large. The probability that the magnitude of change was greater than the SWC was rated as: <0.5% almost certainly not; 0.5-5% very unlikely; 5-25% unlikely; 25-75% possibly; 75-95% likely; 95-99.5% very likely; >99.5% almost certainly (17). Where the probabilities of a substantial positive and negative change were both greater than 5%, the effect is considered unclear. Effect sizes are reported ES; ± 90% confidence intervals.
RESULTS
The raw changes in performance for each age group across all variables are presented in
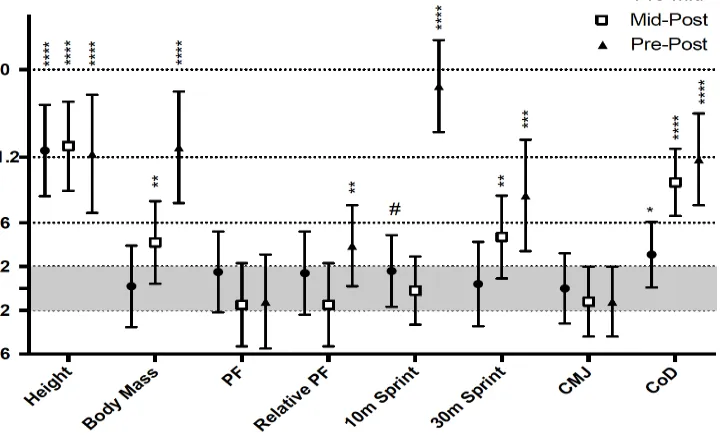
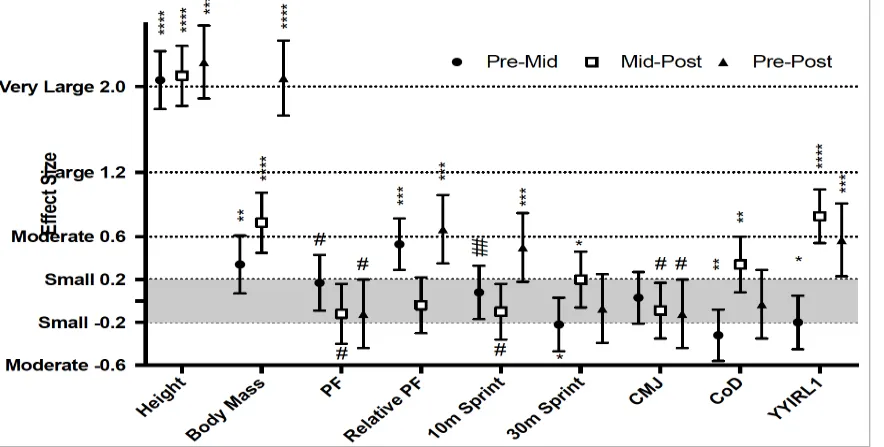
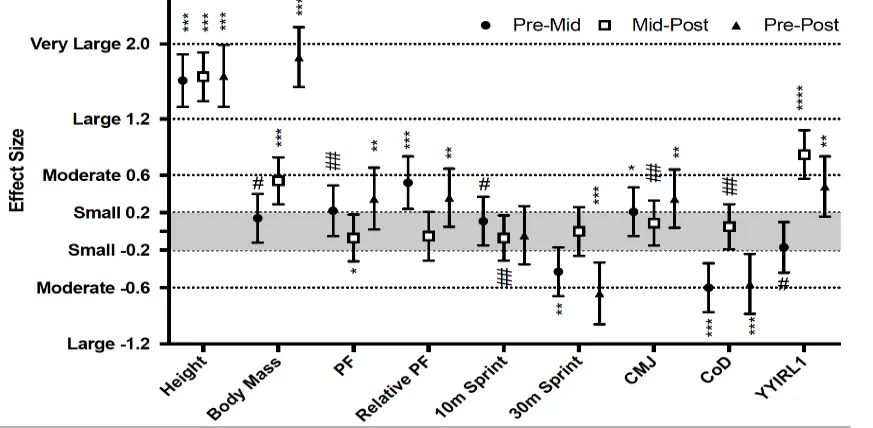
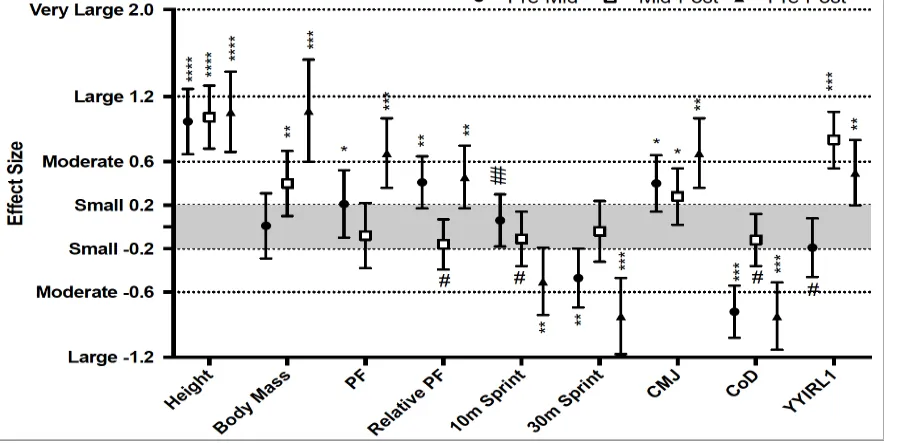
Table 1. Standardised differences between pre, mid and post season independent of baseline performance and change in maturity status are presented in Figures 1-4 for each age group.
All age groups experienced almost certainly increases in body mass and height from pre-post
season. There were unclear and possibly trivial changes in PF for U10 and U12’s respectively, however when made relative to body mass, there were likely to very likely
improvements in relative strength from pre-post season. Both age groups experienced unclear to very likely negative changes in CMJ height, sprint and CoD times (Figures 1-2) from pre-post season.
***Insert Figure 1 Near Here ****
***Insert Figure 2 Near Here****
U14 and U16 players demonstrated the greatest improvements in 10m speed, CoD, and strength from pre-to mid-season, with limited improvement mid-post season (Figures 3-4). Very likely improvements in CoD, 30m sprint and likely improvements in CMJ and relative PF were observed from pre-post season for both U14 and U16 players. Likely improvements in 10m sprint also occurred for U16s. Likely and very likely improvements in PF were observed for U14 and U16 players respectively. U12-U16 players all experienced likely negative changes in YYIRL1 scores from pre-to mid-season, however all age groups displayed almost certainly positive changes in their scores at post-season compared to mid-season.
***Insert Figure 3 Near Here ****
***Insert Figure 4 Near Here****
DISCUSSION
in maturity status. Findings demonstrate that U10 and U12 youth female soccer players may experience decrements in speed, CoD and lower body power across a season, while U14 and
U16 players may experience improvements in these physical qualities. However, all age groups either did not improve or experienced negative changes in strength, speed, CoD time
and lower body power from mid-post season, potentially questioning whether RTC’s are currently focussed upon enhancing physical development within youth female players. Coaches and practitioners need to be aware of this when designing training, prescribing training loads and monitoring changes in physical development across a season. These findings provide a basis for the development of strategies to further enhance the LTAD of youth female soccer players.
U10 and U12 players experienced decrements in CMJ, sprint and CoD performance from pre-to post-season, despite an increase in relative strength. These findings are consistent with the findings of Taylor et al. (28) who observed that U13 youth female soccer players also
experienced decrements in speed and CoD ability across a season. Taylor et al. (28) attributed this to the influence of maturation, which can cause disturbances in motor coordination abilities (26). Given that change in maturity status was accounted for with the statistical model employed within the present study there may be other reasons for this observation. Without the quantification of training load or prescribed stimuli, it is unknown if this finding is due to the biological stage of the athletes (-2.5 YPHV to -0.5 YPHV), or indeed sub-optimal training practices. Either way, a greater focus on the physical development of players at these age groups within RTC’s may be advantageous, particularly focusing on the
development of motor coordination given the decrements in speed and CoD ability observed.
of Taylor et al. (28) who reported that U15 youth female soccer players improved more in the second half of the season. Taylor et al. (28) did not control for changes in maturation status of
the players across the season, which may explain the contrasting findings. This is supported by the findings of Wright and Atkinson (33) who observed a strong correlation between
change in sprint speed and maturation status across a 3-year period in youth female soccer players. In addition to the positive adaptations from training, changes in performance in youth athletes will also reflect the effects of normal growth and maturation (30),therefore any conclusions regarding the magnitude of performance improvement to specific training must account for changes in maturation (34). As such this highlights the importance of considering physical testing results in the context of maturation status when evaluating the performance of youth female soccer players.
improved their aerobic capacity, however all experienced likely decreases in YYIRL1 scores at mid-season, with very likely to almost certainly improvements from mid-post season. As
the first testing point (Pre) occurred at the start of the season (following pre-season), it is possible that these decrements at mid-season may be a consequence of an increased focus on
the technical and tactical aspects of performance during the first part of the season as opposed to physical preparation, which may have been the focus in pre-season. While it is logical that the focus in season may be more on the technical and tactical aspects of the game, coaches need to ensure that they continue to ensure that the LTAD of players is still a focus of training. For example, the manipulation of small sided games (SSG) may provide an appropriate stimulus to maintain aerobic conditioning within season (7) and targeted warm ups may provide an opportunity to develop speed and CoD qualities (10).
A limitation of this research is that it was not possible to include an age matched control group. Comparing changes in performance between youth female soccer players in an RTC and an age matched control group, would allow researchers to specifically quantify the degree to which the current training programmes enhances physical performance beyond normal growth and maturation. Therefore, this should be a direction for future research, in addition to further longitudinal monitoring over a number of seasons to further evaluate the effectiveness of academy training programmes on physical development. A second major limitation of the study was that it was not possible to have further objective training load data. This does limit the ability to explanation the observed changes in physical performance across the season. Therefore, future research should look to make comparisons between changes in training load across a season and physical performance.
PRACTICAL APPLICATIONS
Findings suggest that U10 and U12 youth female soccer players experience decrements in sprint speed, CoD ability and lower body power across a season, despite increases in relative
strength. It is advised that strength and conditioning coaches working with U10-U12 players specifically look to develop speed, lower body power and CoD ability as part of their training
sesisons. This may be achieved as part of structured strength and conditioning sessions as well as focusing on running mechanics, sprinting and plyometric training within warm ups prior to pitch based sessions (10). In contrast, U14 and U16 players experience improvements in speed and CoD across a season, although there appears to be limited improvement in the second half of the season for all age groups. While aerobic capacity improves pre-to post-season, players experienced a decrease in aerobic capacity from pre-to mid-season Therefore, it is advised that coaches look to develop specific training strategies within season that maintain aerobic fitness. Manipulation of SSG’s combined with short duration intermittent high-intensity running drills may provide an efficient training stimulus to develop the aerobic system in U14-U16 players whilst concurrently developing technical/tactical skills within the same session in season (7). It is recommended that coaches use the findings of this study to consider the within-season changes in physical characteristics of youth female soccer players to support the planning of LTAD programmes based on a players age and stage of
REFERENCES
1. Andersson, HÅ, Randers, MB, Heiner-Møller, A, Krustrup, P, and Mohr, M., Elite female soccer players perform more high-intensity running when playing in
international games compared with domestic league games. J Strength Cond Res
24:912-919, 2010.
2. Bradley, PS, Bendiksen, M, Dellal, A, Mohr, M, Wilkie, A, Datson, N, Orntoft, C, Zebis, M, Gomez-Diaz, A, Bangsbo, J, and Krustrup, P. The Application of the Yo-Yo
Intermittent Endurance Level 2 Test to Elite Female Soccer. Scand J Med Sci Sports
24:43-54, 2014.
3. Cobley, S and Till, K. Longitudinal tracking of athlete development: Its importance, methods & future considerations. Chapter 18. In J. Baker, S. Cobley, J. Schorer & N.
Wattie (Eds.) The Handbook of Talent Identification and Development in Sport, Routledge. 2017248-266, 2017.
4. Comfort, P, Stewart, A, Bloom, L, and Clarkson, B. Relationships between strength, sprint, and jump performance in well-trained youth soccer players. J Strength Cond
Res 28: 173-177, 2014.
5. Datson N, Drust B, Weston M, et al. Match physical performance of elite female soccer players during international competition. J Strength Cond Res 31:2379-87,
2017.
6. Datson, N, Drust, B, Weston, M, Jarman, IH, Lisboa, PJ, and Gregson, W. Applied physiology of female soccer: an update. J Sports Med 44:1225-1240, 2014.
7. Dellal, A, Jannault, R, Lopez-Segovia, M, and Pialoux, V. Influence of the numbers of players in the heart rate responses of youth soccer players within 2 vs. 2, 3 vs. 3 and 4
vs. 4 small-sided games. J Hum Kinet 28:107-114, 2011.
9. Dos’Santos, T, Jones, PA, Comfort P, and Thomas, C. Effect of different onset thresholds on isometric mid-thigh pull force-time variables. J Strength Cond Res 31:
3463-3473, 2017.
10. Emmonds S, Morris R, Murray E, Robinson, C, Turner, L, and Jones, B. The influence
of age and maturity status on the maximum and explosive strength characteristics of
elite youth female soccer players. J Sci Med Football 1:209-215, 2017.
11. Emmonds S, Till K, Redgrave J, Murray, E, Turner, L and Jones, B. The influence of age on the anthropometric and performance characteristics of high level youth female soccer players. Int J Sports Sci Coach 2018. 1747954118757437.
12. Faude O, Koch T, Meyer T. Straight sprinting is the most frequent action in goal situations in professional football. J Sports Sci 30:625-31, 2012.
13. Ford, P, De Ste Croix, M, Lloyd, R, Meyers, R, Moosavi, M, Oliver, J, Till, K, and Williams, C. The long-term athlete development model: physiological evidence and application. J Sports Sci 29: 389-402, 2011.
14. Glatthorn, JF, Gouge, S, Nussbaumer, S, Stauffacher, S, Impellizzeri, FM, and
Maffiuletti, NA. Validity and reliability of Optojump photoelectric cells for estimating
vertical jump height. J Strength Cond Res 25:556-560, 2011.
15. Haff, GG, Ruben, RP, Lider, J, Twine, C, and Cormie, P. A comparison of methods for determining the rate of force development during isometric midthigh clean pulls. J
Strength Cond Res 29: 386-395, 2015.
16. Haugen, TA, Tønnessen, E, and Seiler S. Speed and countermovement-jump
characteristics of elite female soccer players, 1995–2010. Int J Sports Physiol Perform
7: 340-349, 2012.
17. Hopkins, WG, Marshall, SW, Batterham, AM, and Hanin, J. Progressive statistics for studies in sports medicine and exercise science. Med Sci Sports Exerc 41:3–12, 2009. 18. Jacobson, BH. A comparison of absolute, ratio and allometric scaling methods for
19. Los Arcos, A, Martínez-Santos, R, Yanci, J, Mendiguchia, J, and Méndez-Villanueva, A. Negative associations between perceived training load, volume and changes in
physical fitness in professional soccer players. J Sports Sci Med 14: 394, 2015.
20. Los Arcos, A, Martínez-Santos, R, Yanci, J, and Mendez-Villanueva, A. Monitoring
perceived respiratory and muscular exertions and physical fitness in young
professional soccer players during a 32-week period. Kinesiology49:2, 2017.
21. Malina, RM, and Kozieł SM. Validation of maturity offset in a longitudinal sample of Polish boys. J Sports Sci 32:424-437, 2014.
22. Malina RM and Kozieł SM. Validation of maturity offset in a longitudinal sample of Polish girls. J Sports Sci2014; 32:1374-1382, 2014.
23. Mirwald, RL, Baxter-Jones, AD, Bailey, DA, and Beunen, GP. An assessment of maturity from anthropometric measurements. Med Sci Sports Exerc 34: 689-694,
2002.
24. Mohr, M, Krustrup, P, Andersson, H, Kirkendal, D, and Bangsbo, J. Match activities of elite women soccer players at different performance levels. J Strength Cond Res 22: 341-349, 2008.
25. Oliver J, Armstrong N, Williams C. Changes in jump performance and muscle activity following soccer-specific exercise. J Sports Sci 26: 141-148, 2008.
26. Philippaerts, RM, Vaeyens, R, Janssens, M, Van Renterghem, B, Matthys, D, Craen, R, Bourgois, J, Vrijens, J, Beunen, G, and Malina, RM. The relationship between peak height velocity and physical performance in youth soccer players. J Sports Sci 24: 221-230, 2006.
27. Silva, JR, Magalhães, JF, Ascensão, AA, Oliveira, EM, Seabra, AF, and Rebelo, AN. Individual match playing time during the season affects fitness-related parameters of
male professional soccer players. J Strength Cond Res 25: 2729-2739, 2011.
29. Till, K, Jones, B, Darrall-Jones, J, Emmonds, S, and Cooke, C. The longitudinal development of anthropometric and physical characteristics in academy rugby league
players. J Strength Cond Res 29:1713-1722, 2015.
30. Valente-dos-Santos, J, Coelho-e-Silva, MJ, Severino, V, Duarte, J, Martins, RS,
Figueiredo, AJ, Seabra, AT, Philippaerts, RM, Cumming, SP, Elferink-Gemser, M,
and Malina, RM. Longitudinal study of repeated sprint performance in youth soccer players of contrasting maturity status. J Sports Sci Med 11: 371-379, 2012.
31. Vescovi, JD, Rupf, R, Brown, TD, and Marques, MC. Physical performance characteristics of high-level female soccer players 12–21 years of age. Scand J Med
Sci Sports 21:670-678, 2011.
32. Williams, CA, Oliver, JL, and Faulkner J. Seasonal monitoring of sprint and jump performance in a soccer youth academy. Int J Sports Physiol Perform 6: 264-275,
2011.
33. Wright, M and Atkinson, G. Changes in sprint-related outcomes during a period of systematic training in a girls' soccer academy. J Strength Cond Res Epub, 2017.
34. Wrigley, RD, Drust, B, Stratton, G, Atkinson, G, and Gregson, W. Long-term soccer-specific training enhances the rate of physical development of academy soccer players
Pre Mid Post Pre Mid Post Pre Mid Post Pre Mid Post YPHV (y) -2.5 ± 0.4 -2.2 ± 0.5 -1.9 ± 0.4 -1.0 ± 0.7 -0.9 ± 0.6 -0.5 ± 0.9 1.0 ± 0.7 1.3 ± 0.7 1.5 ± 0.7 2.2 ± 0.5 2.3 ± 0.6 2.7 ± 0.5
Height (cm) 134.7 ± 7.4 136.1 ± 7.2 137.7 ± 7.1 147.8 ± 8.6 149.3 ± 8.7 151.3 ± 8.7 159.3 ± 7.5 160.5 ± 6.6 161.5 ± 6.5 164.5 ± 6.4 164.9 ± 6.2 165.3 ± 6.0
Body Mass (kg) ± 4.8 29.6 ± 11.1 31.8 ± 5.5 32.2 ± 8.2 38.2 ± 8.8 39.5 ± 9.3 41.6 ± 7.3 49.3 ± 6.8 50.8 ± 6.9 52.8 ± 7.3 56.9 ± 6.7 57.2 ± 6.8 58.4
Peak Force (N)
751.9 ± 131.2 820.4 ± 116.3 846.2 ± 122.4 642.7 ± 249.6 1112.1 ± 254.8 1148.9 ± 235.5 1278.7 ± 245.0 1393.8 ± 185.7 1425.5 ± 201.1 1505.2 ± 182.7 1592.2 ± 194.7 1608.9 ± 216.9 Relative Peak Force (N·s-1·kg-1)
25.6 ± 3.7 26.8 ± 4.6 26.9 ± 3.9 25.9 ± 2.7 28.7 ± 3.5 27.8 ± 2.8 25.9 ± 2.7 27.6 ± 2.6 27.2 ± 3.3 26.6 ± 3.6 28.5 ± 2.2 27.6 ± 3.0
10m Speed (s) ± 0.14 2.23 ± 0.15 2.17 ± 0.12 2.27 ± 0.13 2.06 ± 0.23 1.94 ± 0.10 2.11 ± 0.13 2.04 ± 3.32 2.64 ± 0.06 2.04 ± 0.14 1.97 ± 0.16 1.90 ± 0.10 1.99
30m Speed (s)
5.57 ± 0.35 5.67 ± 0.33 5.65 ± 0.29 5.26 ± 0.26 5.00 ± 0.51 5.19 ± 0.26 4.98 ± 0.25 5.04 ± 0.27 4.91 ± 0.25 4.82 ± 0.23 4.70 ± 0.31 4.81 ± 0.23
CMJ (cm) ± 5.7 22.9 ± 2.8 23.7 ± 3.2 23.4 ± 4.4 27.9 ± 4.8 28.1 ± 4.5 28.4 ± 3.3 29.5 ± 4.9 29.4 ± 6.5 30.2 ± 4.4 31.9 ± 4.9 29.4 ± 4.7 33.7
CoD (s) 2.89 ± 0.15 2.77 ± 0.19 3.00 ± 0.42 2.68 ± 0.18 2.68 ± 0.14 2.70 ± 0.15 2.66 ± 0.16 2.60 ± 0.12 2.59 ± 0.09 2.58 ± 0.12 2.52 ± 0.09 2.53 ± 0.09
YYIRL1 (m) ± 249 643 ± 169 557 ± 247 789 ± 328 919 ± 269 851 ± 278 998 ± 310 964 ± 275 867 ± 293 1010
Data presented as mean ± standard deviation.YPHV = Years from Peak Height Velocity, CoD = Change of direction, CMJ = Countermovement jump, YYIRL1 = Yo-Yo intermittent recovery test
[image:20.842.38.803.57.388.2]