INTRODUCTION
Polycystic ovary syndrome (PCOS), the most common endo-crinological cause of infertility in women of reproductive age, is characterized by ovulatory and menstrual dysfunction, hyper-androgenism, and polycystic ovaries as well as by metabolic abnormalities, such as type 2 diabetes mellitus (T2DM), hyper-tension, and dyslipidemia.1 Insulin resistance (IR) has a key role
in the pathogenesis of PCOS. Approximately 50% to 70% of women with PCOS have IR. The risk of T2DM among women with PCOS is 5 to 10-fold higher than that of healthy controls.2 Because of the high risk of impaired glucose tolerance (IGT) and T2DM in PCOS, screening of women with PCOS to detect abnormalities in glucose tolerance is recommended. Women with PCOS have a significantly increased prevalence of IGT and undiagnosed diabetes.3 We previously reported that the preva-lence of IGT and/or impaired fasting glucose (IFG) and T2DM was 17.0% and 1.0%, respectively, in young Korean women with PCOS.4 The routine use of an oral glucose tolerance test (OGTT) is recommended for screening for IGT and T2DM in women with PCOS.5,6 However, OGTT is time-consuming and labor in-tensive because venous blood samples are required after an overnight fasting and at 120 min after administration of a glu-cose solution.
Women with PCOS have dyslipidemia with prevalence of up to 70%.7 Increased plasma levels of triglycerides (TG) and low levels of high-density lipoprotein (HDL) cholesterol are
charac-Triglycerides to High-Density Lipoprotein Cholesterol
Ratio Can Predict Impaired Glucose Tolerance
in Young Women with Polycystic Ovary Syndrome
Do Kyeong Song, Hyejin Lee, Yeon-Ah Sung, and Jee-Young Oh
Department of Internal Medicine, Ewha Womans University School of Medicine, Seoul, Korea.
Purpose: The triglycerides to high-density lipoprotein cholesterol (TG/HDL-C) ratio could be related to insulin resistance (IR). We previously reported that Korean women with polycystic ovary syndrome (PCOS) had a high prevalence of impaired glucose tolerance (IGT). We aimed to determine the cutoff value of the TG/HDL-C ratio for predicting IR and to examine whether the TG/ HDL-C ratio is useful for identifying individuals at risk of IGT in young Korean women with PCOS.
Materials and Methods: We recruited 450 women with PCOS (24±5 yrs) and performed a 75-g oral glucose tolerance test (OGTT).
IR was assessed by a homeostasis model assessment index over that of the 95th percentile of regular-cycling women who served as the controls (n=450, 24±4 yrs).
Results: The cutoff value of the TG/HDL-C ratio for predicting IR was 2.5 in women with PCOS. Among the women with PCOS
who had normal fasting glucose (NFG), the prevalence of IGT was significantly higher in the women with PCOS who had a high TG/HDL-C ratio compared with those with a low TG/HDL-C ratio (15.6% vs. 5.6%, p<0.05).
Conclusion: The cutoff value of the TG/HDL-C ratio for predicting IR was 2.5 in young Korean women with PCOS, and women
with NFG and a high TG/HDL-C ratio had a higher prevalence of IGT. Therefore, Korean women with PCOS with a TG/HDL-C ratio >2.5 are recommended to be administered an OGTT to detect IGT even if they have NFG.
Key Words: Triglycerides, cholesterol, HDL, insulin resistance, glucose intolerance, polycystic ovary syndrome
Yonsei Med J 2016 Nov;57(6):1404-1411
http://dx.doi.org/10.3349/ymj.2016.57.6.1404 pISSN: 0513-5796 · eISSN: 1976-2437
Received: January 7, 2016 Revised: April 16, 2016
Accepted: May 9, 2016
Corresponding author: Dr. Jee-Young Oh, Department of Internal Medicine, Ewha Womans University School of Medicine, 1071 Anyangcheon-ro, Yangcheon-gu, Seoul 07985, Korea.
Tel: 82-2-2650-6009, Fax: 82-2-2655-2076, E-mail: jyoh@ewha.ac.kr
•The authors have no financial conflicts of interest.
© Copyright: Yonsei University College of Medicine 2016
teristic metabolic abnormalities of insulin resistant individuals.8 The TG to HDL cholesterol (TG/HDL-C) ratio has been report-ed to be relatreport-ed to IR and suggestreport-ed as a surrogate marker.9-11 Several studies suggested that the TG/HDL-C ratio was as ade-quate as the occurrence of metabolic syndrome for identifying insulin resistant individuals.12,13 A high TG/HDL-C ratio predis-posed to diabetes mellitus (DM) in American Caucasian and European populations.14 However, the relationship between the TG/HDL-C ratio and IR differed by race/ethnicity and gender.10,15 TG was suggested as a useful marker for IR in Korean women with PCOS.16 In Chinese women with PCOS, serum lipoprotein ratios such as the TG/HDL-C ratio, total cholesterol to HDL cholesterol ratio, and low-density lipoprotein cholesterol to HDL cholesterol ratio were higher compared with those of the healthy controls, and the TG/HDL-C ratio was significantly cor-related with a homeostasis model assessment of insulin resis-tance (HOMA-IR).17 Additionally, there was a significant corre-lation between the TG/HDL-C ratio and IR in both men and women in the general population.18,19 However, a cutoff value of the TG/HDL-C ratio for predicting IR or metabolic disorders has not been suggested in Korean women with PCOS.
The aim of this study was to determine the cutoff value of the TG/HDL-C ratio for predicting IR and to examine whether the TG/HDL-C ratio is useful for identifying individuals at risk of IGT in young Korean women with PCOS.
MATERIALS AND METHODS
Study subjects
Between 2008 and 2010, we performed a survey of the health and nutritional status of women under 40 years of age who were residents of Seoul, Korea. Of 2950 women who voluntarily participated in this study, who were recruited by newspaper and online advertisements, we enrolled 450 premenopausal women (24±5 years) with PCOS and 450 premenopausal healthy women with regular menstrual cycles (24±4 years) as controls. The diagnosis of PCOS was based on the National In-stitute of Health criteria as follows: 1) amenorrhea or oligomen-orrhea (<8 menstrual cycles per year) and 2) clinical or bio-chemical hyperandrogenism.20 Clinical hyperandrogenism was defined as having hirsutism with a modified Ferriman-Gallwey score of ≥8.21 Biochemical hyperandrogenemia was defined as having a total testosterone level or free testosterone level above the 95th percentile for testosterone levels in healthy regular cy-cling women. Patients with similar clinical presentations, such as congenital adrenal hyperplasia, androgen-secreting tumors, and Cushing’s syndrome, were excluded from the study. Sub-jects were excluded if they had received any medication within 3 months of the evaluation or had used other drugs that could affect sex hormone metabolism or insulin actions (Fig. 1).
Written informed consent was obtained from all individual participants included in the study, and the Institutional Review
Board of Ewha Womans University Mokdong Hospital approved this study (187-30).
Methods
The height and weight were measured for all the subjects, and the body mass index (BMI) was calculated as the weight (kg)/ height (m)2. The waist circumference (WC) was measured in a standing position midway between the lower costal margin and the iliac crest. Blood pressure was calculated as the mean of two manual sphygmomanometer readings with the patient in the seated position. A single-frequency bioelectrical impedance plethysmograph was used for estimating body fatmass (InBody 230, Biospace Industry, Seoul, Korea). Standard electrocardio-graphic electrodes were placed on the hands and feet of the sub-jects, and isopropyl alcohol was used to clean each electrode attachment site. The subject’s legs were parted, and the arms were adducted by approximately 30° to prevent skin-to-skin contact. The percentage of fat was defined as the total mass of fat divided by the total body mass.
β-cell function (HOMA-β) was calculated using the following formula: 20×fasting insulin (mIU/L)/fasting glucose (mmol/L)-3.5.
Statistical analyses
[image:3.595.71.514.124.365.2]The statistical analyses were performed using the SPSS 18.0 software package for Windows (IBM Corporation, Chicago, IL,
Fig. 1. Selection and entry of subjects in this study. PCOS, polycystic ovary syndrome.
2950 women under 40 years of age who voluntarily participated in this study
450 premenopausal women with
PCOS based on the National Institute of Health criteria 962 premenopausal healthy women with regular menstrual cycles
512 subjects were excluded if they had received any medication within 3 months of the evaluation or had used other
drugs that could affect sex hormone metabolism
or insulin actions
450 controls 18 PCOS women
with impaired fasting glucose were excluded
432 PCOS women with a normal fasting glucose level
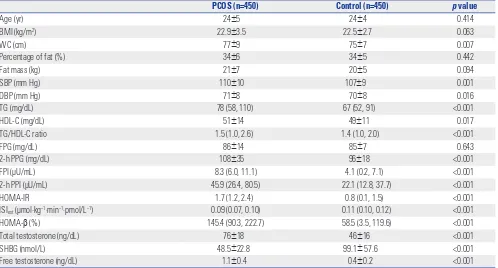
Table 1. Clinical and Biochemical Characteristics of Subjects
PCOS (n=450) Control (n=450) p value
Age (yr) 24±5 24±4 0.414
BMI (kg/m2) 22.9±3.5 22.5±2.7 0.063
WC (cm) 77±9 75±7 0.007
Percentage of fat (%) 34±6 34±5 0.442
Fat mass (kg) 21±7 20±5 0.094
SBP (mm Hg) 110±10 107±9 0.001
DBP (mm Hg) 71±8 70±8 0.016
TG (mg/dL) 78 (58, 110) 67 (52, 91) <0.001
HDL-C (mg/dL) 51±14 49±11 0.017
TG/HDL-C ratio 1.5 (1.0, 2.6) 1.4 (1.0, 2.0) <0.001
FPG (mg/dL) 86±14 85±7 0.643
2-h PPG (mg/dL) 108±35 96±18 <0.001
FPI (μU/mL) 8.3 (6.0, 11.1) 4.1 (0.2, 7.1) <0.001
2-h PPI (μU/mL) 45.9 (26.4, 80.5) 22.1 (12.8, 37.7) <0.001
HOMA-IR 1.7 (1.2, 2.4) 0.8 (0.1, 1.5) <0.001
ISIest (μmol·kg−1·min−1·pmol/L−1) 0.09 (0.07, 0.10) 0.11 (0.10, 0.12) <0.001
HOMA-β (%) 145.4 (90.3, 222.7) 58.5 (3.5, 119.6) <0.001
Total testosterone (ng/dL) 76±18 46±16 <0.001
SHBG (nmol/L) 48.5±22.8 99.1± 57.6 <0.001
Free testosterone (ng/dL) 1.1±0.4 0.4±0.2 <0.001
PCOS, polycystic ovary syndrome; BMI, body mass index; WC, waist circumference; SBP, systolic blood pressure; DBP, diastolic blood pressure; TG, triglycerides; HDL-C, high-density lipoprotein cholesterol; FPG, fasting plasma glucose; 2-h PPG, 2-h postload plasma glucose; FPI, fasting plasma insulin; 2-h PPI, 2-h postload plasma insulin; HOMA-IR, homeostasis model assessment of insulin resistance; ISIest, estimated insulin sensitivity index; HOMA-β, homeostasis model assess-ment of beta cell function; SHBG, sex hormone-binding globulin.
[image:3.595.43.541.403.671.2]USA). The Kolmogorov-Smirnov statistical method was used to analyze the continuous variables for normality. The levels of TG, the TG/HDL-C ratio, fasting plasma insulin (FPI), 2-h postload plasma insulin (2-h PPI), and HOMA-IR were logarithmically transformed to achieve a normal distribution. The quantitative variables were reported as means±standard deviations. The variables that showed a skewed deviation were reported using medians and interquartile ranges. The between-group differ-ences were assessed by the unpaired t-test and χ2 test, as appro-priate. Spearman’s rho correlation coefficient was applied to assess the correlation of the TG/HDL-C ratio with various met-abolic and reproductive hormonal variables. Evaluation of the TG/HDL-C ratios with a receiver-operating characteristic (ROC) curve was used to evaluate the sensitivity and specificity to pre-dict IR in women with PCOS. A p value <0.05 was considered significant.
RESULTS
Table 1 shows the clinical and biochemical characteristics of the women with PCOS and the controls. The values of WC, sys-tolic blood pressure (SBP), diassys-tolic blood pressure (DBP), TG, HDL cholesterol, TG/HDL-C ratio, 2-h postload plasma glucose (2-h PPG), FPI, 2-h PPI, HOMA-IR, and HOMA-β were
signifi-cantly higher, and the value of ISI was lower in the women with PCOS than in the controls (all p values <0.05). The concentra-tion of the fasting plasma glucose (FPG) did not differ between the women with PCOS and the controls.
The cutoff point of the TG/HDL-C ratio to predict IR, esti-mated by HOMA-IR, was 2.5 (sensitivity 61%, specificity 82%), and the area under the ROC curve (AUC) was 0.76 [95% confi-dence interval (CI) 0.70–0.82] (Fig. 2) in the women with PCOS. This value was nearly consistent with the cutoff of the 75th per-centile of the TG/HDL-C ratio in the PCOS group (2.6). The cut-off point of the TG/HDL-C ratio to predict IR defined as >95th percentile of ISIest, which was suggested as one of best replace-able parameters for insulin sensitivity index in young Korean women with PCOS,22 in 450 regular cycling women was 2.0 (sensitivity 69%, specificity 77%), and the AUC was 0.77 (95% CI 0.71–0.82) (Supplementary Fig. 1, only online). The cutoff points of the TG/HDL-C ratio to predict IGT/IFG/DM in wom-en with PCOS (swom-ensitivity 64%, specificity 72%, AUC 0.69, 95% CI 0.62–0.77) (Supplementary Fig. 2, only online) and IGT/DM in PCOS women with a normal fasting glucose (NFG) level (sensitivity 60%, specificity 72%, AUC 0.67, 95% CI 0.58–0.76) (Supplementary Fig. 3, only online) were 2.0, respectively.
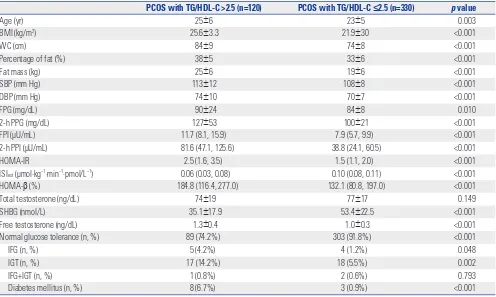
In the women with PCOS, the values of age, BMI, WC, SBP, DBP, percentage of fat, fat mass, free testosterone, FPG, 2-h PPG, FPI, 2-h PPI, HOMA-IR, and HOMA-β were significantly higher, and the levels of SHBG and ISI were lower in the women with PCOS with a TG/HDL-C ratio >2.5 compared with those with a TG/HDL-C ≤2.5 (all p<0.05). The prevalence rates of IFG, IGT, and DM were higher, and the prevalence of normal glu-cose tolerance was lower in the women with PCOS with a TG/ HDL-C ratio >2.5 than those with a TG/HDL-C ratio ≤2.5 (all p<0.05) (Table 2).
In the correlation analyses, TG/HDL-C ratio was positively correlated with BMI (r=0.527), WC (r=0.517), percentage of fat (r=0.459), fat mass (r=0.499), SBP (r=0.148), DBP (r=0.205), FPG (r=0.127), 2-h PPG (r=0.374), FPI (r=0.405), 2-h PPI (r=0.375), HOMA-IR (r=0.415), total testosterone (r=0.134), and free tes-tosterone (r=0.324), whereas negatively correlated with SHBG (r=-0.421) in the women with PCOS. TG/HDL-C ratio was posi-tively correlated with age (r=0.093), BMI (r=0.242), WC (r=0.251), percentage of fat (r=0.219), fat mass (r=0.231), SBP (r=0.129), DBP (r=0.147), FPG (r=0.168), FPI (r=0.284), 2-h PPI (r=0.268), and HOMA-IR (r=0.293), while negatively correlated with SHBG (r=-0.144) in the controls (all p values<0.05) (Table 3).
Among 432 women with PCOS with a NFG level, the preva-lence rates of IGT were significantly higher in the high TG/ HDL-C ratio group than in the low TG/HDL-C ratio group (15.6% vs. 5.6%, p=0.001). Although the prevalence rates of DM were quite low and not significant in both groups, the sum of IGT and DM was also significantly higher in the PCOS women with high TG/HDL-C ratio compared to those with low TG/ HDL-C ratio group (18.3% vs. 6.2%, p<0.001) (Table 4).
[image:4.595.57.294.71.359.2]In the regular cycling control subjects, the cutoff point of the Fig. 2. Receiver-operating characteristic curve of TG/HDL-C ratio to
pre-dict insulin resistance in women with polycystic ovary syndrome. TG, tri-glycerides; HDL-C, high-density lipoprotein cholesterol; AUC, area under the receiver-operating characteristic curve; CI, confidence interval.
0.0 0.2 0.4 0.6 0.8 1.0 1-specificity
1.0
0.8
0.6
0.4
0.2
0.0
Sensitivity
TG/HDL-C 2.5 Sensitivity 61% Specificity 82%
AUC 0.76 95% CI 0.70–0.82
TG/HDL-C Sensitivity Specificity
1.5 82% 56%
2.0 67% 73%
2.5 61% 82%
3.0 47% 88%
TG/HDL-C ratio to predict IR was 1.7 (sensitivity 79%, specificity 70%) (Supplementary Fig. 4, only online). This value was simi-lar to the cutoff of the highest quartile of the TG/HDL-C ratio in the control group (2.0). In 440 control women with NFG, the prevalence of IGT did not differ significantly in the high TG/ HDL-C ratio group and the low TG/HDL-C ratio group (2.7% vs. 1.8%, p=0.602, data not shown).
DISCUSSION
In this study, the cutoff value of the TG/HDL-C ratio for identi-fying individuals with IR was 2.5 in young Korean women with PCOS. This value was nearly the same as the 75th percentile of the TG/HDL-C ratio in women with PCOS (2.6). Many studies defined the 75th percentile value as a high TG/HDL-C ratio, and our study also confirmed that the 75th percentile could be used as an index of a high TG/HDL-C ratio to predict IR in the general population, without measurement of HOMA-IR or oth-er complex methods.
Among the women with PCOS with NFG, the prevalence of IGT was significantly higher in the PCOS subjects with a TG/ HDL-C ratio >2.5 than in the PCOS subjects with a TG/HDL-C
ratio ≤2.5. Because of the low rates of the DM in both groups, the prevalence of DM did not significantly differ. However, the sum of the prevalence rates of IGT and DM was also signifi-cantly higher in the PCOS subjects with a TG/HDL-C ratio >2.5 than in the PCOS subjects with a TG/HDL-C ratio ≤2.5 with stronger power of statistical significance. These differences were not shown in regular cycling healthy women with a high vs. low TG/HDL-C ratio, in which the prevalence rates of IGT were not different in both groups. Considering the young age (less than 40 years old) of this study subjects, low rate of DM prevalence is acceptable, and statistical insignificance is an ex-pected result. Further studies including older and postmeno-pausal women should be performed to confirm the definite difference of prevalence rates of DM in high vs. low TG/HDL-C ratio group.
IR is a status of an impaired metabolic response to either ex-ogenous or endex-ogenous insulin.23 There are many methods of evaluating IR. The glucose clamp technique is regarded as the best available standard for the measurement of insulin action.24 Simpler methods, such as a homeostatic model assessment calculation, have been developed to measure IR because of the cost and time requirements of the glucose clamp.
Many studies have observed that the plasma TG/HDL-C
ra-Table 2. Characteristics of Subjects with PCOS According to TG/HDL-C Ratio
PCOS with TG/HDL-C >2.5 (n=120) PCOS with TG/HDL-C ≤2.5 (n=330) p value
Age (yr) 25±6 23±5 0.003
BMI (kg/m2) 25.6±3.3 21.9±30 <0.001
WC (cm) 84±9 74±8 <0.001
Percentage of fat (%) 38±5 33±6 <0.001
Fat mass (kg) 25±6 19±6 <0.001
SBP (mm Hg) 113±12 108±8 <0.001
DBP (mm Hg) 74±10 70±7 <0.001
FPG (mg/dL) 90±24 84±8 0.010
2-h PPG (mg/dL) 127±53 100±21 <0.001
FPI (μU/mL) 11.7 (8.1, 15.9) 7.9 (5.7, 9.9) <0.001
2-h PPI (μU/mL) 81.6 (47.1, 125.6) 38.8 (24.1, 60.5) <0.001
HOMA-IR 2.5 (1.6, 3.5) 1.5 (1.1, 2.0) <0.001
ISIest (μmol·kg−1·min−1·pmol/L−1) 0.06 (0.03, 0.08) 0.10 (0.08, 0.11) <0.001
HOMA-β (%) 184.8 (116.4, 277.0) 132.1 (80.8, 197.0) <0.001
Total testosterone (ng/dL) 74±19 77±17 0.149
SHBG (nmol/L) 35.1±17.9 53.4±22.5 <0.001
Free testosterone (ng/dL) 1.3±0.4 1.0±0.3 <0.001
Normal glucose tolerance (n, %) 89 (74.2%) 303 (91.8%) <0.001
IFG (n, %) 5 (4.2%) 4 (1.2%) 0.048
IGT (n, %) 17 (14.2%) 18 (5.5%) 0.002
IFG+IGT (n, %) 1 (0.8%) 2 (0.6%) 0.793
Diabetes mellitus (n, %) 8 (6.7%) 3 (0.9%) <0.001
PCOS, polycystic ovary syndrome; TG, triglycerides; HDL-C, high-density lipoprotein cholesterol; BMI, body mass index; WC, waist circumference; SBP, systolic blood pressure; DBP, diastolic blood pressure; FPG, fasting plasma glucose; 2-h PPG, 2-h postload plasma glucose; FPI, fasting plasma insulin; 2-h PPI, 2-h post-load plasma insulin; HOMA-IR, homeostasis model assessment of insulin resistance; ISIest, estimated insulin sensitivity index; HOMA-β, homeostasis model as-sessment of beta cell function; SHBG, sex hormone-binding globulin; IFG, impaired fasting glucose; IGT, impaired glucose tolerance.
[image:5.595.43.539.381.678.2]tio is a useful and practical method for predicting IR and sug-gested optimal cutoff points of the plasma TG/HDL-C ratio in individuals of various ethnicities at cardiovascular risk.25,26 The cutoff value of the TG/HDL-C ratio for predicting IR in Korean women was different from the results for other ethnicities. The optimal TG/HDL-C ratio for predicting IR was 3.5 in a study preformed primarily in a Caucasian population including men and women,12 whereas the TG/HDL-C ratio could not identify IR in African-American women.27 In previous studies, the rela-tionship between the TG/HDL-C ratio and IR differed by gen-der. In European and Mexican populations, women and men whose TG/HDL-C ratios exceeded 2.5 and 3.5, respectively, were more insulin resistant than the rest of the population.15,28 Most of those values were derived from the 75th percentile of the TG/ HDL-C ratio or calculated by ROC curve analysis. In this study, we defined IR as more than the 95th percentile of HOMA-IR in 450 regular cycling healthy women, and then calculated the cutoff value of the TG/HDL-C ratio to identify IR in women with PCOS, which was 2.5. We calculated the 75th percentile of the TG/HDL-C ratio in women with PCOS, which was near 2.5.
We strongly suggest that a TG/HDL-C ratio of 2.5 is a predictor of IR in young Korean women with PCOS.
We observed that the TG/HDL-C ratio in women with PCOS was strongly correlated with various cardiovascular risk mark-ers such as obesity (BMI, WC, fat mass), postload hyperglyce-mia, IR (fasting and postload insulin, and HOMA-IR), and hy-perandrogenemia (SHBG and free testosterone). However, these correlations were weaker in regular cycling healthy wom-en than those with PCOS, suggesting that TG/HDL-C ratio can be considered as an integrated cardiovascular risk marker in this study group.
[image:6.595.55.556.348.565.2]The use of OGTT is recommended for screening for IGT and T2DM in women with PCOS.6 Recently, the 2-h PPI level was suggested as a useful tool to indicate IR in women with PCOS.29 However, performing the OGTT and measuring the 2-h PPI level are time-consuming because venous blood samples are required 120 min after the 75-g glucose load. The TG/HDL-C ra-tio might serve as an alternative and simpler method for identi-fying insulin resistant individuals. The TG/HDL-C ratio has been reported to be highly correlated with the visceral adiposity
Table 4. Prevalence of Impaired Glucose Tolerance and Diabetes Mellitus According to TG/HDL-C Ratio in PCOS Women with Normal Fasting Plasma Glucose
TG/HDL-C >2.5 (n=109) TG/HDL-C ≤2.5 (n=323) p value
FPG (mg/dL) 85±7 84±7 0.030
2-h PPG (mg/dL) 118±24 100±21 <0.001
IGT (n, %) 17 (15.6) 18 (5.6) 0.001
DM (n, %) 3 (2.8) 2 (0.6) 0.072
IGT or DM (n, %) 20 (18.3) 20 (6.2) <0.001
TG, triglycerides; HDL-C, high-density lipoprotein cholesterol; PCOS, polycystic ovary syndrome; FPG, fasting plasma glucose; 2-h PPG, 2-h postload plasma glu-cose; IGT, impaired glucose tolerance; DM, diabetes mellitus.
[image:6.595.57.551.629.706.2]Data are means±SD or number (percentage).
Table 3. Correlation Analysis between TG/HDL-C Ratio with Metabolic and Hormonal Parameters
PCOS (n=450) Control (n=450)
Spearman correlation coefficient p value Spearman correlation coefficient p value
Age 0.081 0.085 0.093 0.048
BMI 0.527 <0.001 0.242 <0.001
WC 0.517 <0.001 0.251 <0.001
Percentage of fat 0.459 <0.001 0.219 <0.001
Fat mass 0.499 <0.001 0.231 <0.001
SBP 0.148 0.002 0.129 0.006
DBP 0.205 <0.001 0.147 0.002
FPG 0.127 0.007 0.168 <0.001
2-h PPG 0.374 <0.001 0.067 0.159
FPI 0.405 <0.001 0.284 <0.001
2-h PPI 0.375 <0.001 0.268 <0.001
HOMA-IR 0.415 <0.001 0.293 <0.001
Total testosterone -0.134 0.004 -0.071 0.130
SHBG 0.324 <0.001 0.081 0.111
Free testosterone -0.421 <0.001 -0.144 0.004
index.30 In our study, the TG/HDL-C ratio was positively corre-lated with the percentage of fat and fat mass. The TG/HDL-C ratio provides an estimate of IR and was reported to identify pa-tients who are at risk of cardiovascular disease.9,15 Because wom-en with PCOS are at an increased risk of cardiovascular disease, the TG/HDL-C ratio would be a useful and predictive tool for assessing IR and cardiovascular disease in women with PCOS. Further prospective studies are needed to identify the associa-tion of TG/HDL-C ratio and the development of cardiovascular disease in women with PCOS.
In agreement with a previous study,17 the TG/HDL-C ratio was higher in women with PCOS than in the controls. The sensitivity and specificity for predicting IR were similar to the result of the previous study.15,28 Because the TG/HDL-C ratio is associated with IR, it is reasonable to assume that the group with a higher TG/HDL-C ratio has higher androgen levels. IR with secondary hyperinsulinemia has been reported to be as-sociated with hyperandrogenism.31
This study is the first to evaluate the utility of the TG/HDL-C ratio, which is a simple method for identifying individuals at risk of IGT in women with PCOS. Another strength of our study is the relatively large sample size, although it is a cross-sectional study. However, further studies need to be replicated in other populations to generalize the results. Furthermore, defining the IR based on HOMA-IR could not necessarily be correct because HOMA-IR is an indirect and rather variable measure of whole body IR.
In summary, the cutoff value of the TG/HDL-C ratio for pre-dicting IR was 2.5 in young Korean women with PCOS, and women with NFG and a high TG/HDL-C ratio had a higher prevalence of IGT. Therefore, Korean women with PCOS with a TG/HDL-C ratio >2.5 are recommended to be screened for OGTT to detect IGT even if they present with NFG.
ACKNOWLEDGEMENTS
This study was supported by the Ewha Global Top 5 Grant 2013 of Ewha Womans University.
REFERENCES
1. Ehrmann DA, Liljenquist DR, Kasza K, Azziz R, Legro RS, Ghazzi MN; PCOS/Troglitazone Study Group. Prevalence and predictors of the metabolic syndrome in women with polycystic ovary syn-drome. J Clin Endocrinol Metab 2006;91:48-53.
2. Ovalle F, Azziz R. Insulin resistance, polycystic ovary syndrome, and type 2 diabetes mellitus. Fertil Steril 2002;77:1095-105. 3. Legro RS, Kunselman AR, Dodson WC, Dunaif A. Prevalence and
predictors of risk for type 2 diabetes mellitus and impaired glucose tolerance in polycystic ovary syndrome: a prospective, controlled study in 254 affected women. J Clin Endocrinol Metab 1999;84: 165-9.
4. Lee H, Oh JY, Sung YA, Chung H, Cho WY. The prevalence and risk factors for glucose intolerance in young Korean women with poly-cystic ovary syndrome. Endocrine 2009;36:326-32.
5. Legro RS, Arslanian SA, Ehrmann DA, Hoeger KM, Murad MH, Pasquali R, et al. Diagnosis and treatment of polycystic ovary syn-drome: an Endocrine Society clinical practice guideline. J Clin En-docrinol Metab 2013;98:4565-92.
6. Salley KE, Wickham EP, Cheang KI, Essah PA, Karjane NW, Nes-tler JE. Glucose intolerance in polycystic ovary syndrome--a posi-tion statement of the Androgen Excess Society. J Clin Endocrinol Metab 2007;92:4546-56.
7. Kim JJ, Choi YM. Dyslipidemia in women with polycystic ovary syndrome. Obstet Gynecol Sci 2013;56:137-42.
8. Ginsberg HN, Zhang YL, Hernandez-Ono A. Regulation of plas-ma triglycerides in insulin resistance and diabetes. Arch Med Res 2005;36:232-40.
9. Kannel WB, Vasan RS, Keyes MJ, Sullivan LM, Robins SJ. Useful-ness of the triglyceride-high-density lipoprotein versus the cho-lesterol-high-density lipoprotein ratio for predicting insulin resis-tance and cardiometabolic risk (from the Framingham Offspring Cohort). Am J Cardiol 2008;101:497-501.
10. Kim-Dorner SJ, Deuster PA, Zeno SA, Remaley AT, Poth M. Should triglycerides and the triglycerides to high-density lipoprotein cho-lesterol ratio be used as surrogates for insulin resistance? Metabo-lism 2010;59:299-304.
11. Li C, Ford ES, Meng YX, Mokdad AH, Reaven GM. Does the asso-ciation of the triglyceride to high-density lipoprotein cholesterol ra-tio with fasting serum insulin differ by race/ethnicity? Cardiovasc Diabetol 2008;7:4.
12. McLaughlin T, Reaven G, Abbasi F, Lamendola C, Saad M, Waters D, et al. Is there a simple way to identify insulin-resistant individu-als at increased risk of cardiovascular disease? Am J Cardiol 2005; 96:399-404.
13. Salazar MR, Carbajal HA, Espeche WG, Leiva Sisnieguez CE, March CE, Balbín E, et al. Comparison of the abilities of the plasma tri-glyceride/high-density lipoprotein cholesterol ratio and the meta-bolic syndrome to identify insulin resistance. Diab Vasc Dis Res 2013;10:346-52.
14. Vega GL, Barlow CE, Grundy SM, Leonard D, DeFina LF. Triglycer-ide-to-high-density-lipoprotein-cholesterol ratio is an index of heart disease mortality and of incidence of type 2 diabetes mellitus in men. J Investig Med 2014;62:345-9.
15. Salazar MR, Carbajal HA, Espeche WG, Leiva Sisnieguez CE, Bal-bín E, Dulbecco CA, et al. Relation among the plasma triglyceride/ high-density lipoprotein cholesterol concentration ratio, insulin re-sistance, and associated cardio-metabolic risk factors in men and women. Am J Cardiol 2012;109:1749-53.
16. Park SY, Cho YJ, Lee SR, Chung H, Jeong K. Triglyceride is a useful surrogate marker for insulin resistance in Korean women with polycystic ovary syndrome. Yonsei Med J 2015;56:785-92. 17. Xiang SK, Hua F, Tang Y, Jiang XH, Zhuang Q, Qian FJ. Relationship
between serum lipoprotein ratios and insulin resistance in poly-cystic ovary syndrome. Int J Endocrinol 2012;2012:173281. 18. Kim JS, Kang HT, Shim JY, Lee HR. The association between the
tri-glyceride to high-density lipoprotein cholesterol ratio with insulin resistance (HOMA-IR) in the general Korean population: based on the National Health and Nutrition Examination Survey in 2007-2009. Diabetes Res Clin Pract 2012;97:132-8.
19. Kimm H, Lee SW, Lee HS, Shim KW, Cho CY, Yun JE, et al. Associa-tions between lipid measures and metabolic syndrome, insulin re-sistance and adiponectin. - Usefulness of lipid ratios in Korean men and women -. Circ J 2010;74:931-7.
21. Yildiz BO, Bolour S, Woods K, Moore A, Azziz R. Visually scoring hirsutism. Hum Reprod Update 2010;16:51-64.
22. Oh JY, Lee H, Sung YA. Usefulness of oral glucose insulin sensitiv-ity index in women with polycystic ovary syndrome. Ewha Med J 2011;34:27-32.
23. Consensus Development Conference on Insulin Resistance. 5-6 November 1997. American Diabetes Association. Diabetes Care 1998;21:310-4.
24. DeFronzo RA, Tobin JD, Andres R. Glucose clamp technique: a method for quantifying insulin secretion and resistance. Am J Physiol 1979;237:E214-23.
25. Gasevic D, Frohlich J, Mancini GB, Lear SA. The association be-tween triglyceride to high-density-lipoprotein cholesterol ratio and insulin resistance in a multiethnic primary prevention cohort. Me-tabolism 2012;61:583-9.
26. Sun Y, Li W, Hou X, Wang C, Li C, Zhang X, et al. Triglycerides and ratio of triglycerides to high-density lipoprotein cholesterol are bet-ter than liver enzymes to identify insulin resistance in urban mid-dle-aged and older non-obese Chinese without diabetes. Chin Med J (Engl) 2014;127:1858-62.
27. Sumner AE, Harman JL, Buxbaum SG, Miller BV 3rd, Tambay AV, Wyatt SB, et al. The triglyceride/high-density lipoprotein choles-terol ratio fails to predict insulin resistance in African-American women: an analysis of Jackson Heart Study. Metab Syndr Relat Disord 2010;8:511-4.
28. Murguía-Romero M, Jiménez-Flores JR, Sigrist-Flores SC, Espino-za-Camacho MA, Jiménez-Morales M, Piña E, et al. Plasma triglyc-eride/HDL-cholesterol ratio, insulin resistance, and cardiometa-bolic risk in young adults. J Lipid Res 2013;54:2795-9.
29. Saxena P, Prakash A, Nigam A. Efficacy of 2-hour post glucose insu-lin levels in predicting insuinsu-lin resistance in polycystic ovarian syn-drome with infertility. J Hum Reprod Sci 2011;4:20-2.
30. Salazar MR, Carbajal HA, Espeche WG, Aizpurúa M, Maciel PM, Reaven GM. Identification of cardiometabolic risk: visceral adipos-ity index versus triglyceride/HDL cholesterol ratio. Am J Med 2014; 127:152-7.