INTRODUCTION
Prediabetes is defined as a state of intermediate
hyperglyce-mia using two specific parameters, impaired fasting glucose defined as fasting plasma glucose of 110 mg/dL to 125 mg/dL and impaired glucose tolerance (IGT) defined as 2-h plasma glucose of 140−200 mg/dL after ingestion of 75 g of oral glucose load or a combination of the two based on a 2-h oral glucose tolerance test (OGTT).1 IGT and impaired fasting glycemia have been found to be markers of increased risk for the devel-opment of type 2 diabetes mellitus (DM).2 Previous studies have shown that prediabetes is an independent risk factor for car-diovascular disease3 and that prediabetes is associated with an increased risk of coronary and cardiovascular death.4
Abnormal hemoglobin A1c (HbA1c) level has been found to hold prognostic significance in non-diabetic patients under-Received: November 2, 2017 Revised: March 15, 2018
Accepted: April 2, 2018
Corresponding author: Dr. Seung-Woon Rha, Cardiovascular Center, Korea Uni-versity Guro Hospital, 148 Gurodong-ro, Guro-gu, Seoul 08308, Korea.
Tel: 82-2-2626-3020, Fax: 82-2-864-3062, E-mail: [email protected]
•The authors have no financial conflicts of interest.
© Copyright: Yonsei University College of Medicine 2018
This is an Open Access article distributed under the terms of the Creative Com-mons Attribution Non-Commercial License (http://creativecomCom-mons.org/licenses/ by-nc/4.0) which permits unrestricted non-commercial use, distribution, and repro-duction in any medium, provided the original work is properly cited.
The Impact of Prediabetes on Two-Year Clinical
Outcomes in Patients Undergoing Elective
Percutaneous Coronary Intervention
Woong gil Choi
1,2, Seung-Woon Rha
1, Byoung Geol Choi
1,3, Se Yeon Choi
1, Jae Kyeong Byun
1, Ahmed Mashaly
1,
Yoonjee Park
1, Won Young Jang
1, Woohyeun Kim
1, Jah Yeon Choi
1, Eun Jin Park
1, Jin Oh Na
1, Cheol Ung Choi
1,
Eung Ju Kim
1, Chang Gyu Park
1, and Hong Seog Seo
11Cardiovascular Center, Korea University Guro Hospital, Seoul;
2Department of Internal Medicine, Konkuk University School of Medicine, Chungju;
3Research Institute of Health Sciences, Korea University College of Health Science, Seoul, Korea.
Purpose: Prediabetes is an independent risk factor for cardiovascular disease. However, data on the long term adverse clinical outcomes of prediabetic patients undergoing percutaneous coronary intervention (PCI) with drug-eluting stents (DESs) are scarce.
Materials and Methods: The study population comprised 674 consecutive non-diabetic patients who underwent elective PCI be-tween April 2007 and November 2010. Prediabetes was defined as hemoglobin A1c (HbA1c) of 5.7% to 6.4%. Two-year cumulative clinical outcomes of prediabetic patients (HbA1c of 5.7% to 6.4%, n=242) were compared with those of a normoglycemic group (<5.7%, n=432).
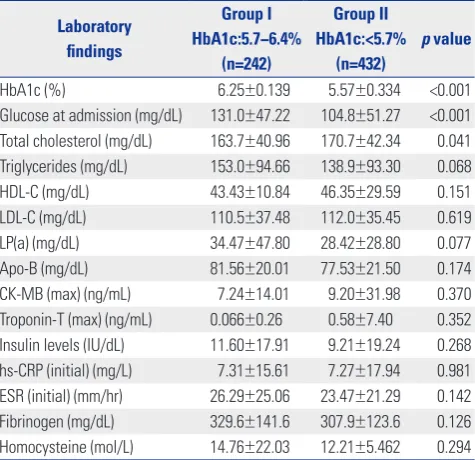
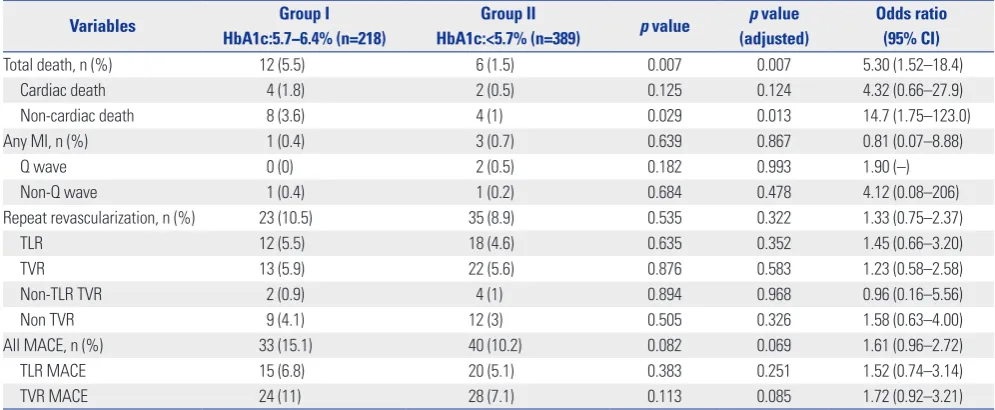
Results: Baseline clinical and angiographic characteristics were similar between the two groups, except for higher glucose levels (104.8±51.27 mg/dL vs. 131.0±47.22 mg/dL, p<0.001) on admission in the prediabetes group. There was no significant difference between the two groups in coronary angiographic parameters, except for a higher incidence of diffuse long lesion in the predia-betes group. For prediabetic patients, trends toward higher incidences of binary restenosis (15.6% vs. 9.8 %, p=0.066) and late loss (0.71±0.70 mm vs. 0.59±0.62 mm, p=0.076) were noted. During the 24 months of follow up, the incidence of mortality in predia-betic patients was higher than that in normoglycemic patients (5.5% vs. 1.5%, p=0.007).
Conclusion: In our study, a higher death rate and a trend toward a higher incidence of restenosis in patients with prediabetes up to 2 years, compared to those in normoglycemic patients, undergoing elective PCI with contemporary DESs.
Key Words: Hemoglobin A1c, prediabetes, percutaneous coronary intervention, drug-eluting stent
pISSN: 0513-5796 · eISSN: 1976-2437
going percutaneous coronary intervention (PCI).5,6 However, data regarding the impact of prediabetes on long-term clinical outcomes in patients undergoing PCI with drug-eluting stents (DESs) are limited. In the 1st generation DES era, the incidence of major adverse cardiac events (MACE) and specific cardio-vascular events during a 3-year follow-up period was reported at around 20% in prediabetic patients with sirolimus- or pacli-taxel-eluting stents.7 In addition, there are no data on predia-betic patients undergoing PCI according to recent guidelines on prediabetes, HbA1c of 5.7% to 6.4%,8 with both 1st and 2nd generation DESs. The clinical impact and management of pre-diabetic patients undergoing PCI remain unknown. Therefore, we investigated the long-term clinical outcomes in prediabetic patients undergoing PCI with DES compared to normoglyce-mic patients.
MATERIALS AND METHODS
Study design
From April 2007 to November 2010, all patients who underwent elective PCI with DESs had baseline laboratory studies, includ-ing HbA1c levels, completed before the procedure. PCI was performed using standard techniques, including predilation and subsequent intracoronary stenting. All patients were treat-ed with aspirin and receivtreat-ed 300−600 mg of clopidogrel pre-loaded before PCI, followed by daily administration of 75 mg that encouraged to be continued for at least 1 year. Other ad-junctive pharmacotherapy was administered at the discretion of the operator. Repeat coronary angiography was performed for recurrent symptoms or objective evidence of ischemia during provocative testing. Routine angiographic follow up was not undertaken. Patients who did not undergo HbA1c tests were excluded, as well as patients who were already diagnosed with DM and treated with diet therapy, anti-diabetic drugs, or in-sulin therapy. Finally, 674 patients with an HbA1c level of <6.5% were included in this analysis.
Approximately 24 months after the index intervention, all pa-tients meeting criteria for this study were contacted and invit-ed to participate in the study. After informinvit-ed consent was ob-tained from the patient or a family member, clinical follow up performed during an outpatient visit, telephone interviews, and hospital records were reviewed. The Medical Device Institu-tional Review Board (IRB) of Korea University Guro Hospital approved the study protocol (IRB Number: MD09002).
Study end points
The primary end point of this study was the incidence of MACE, defined as the composite of cardiovascular mortality, myocardial infarction (MI), or need for target vessel revascular-ization (TVR) within 24 months of the index PCI. Secondary end points included each component of the primary end point in addition to post-procedural rehospitalization, recurrent
angi-na, and stroke. All end point data were adjudicated by an experi-enced cardiovascular physician blinded to clinical details and outcomes.
Study definitions
DM was defined as treatment with insulin or oral hypogly-cemic medications or a HbA1c level ≥6.5% in non-diabetic pa-tients. Prediabetes was defined as HbA1c of 5.7% to 6.4%. This cutoff value has been deemed to be reasonable for identifying individuals at high risk for future diabetes and to whom the term pre-diabetes may be applied.8 Renal insufficiency was de-fined as a pre-procedural creatinine level ≥1.5 mg/dL. Proce-dural success was defined as <50% residual diameter stenosis and Thrombolysis In Myocardial Infarction (TIMI) grade 3 flow in the absence of major in-hospital complications (death, re-infarction, or urgent coronary artery bypass surgery). Acute myocardial infarction (AMI) was defined as the presence of new Q waves on a follow-up electrocardiogram or an elevation of creatinine kinase to ≥3 times normal. Cardiovascular mortal-ity was classified as death attributable to MI, congestive heart failure, or arrhythmia.
Statistical analysis
The SPSS 20.0 (IBM Corp., Armonk, NY, USA) statistics program was used for all analyses. For discrete variables, differences be-tween the two groups are expressed as counts and percentages, and were analyzed with χ2 or Fisher’s exact test. For continu-ous variables, differences between the two groups were evalu-ated by unpaired t test or Mann-Whitney rank test. Data are expressed as mean±SD. Statistical significance was defined as a p value of 0.05. The Cox proportional hazards regression model was used to estimate the independent association be-tween glucose levels and long-term mortality rates.
RESULTS
0.68±0.41 mm, p=0.397) of the coronary artery were similar be-tween the two groups. No significant differences were observed between the two groups with respect to other coronary
angio-Table 1. Baseline Clinical Characteristics of the Study Population
Variables
Group I HbA1c: 5.7−6.4%
(n=242)
Group II HbA1c:<5.7%
(n=432)
p value
Gender (male) 160 (66.1) 289 (66.8) 0.836
Age (yr) 63.44±9.96 61.81±11.39 0.053
Left ventricular EF (%) 54.76±8.49 55.14±8.33 0.607
BP (initial)
Systolic BP (mm Hg) 120.60±16.36 119.91±15.66 0.574
Diastolic BP (mm Hg) 74.47±10.14 74.16±10.21 0.700
Heart rate (bpm) 71.56±8.930 70.82±8.999 0.313
Unstable angina 167 (69) 273 (63.2) 0.639
Prior MI 9 (3.7) 6 (1.3) 0.055
Prior PTCA 22 (9) 22 (5) 0.048
Prior CABG 2 (0.8) 2 (0.4) 0.564
Hypertension 171 (70.6) 260 (60.1) 0.006
Dyslipidemia 59 (24.3) 101 (23.3) 0.770
Cerebrovascular accident 16 (6.6) 21 (4.8) 0.344
Peripheral artery disease 3 (1.2) 6 (1.3) 0.871
Chronic kidney disease 11 (4.5) 12 (2.7) 0.234
Current smoking 70 (28.9) 116 (26.8) 0.564
HbA1c, hemoglobin A1c; EF, ejection fraction; BP, blood pressure; MI, myo-cardial infarction; PTCA, percutaneous transluminal coronary angioplasty; CABG, coronary artery bypass graft.
[image:3.595.57.295.140.395.2]Data are expressed as counts (percentages) or mean±SD.
Table 2. Laboratory Findings in the Study Population
Laboratory findings
Group I HbA1c:5.7−6.4%
(n=242)
Group II HbA1c:<5.7%
(n=432)
p value
HbA1c (%) 6.25±0.139 5.57±0.334 <0.001
Glucose at admission (mg/dL) 131.0±47.22 104.8±51.27 <0.001
Total cholesterol (mg/dL) 163.7±40.96 170.7±42.34 0.041
Triglycerides (mg/dL) 153.0±94.66 138.9±93.30 0.068
HDL-C (mg/dL) 43.43±10.84 46.35±29.59 0.151
LDL-C (mg/dL) 110.5±37.48 112.0±35.45 0.619
LP(a) (mg/dL) 34.47±47.80 28.42±28.80 0.077
Apo-B (mg/dL) 81.56±20.01 77.53±21.50 0.174
CK-MB (max) (ng/mL) 7.24±14.01 9.20±31.98 0.370
Troponin-T (max) (ng/mL) 0.066±0.26 0.58±7.40 0.352
Insulin levels (IU/dL) 11.60±17.91 9.21±19.24 0.268
hs-CRP (initial) (mg/L) 7.31±15.61 7.27±17.94 0.981
ESR (initial) (mm/hr) 26.29±25.06 23.47±21.29 0.142
Fibrinogen (mg/dL) 329.6±141.6 307.9±123.6 0.126
Homocysteine (mol/L) 14.76±22.03 12.21±5.462 0.294
HbA1c, hemoglobin A1c; HDL-C, high density lipoprotein cholesterol; LDL-C, low density lipoprotein cholesterol; LP(a), lipoprotein (a); APO-B, apolipotein B; CK-MB, creatine kinase-MB; hs-CRP, high sensitivity C-reactive pro-tein; ESR, erythrocyte sedimentation rate.
graphic parameters, except diffuse long lesion was more fre-quent in prediabetic patients than in normoglycemic patients (39.6% vs. 31.0%, p=0.024). Among the procedural character-istics, there were no significant differences in stent type and number and angiographic success rate between the two groups.
Six to 9-month angiographic outcomes and major clinical outcome at 2 years are displayed in Tables 4 and 5. In predia-betic patients, we noted trends toward a higher incidence of
bi-Table 3. Coronary Angiographic Characteristics
Variables
Group I HbA1c: 5.7−6.4%
(n=242)
Group II HbA1c <5.7%
(n=432)
p value
Lesion site
LM 13 (5.3) 36 (8.3) 0.147
LAD 154 (63.6) 263 (60.8) 0.479
LCX 76 (31.4) 134 (31) 0.917
RCA 73 (30.1) 136 (31.4) 0.723
Multivessel disease 64 (26.4) 120 (27.7) 0.709
Ostial lesion (<5 mm) 57 (23.5) 122 (28.2) 0.184
Bifurcation lesion 106 (43.8) 196 (45.3) 0.694
Calcification lesion 38 (15.7) 66 (15.2) 0.884
Chronic total occlusion lesion 23 (9.5) 39 (9.0) 0.838
Diffuse long lesion (>30 mm) 96 (39.6) 134 (31.0) 0.024
Small vessel disease
(<2.75 mm) 116 (47.9) 179 (41.4) 0.103
Total lesion length (mm) 40.19±30.49 36.94±29.29 0.174
Vessel size (pre PCI, mm) 2.92±0.47 2.98±0.51 0.123
Vessel size (post PCI, mm) 3.19±0.49 3.22±0.49 0.405
MLD (pre PCI, mm) 0.65±0.39 0.68±0.41 0.397
MLD (post PCI, mm) 2.91±0.48 2.92±0.50 0.945
Acute gain (mm) 2.23±0.58 2.18±0.59 0.414
Number of vessel 1.30±0.52 1.32±0.55 0.575
Number of stent 1.64±0.93 1.58±0.91 0.356
Stents used
Sirolimus eluting stent 95 (39.2) 148 (34.2) 0.196
Paclitaxel eluting stent 71 (29.3) 138 (31.9) 0.482
Zoltarolimus eluting stent 51 (21) 93 (21.5) 0.890
Everolimus eluting stent 24 (9.9) 45 (10.4) 0.837
HbA1c, hemoglobin A1c; BP, blood pressure; LM, left main; LAD, left anterior descending; LCX, left circumflex; RCA, right coronary artery; PCI, percutane-ous coronary intervention; MLD, minimal luminal diameter.
Data are expressed as counts (percentages) or mean±SD.
Table 4. Angiographic Outcomes at 6 to 9 Months
Variables
Group I HbA1c: 5.7−6.4%
(n=166)
Group II HbA1c:<5.7%
(n=305)
p value
Binary restenosis (>50%) 26 (15.6) 30 (9.8) 0.066
Diameter stenosis (%) 27.15±23.47 23.65±20.10 0.127
MLD (mm) 2.24±0.88 2.39±0.82 0.084
Late loss (mm) 0.71±0.70 0.60±0.62 0.076
[image:3.595.314.554.202.570.2] [image:3.595.57.295.464.694.2] [image:3.595.315.554.636.726.2]nary restenosis (15.6% vs. 9.8%, p=0.066) and late loss (0.71± 0.70 mm vs. 0.59±0.62 mm, p=0.076). During the 24 months of follow up, mortality rate was significantly higher in the predia-betes group than the normoglycemia group (5.5% vs.1.5%, p= 0.007). However, the incidences of cardiac death, MI, target le-sion revascularization, and TVR were similar between the two groups. In analysis of independent predictors for mortality, prediabetes, age, chronic kidney disease (CKD), and chronic total occlusion (CTO) were identified as independent predic-tors of 24-month mortality (Table 6).
DISCUSSION
[image:4.595.41.539.86.291.2]The present study determined that the presence of prediabe-tes in patients undergoing elective PCI with DESs is associated with worse mid-term angiographic outcomes and 2-year major clinical outcomes than those in patients with normoglycemia. Table 5. Major Clinical Outcomes at 2 Years
Variables Group I
HbA1c:5.7−6.4% (n=218)
Group II
HbA1c:<5.7% (n=389) p value
p value
(adjusted)
Odds ratio (95% CI)
Total death, n (%) 12 (5.5) 6 (1.5) 0.007 0.007 5.30 (1.52–18.4)
Cardiac death 4 (1.8) 2 (0.5) 0.125 0.124 4.32 (0.66–27.9)
Non-cardiac death 8 (3.6) 4 (1) 0.029 0.013 14.7 (1.75–123.0)
Any MI, n (%) 1 (0.4) 3 (0.7) 0.639 0.867 0.81 (0.07–8.88)
Q wave 0 (0) 2 (0.5) 0.182 0.993 1.90 (–)
Non-Q wave 1 (0.4) 1 (0.2) 0.684 0.478 4.12 (0.08–206)
Repeat revascularization, n (%) 23 (10.5) 35 (8.9) 0.535 0.322 1.33 (0.75–2.37)
TLR 12 (5.5) 18 (4.6) 0.635 0.352 1.45 (0.66–3.20)
TVR 13 (5.9) 22 (5.6) 0.876 0.583 1.23 (0.58–2.58)
Non-TLR TVR 2 (0.9) 4 (1) 0.894 0.968 0.96 (0.16–5.56)
Non TVR 9 (4.1) 12 (3) 0.505 0.326 1.58 (0.63–4.00)
All MACE, n (%) 33 (15.1) 40 (10.2) 0.082 0.069 1.61 (0.96–2.72)
TLR MACE 15 (6.8) 20 (5.1) 0.383 0.251 1.52 (0.74–3.14)
TVR MACE 24 (11) 28 (7.1) 0.113 0.085 1.72 (0.92–3.21)
HbA1c, hemoglobin A1c; MI, myocardial infarction; TLR, target lesion revascularization; TVR, target vessel revascularization; MACE, major adverse cardiac event; CI, confidence interval.
Table 6. Predictors of Mortality at 24 Months
Variables Hazard ratio 95% CI p value
Prediabetes 5.306 1.527−18.43 0.009
Gender (male) 0.317 0.080−1.255 0.102
Age 1.140 1.060−1.225 0.001
Hypertension 4.958 0.611−40.18 0.134
Hyperlipidemia 0.757 0.211−2.709 0.669
Chronic kidney disease 14.668 3.101−69.36 0.001
Current smoker 0.484 0.084−2.755 0.413
Current alcoholic 4.470 0.711−28.09 0.110
Multivessel disease 0.354 0.073−1.698 0.194
Chronic total occlusion 4.743 1.007−22.33 0.049
Bifurcation Lesion 1.569 0.520−4.727 0.424
CI, confidence interval.
All stages of glucose abnormalities are associated with an increased risk of cardiovascular morbidity and mortality, mak-ing it important to identify them as early as possible.9 A signifi-cant proportion of dysglycemic individuals develop vascular damage during the pre-diabetes stage, although their gluco-metabolic perturbations often remain undetected until the first cardiovascular event.9 Prediabetes is associated with more advanced coronary artery disease, such as small vessel and diffuse coronary stenosis, compared with normoglycemia.10 The prevalence of patients with prediabetes and coronary ar-tery disease varies from study to study. A previous study report-ed a high prevalence of abnormal glucose tolerance in 181 pa-tients with AMI: IGT as prediabetes comprised 35% and diabetes 31%.11 In other studies, the prevalence of prediabetes and dia-betes, respectively, were about 25% and 53% in patients who underwent coronary angiography.10,12 Considering outcomes after PCI, Kataoka, et al.7 reported rates of MACE and repeat revascularization of 21% and 19% in a sirolimus-eluting stent group and 23% and 22% in a paclitaxel-eluting stent group, re-spectively, and the overall rate of non-fatal MI was about 5%. However, these results only reflected patients with 1st genera-tion DES. There are no data on clinical and angiographic out-comes for second generation DES in prediabetes patients. Al-though it is hard to compare our results with above-mentioned study directly, our results, reflecting 1st and 2nd generation DESs, showed better results, compared to previous studies, dem-onstrating improved current clinical situations.
[image:4.595.42.281.338.494.2]cut-off value ≥6.5%, as suggested by the American Diabetes Association, in previous studies, non-diabetic patients were changed as DM on admission. More recent, stricter applica-tions of guidelines might have affected the differences in clinical outcomes. Second, most previous studies demonstrated an association between HbA1c and MACE after AMI. Our results demonstrated clinical and angiographic outcomes for pa-tients who underwent elective PCI, exhibiting a stable disease state. Finally, we included patients with 2nd generation DESs in reflection of current clinical practice. Indeed, the everolim-us-eluting stent has been shown to be associated with signifi-cantly lower rates of adverse events, compared with first gen-eration sirolimus-eluting stents, in all-comer DM patients.13
Our study revealed trends toward higher incidences of bi-nary restenosis and late loss at 6−9-month angiographic fol-low up in comparison with normoglycemic patients. This result is consistent with studies in patients with diabetes. This trend of higher restenosis might have translated into higher inci-dences of TVR-MACE and total MACEs.
HbA1c values reflect a 2 to 3month average endogenous ex-posure to glucose, including postprandial spikes in blood glu-cose levels, and have low intra-individual variability, particu-larly in persons without diabetes.14 HbA1c values exceeding 6.0% may be a clinically useful marker to identify persons at risk for the development of not only diabetes but also cardiovas-cular disease and death.15 In studies using HbA1ccorrespond-ing to prediabetes, an abnormal HbA1c level was deemed a sig-nificant independent predictor of MACE, TVR, and cardiovascular mortality at 12 months after PCI in non-diabetic patients.5,6,16,17 Data from the Framingham study have indicated that, even in non-diabetic patients, there is an association between HbA1c and risk of cardiovascular disease.18 Kowalska, et al.19 demon-strated in a cohort of non-diabetic men referred for coronary an-giography that the number of diseased vessels were significantly correlated with increasing levels of HbA1c. In our study, pre-diabetic patients were associated with higher trends of TVR MACE and all MACE and significantly higher mortality, com-pared to normoglycemic patients at 24 months. Further, the presence of prediabetes, as well as older age, CKD, and CTO le-sion, was an independent predictor of mortality at 24 months (Table 6).
Our study has several limitations. First, this was a non-ran-domized, single-center retrospective analysis. This might have introduced significant bias in patient and device selection. Larg-er, multi-center studies would reinforce our results. Second, our selection process may have limited our findings, as we did not evaluate glucose metabolic function with an OGTT, which is necessary for accurate diagnosis of IGT.20 To diagnose pre-diabetes, our study protocol used HbA1c. No routine OGTT tests were performed to detect undiagnosed DM or prediabetes af-ter admission, and thus, part of the observed association be-tween hyperglycemia and outcomes might be due to undiag-nosed DM or prediabetes in some patients. However, the
International Expert Committee Report recommended using HbA1c assay as the preferred method for DM diagnosis, and suggested the diagnosis if HbA1c levels are ≥6.5%.21 The Ameri-can Diabetes Association defines prediabetes as an HbA1c of 5.7% to 6.4%.8 HbA1c gives a better measure of overall glycemic exposure and likely risk for long-term complications. There is no need for fasting or timed samples, and HbA1c is less affected by conditions to produce perturbations in glucose levels. More-over, it is a better guide for clinical management of patients. Third, in this study, routine angiographic follow-up was not per-formed, and thus, absolute restenosis rates of all of the study population could not be analyzed.
In conclusion, patients with prediabetes were found to be as-sociated with higher trends of mid-term angiographic reste-nosis and late loss in our study. Further, there was a death rate among patients with prediabetes up to 2 years, compared to normoglycemic individuals, undergoing elective PCI with con-temporary DESs. Even in the DES era, prediabetes using HbA1c can be a significant prognostic factor in patients undergoing elective PCI.
ORCID
Woong gil Choi https://orcid.org/0000-0002-2235-8041 Seung-Woon Rha https://orcid.org/0000-0001-9456-9852
REFERENCES
1. Bansal N. Prediabetes diagnosis and treatment: a review. World J Diabetes 2015;6:296-303.
2. Unwin N, Shaw J, Zimmet P, Alberti KG. Impaired glucose toler-ance and impaired fasting glycaemia: the current status on defi-nition and intervention. Diabet Med 2002;19:708-23.
3. DeFronzo RA, Abdul-Ghani M. Assessment and treatment of car-diovascular risk in prediabetes: impaired glucose tolerance and impaired fasting glucose. Am J Cardiol 2011;108(3 Suppl):3B-24B. 4. DECODE Study Group, the European Diabetes Epidemiology Group. Glucose tolerance and cardiovascular mortality: compari-son of fasting and 2-hour diagnostic criteria. Arch Intern Med 2001;161:397-405.
5. Corpus RA, O’Neill WW, Dixon SR, Timmis GC, Devlin WH. Rela-tion of hemoglobin A1c to rate of major adverse cardiac events in nondiabetic patients undergoing percutaneous coronary revas-cularization. Am J Cardiol 2003;92:1282-6.
6. Timmer JR, Hoekstra M, Nijsten MW, van der Horst IC, Ottervan-ger JP, SlinOttervan-gerland RJ, et al. Prognostic value of admission glyco-sylated hemoglobin and glucose in nondiabetic patients with ST-segment-elevation myocardial infarction treated with percutaneous coronary intervention. Circulation 2011;124:704-11.
7. Kataoka Y, Yagi N, Kokubu N, Kasahara Y, Abe M, Otsuka Y. Effi-cacy of paclitaxel-eluting stent in patients with impaired glucose tolerance--comparison with sirolimus-eluting stent. Circ J 2011; 75:868-73.
8. American Diabetes Association. Diagnosis and classification of diabetes mellitus. Diabetes Care 2010;33 Suppl 1:S62-9.
10. Kataoka Y, Yasuda S, Morii I, Otsuka Y, Kawamura A, Miyazaki S. Quantitative coronary angiographic studies of patients with angina pectoris and impaired glucose tolerance. Diabetes Care 2005;28: 2217-22.
11. Norhammar A, Tenerz A, Nilsson G, Hamsten A, Efendíc S, Rydén L, et al. Glucose metabolism in patients with acute myocardial in-farction and no previous diagnosis of diabetes mellitus: a prospec-tive study. Lancet 2002;359:2140-4.
12. de la Hera JM, Delgado E, Hernández E, García-Ruiz JM, Vegas JM, Avanzas P, et al. Prevalence and outcome of newly detected dia-betes in patients who undergo percutaneous coronary interven-tion. Eur Heart J 2009;30:2614-21.
13. Kedhi E, Gomes ME, Lagerqvist B, Smith JG, Omerovic E, James S, et al. Clinical impact of second-generation everolimus-eluting stent compared with first-generation drug-eluting stents in dia-betes mellitus patients: insights from a nationwide coronary in-tervention register. JACC Cardiovasc Interv 2012;5:1141-9. 14. Selvin E, Crainiceanu CM, Brancati FL, Coresh J. Short-term
vari-ability in measures of glycemia and implications for the classifica-tion of diabetes. Arch Intern Med 2007;167:1545-51.
15. Selvin E, Steffes MW, Zhu H, Matsushita K, Wagenknecht L, Pan-kow J, et al. Glycated hemoglobin, diabetes, and cardiovascular risk in nondiabetic adults. N Engl J Med 2010;362:800-11.
16. Timmer JR, van der Horst IC, Ottervanger JP, Henriques JP,
Hoorn-tje JC, de Boer MJ, et al. Prognostic value of admission glucose in non-diabetic patients with myocardial infarction. Am Heart J 2004; 148:399-404.
17. Lee YS, Jeong MH, Kim KH, Kang DG, Yun KH, Lee SH, et al. The relationship between hemoglobin A1c and major adverse cardiac events in nondiabetic acute myocardial infarction patients under-went primary percutaneous coronary intervention. Korean Circ J 2005;35:369-74.
18. Singer DE, Nathan DM, Anderson KM, Wilson PW, Evans JC. As-sociation of HbA1c with prevalent cardiovascular disease in the original cohort of the Framingham Heart Study. Diabetes 1992;41: 202-8.
19. Kowalska I, Prokop J, Bachórzewska-Gajewska H, Telejko B, Kinalskal I, Kochman W, et al. Disturbances of glucose metabolism in men referred for coronary arteriography. Postload glycemia as predictor for coronary atherosclerosis. Diabetes Care 2001;24: 897-901.
20. Farhan S, Jarai R, Tentzeris I, Kautzky-Willer A, Samaha E, Smetana P, et al. Comparison of HbA1c and oral glucose tolerance test for diagnosis of diabetes in patients with coronary artery disease. Clin Res Cardiol 2012;101:625-30.